Downloaded 1,011 times

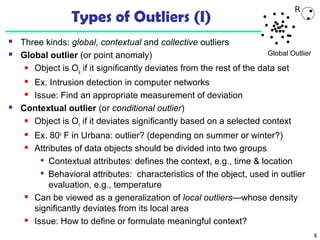
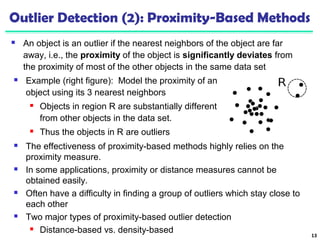
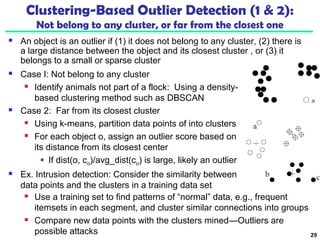
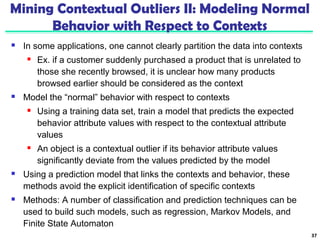
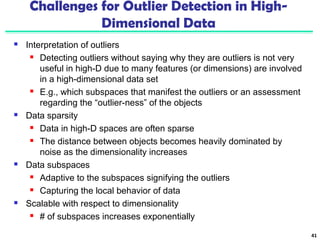
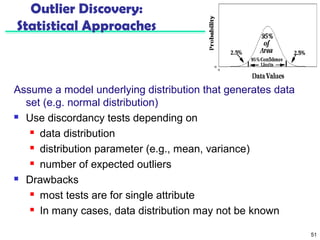
![Approach III: Modeling High-Dimensional Outliers
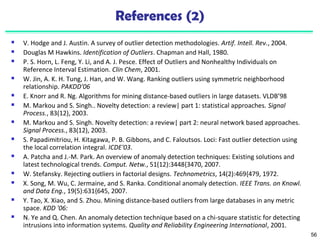
Develop new models for high-dimensional
outliers directly
Avoid proximity measures and adopt
new heuristics that do not deteriorate
in high-dimensional data
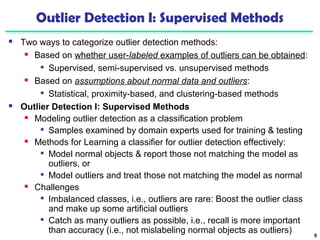
A set of points
form a cluster
except c (outlier)
Ex. Angle-based outliers: Kriegel, Schubert, and Zimek [KSZ08]
For each point o, examine the angle Δxoy for every pair of points x, y.
Point in the center (e.g., a), the angles formed differ widely
An outlier (e.g., c), angle variable is substantially smaller
Use the variance of angles for a point to determine outlier
Combine angles and distance to model outliers
Use the distance-weighted angle variance as the outlier score
Angle-based outlier factor (ABOF):
Efficient approximation computation method is developed
It can be generalized to handle arbitrary types of data 44](https://image.slidesharecdn.com/12outlier-140913212203-phpapp02/85/Data-mining-Concepts-and-Techniques-Chapter12-outlier-Analysis-44-320.jpg)

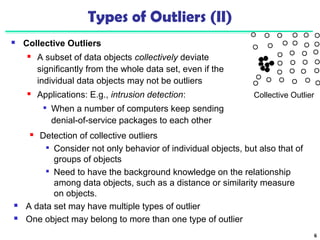
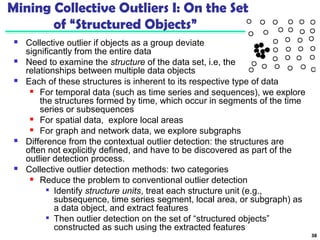
![52
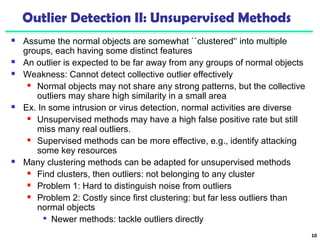
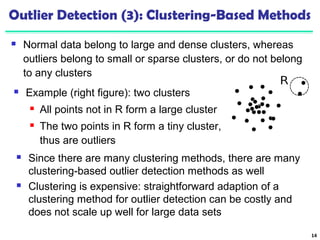
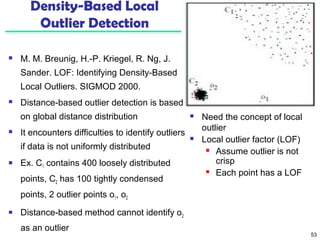
Outlier Discovery: Distance-Based Approach
Introduced to counter the main limitations imposed by
statistical methods
We need multi-dimensional analysis without knowing
data distribution
Distance-based outlier: A DB(p, D)-outlier is an object O in
a dataset T such that at least a fraction p of the objects in T
lies at a distance greater than D from O
Algorithms for mining distance-based outliers [Knorr & Ng,
VLDB’98]
Index-based algorithm
Nested-loop algorithm
Cell-based algorithm](https://image.slidesharecdn.com/12outlier-140913212203-phpapp02/85/Data-mining-Concepts-and-Techniques-Chapter12-outlier-Analysis-52-320.jpg)

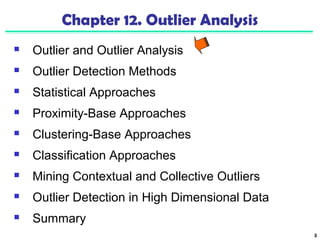
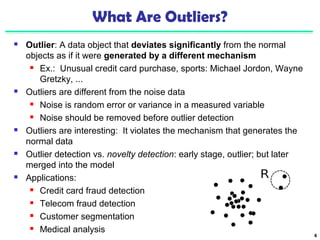
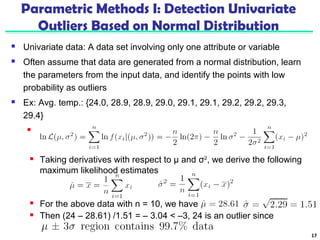
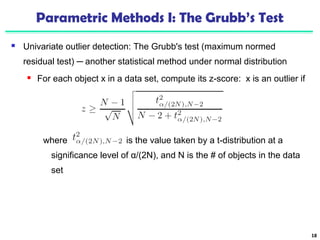
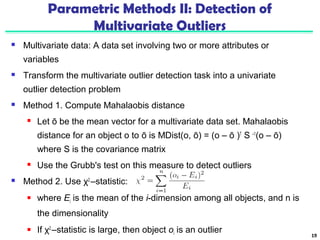
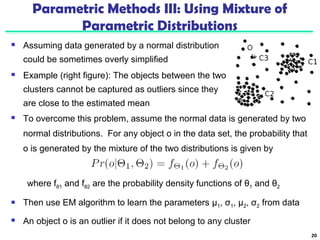
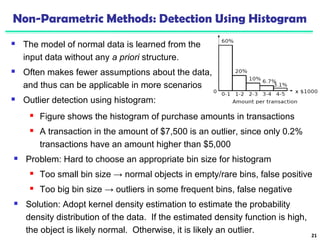
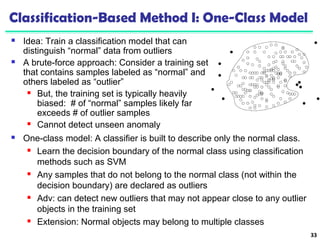
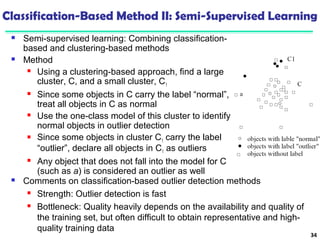
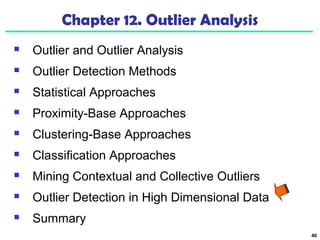
Chapter 12 of 'Data Mining: Concepts and Techniques' discusses outlier analysis, defining outliers as data points that significantly deviate from normal patterns. The chapter explores various detection methods including statistical, proximity-based, and clustering approaches, as well as challenges faced in outlier detection like noise interference and the ambiguity in defining normal behavior. Applications for outlier detection are highlighted across fields like fraud detection and customer segmentation.