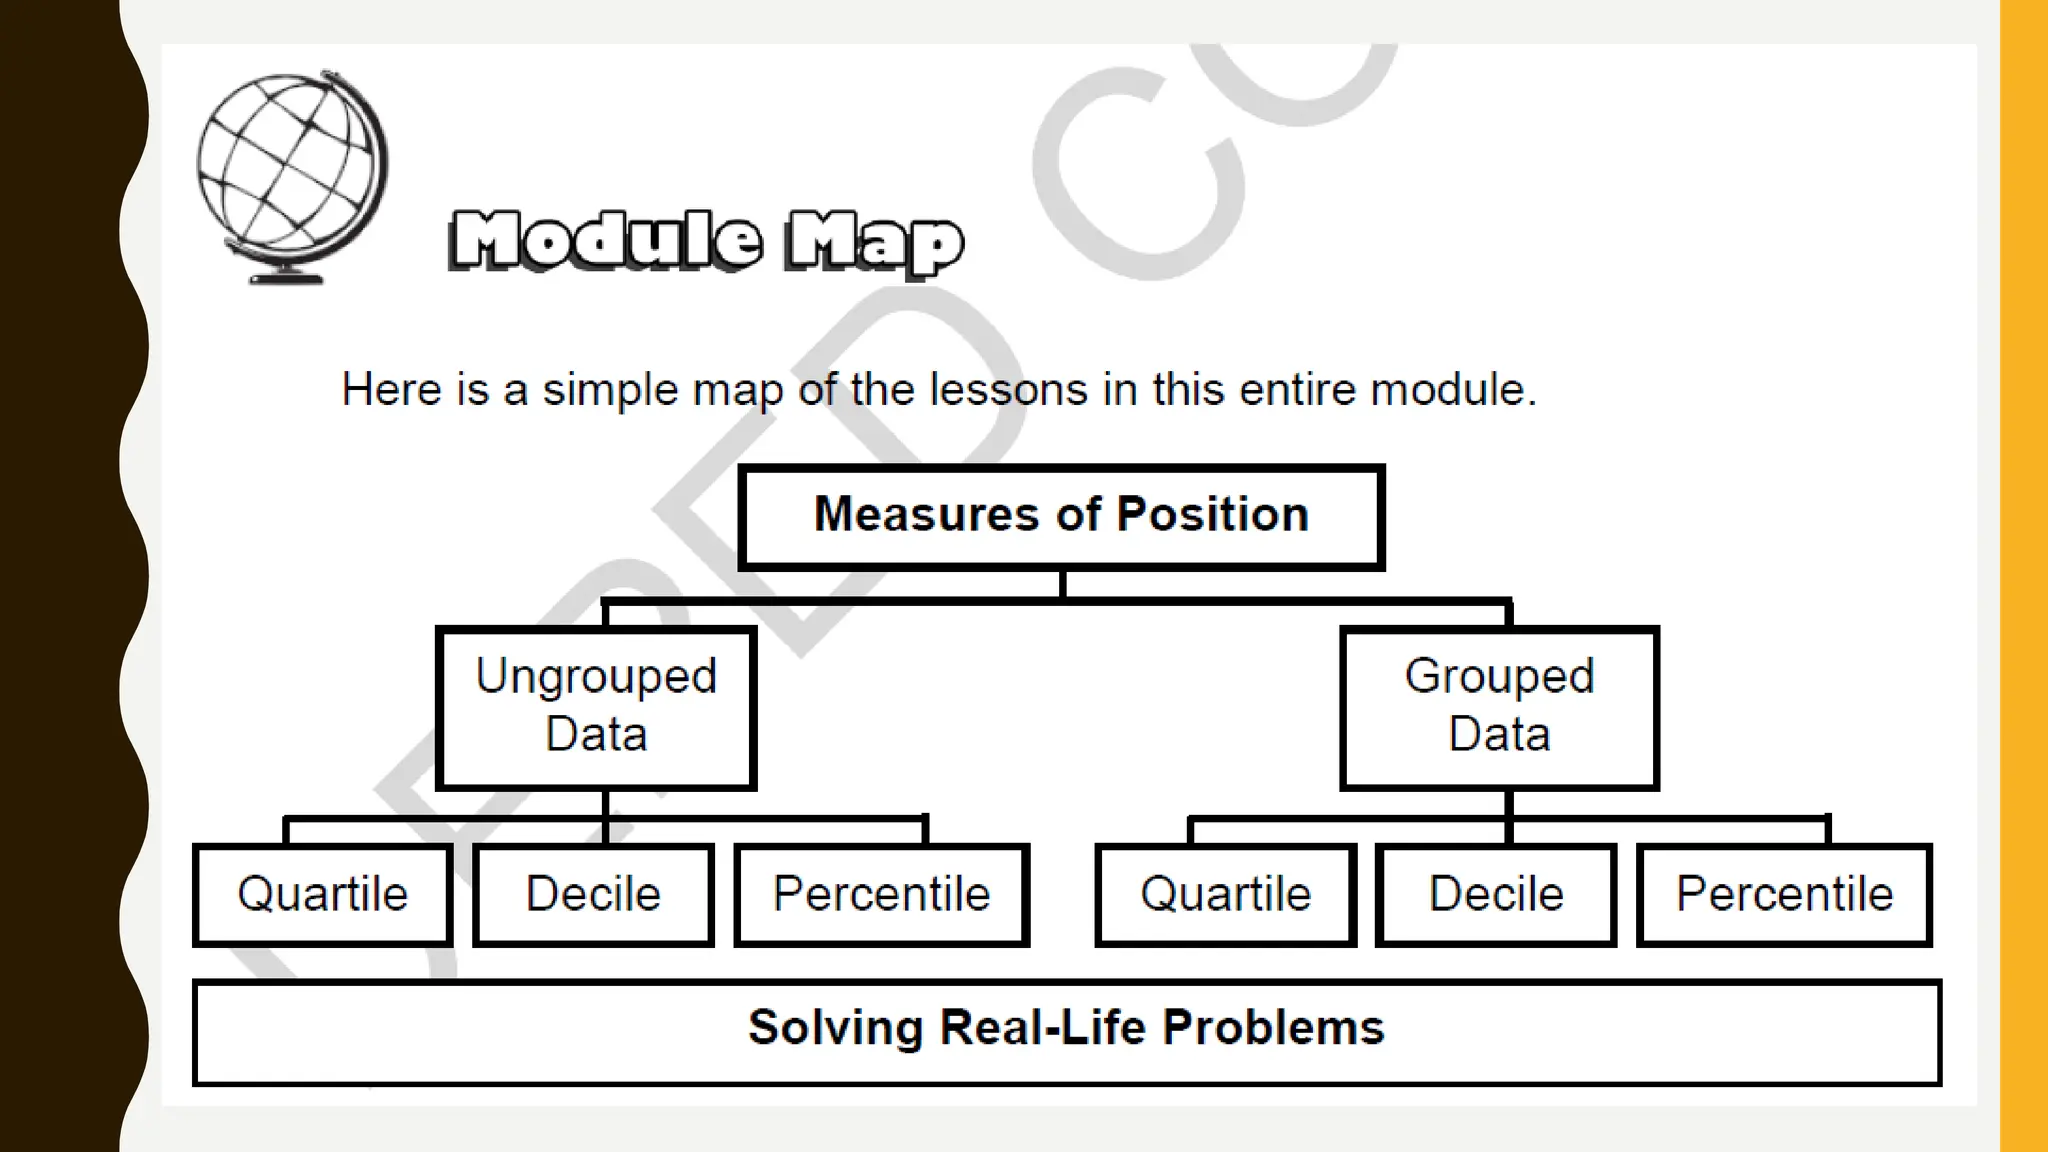
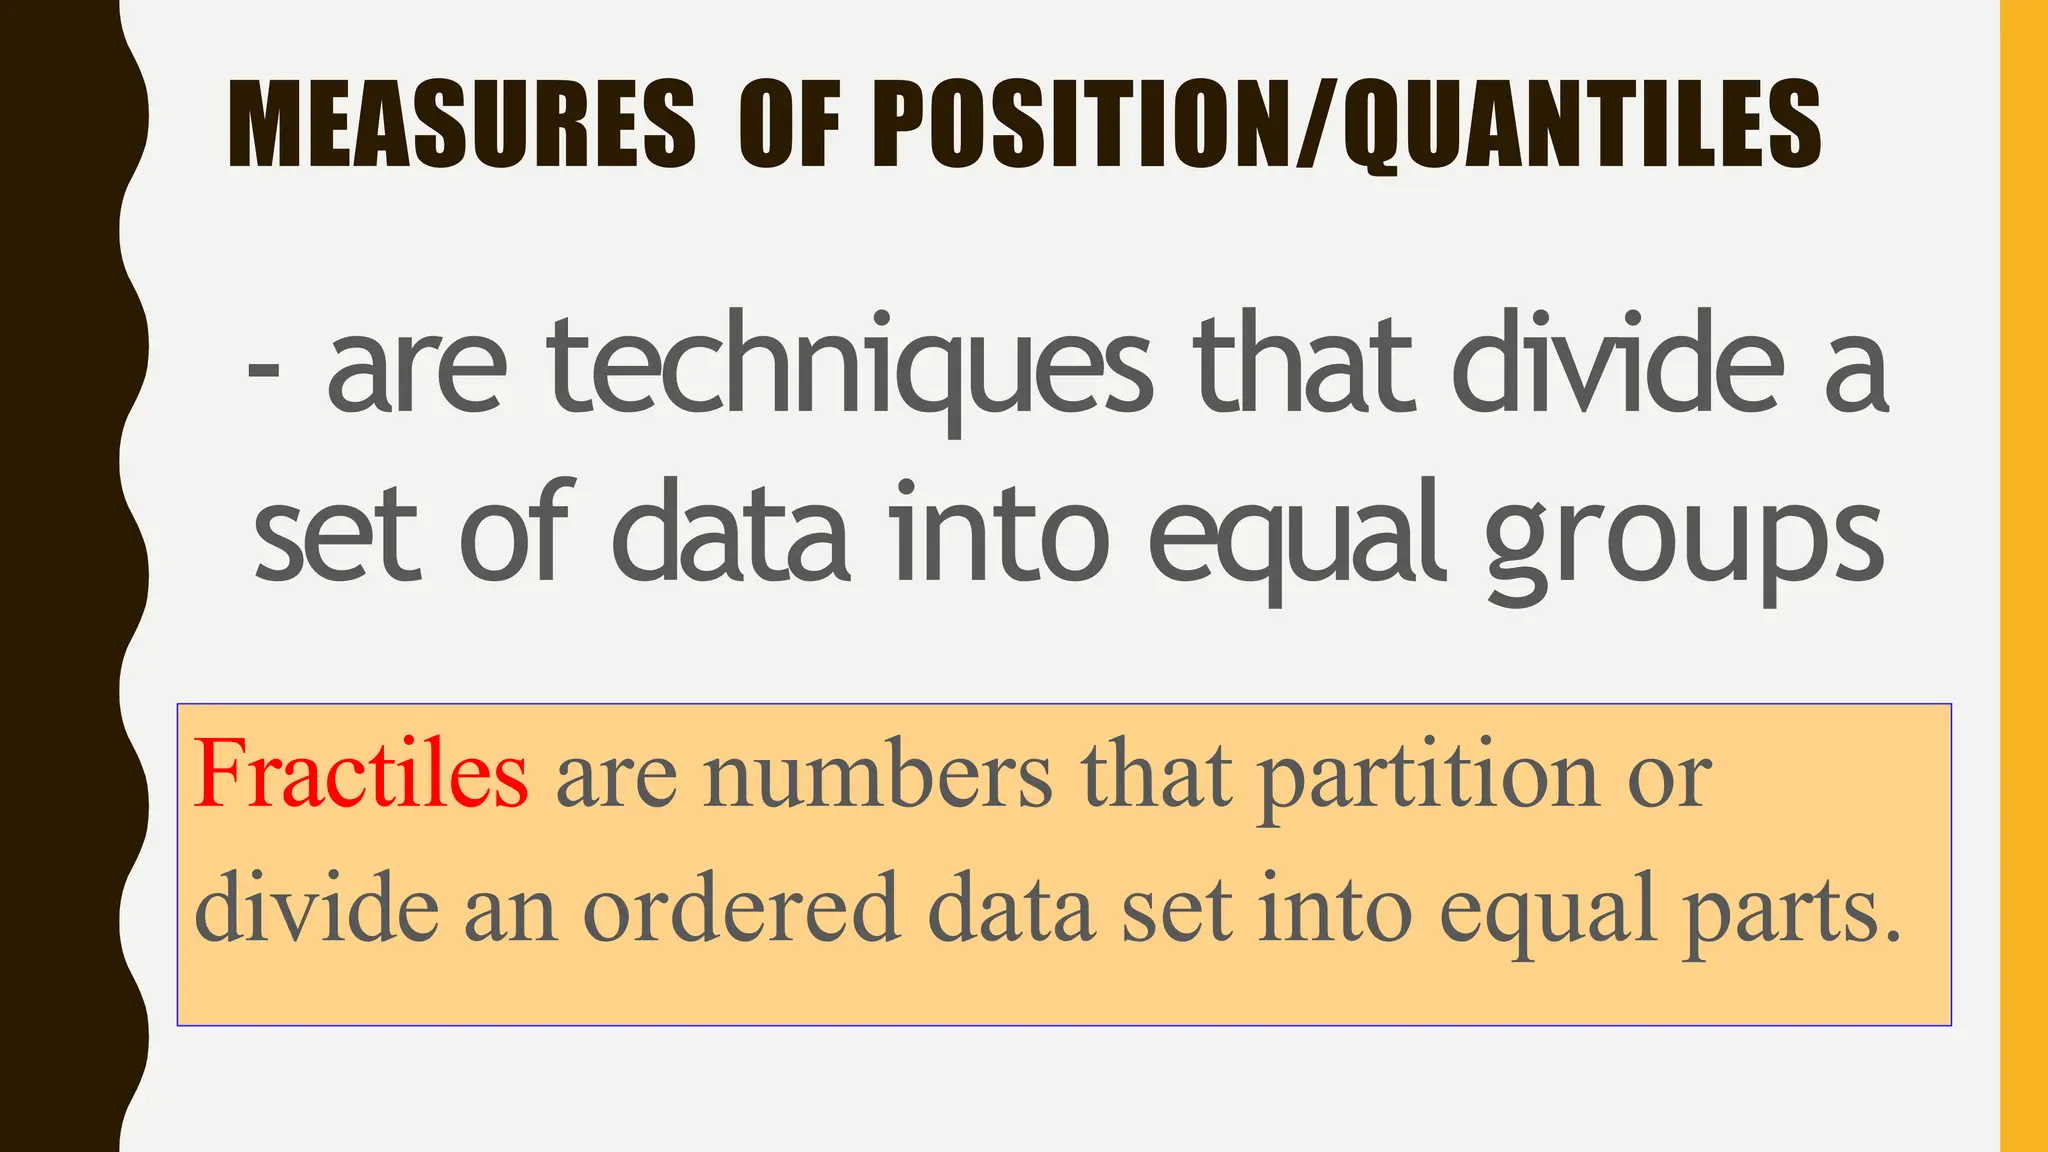
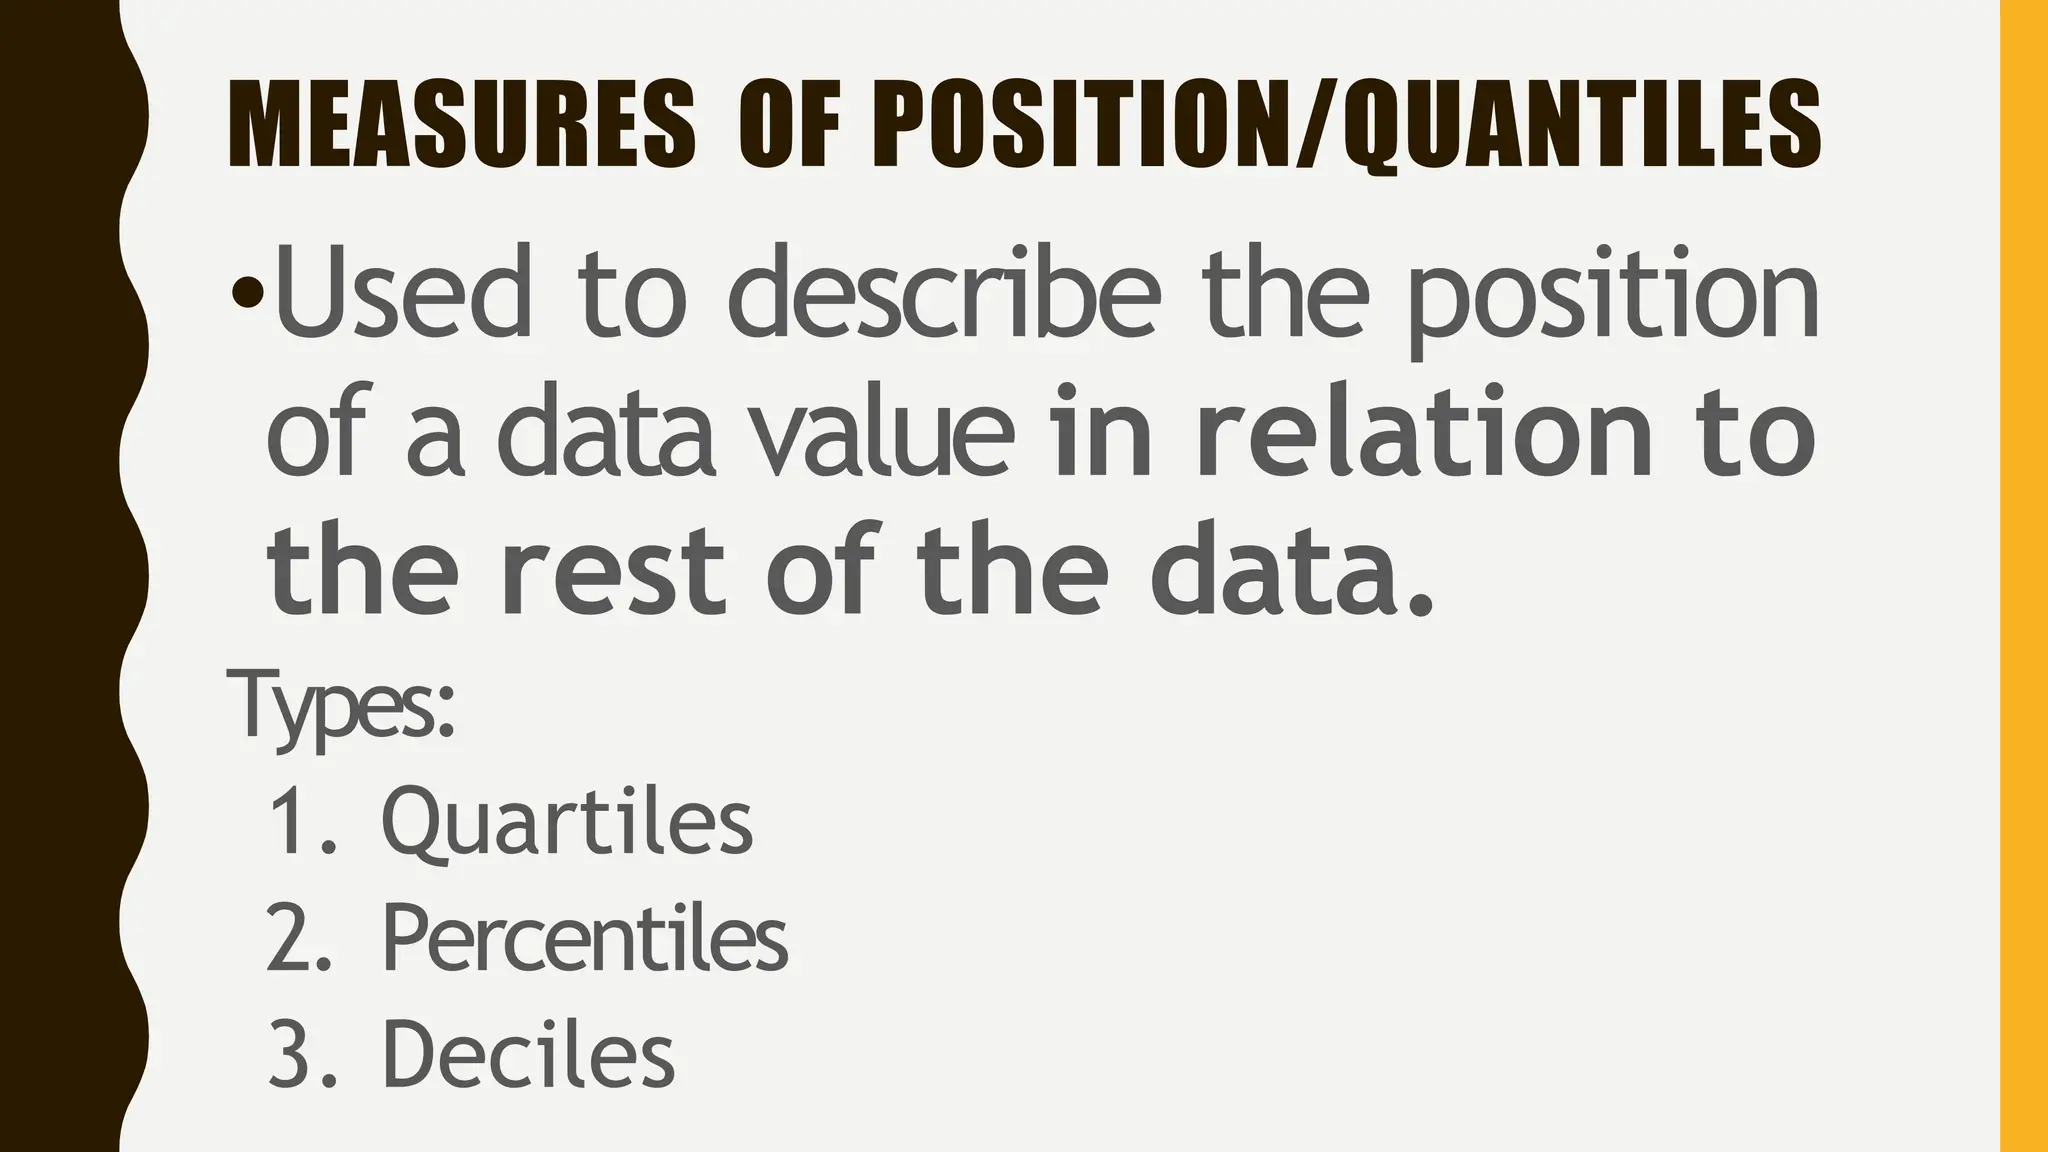
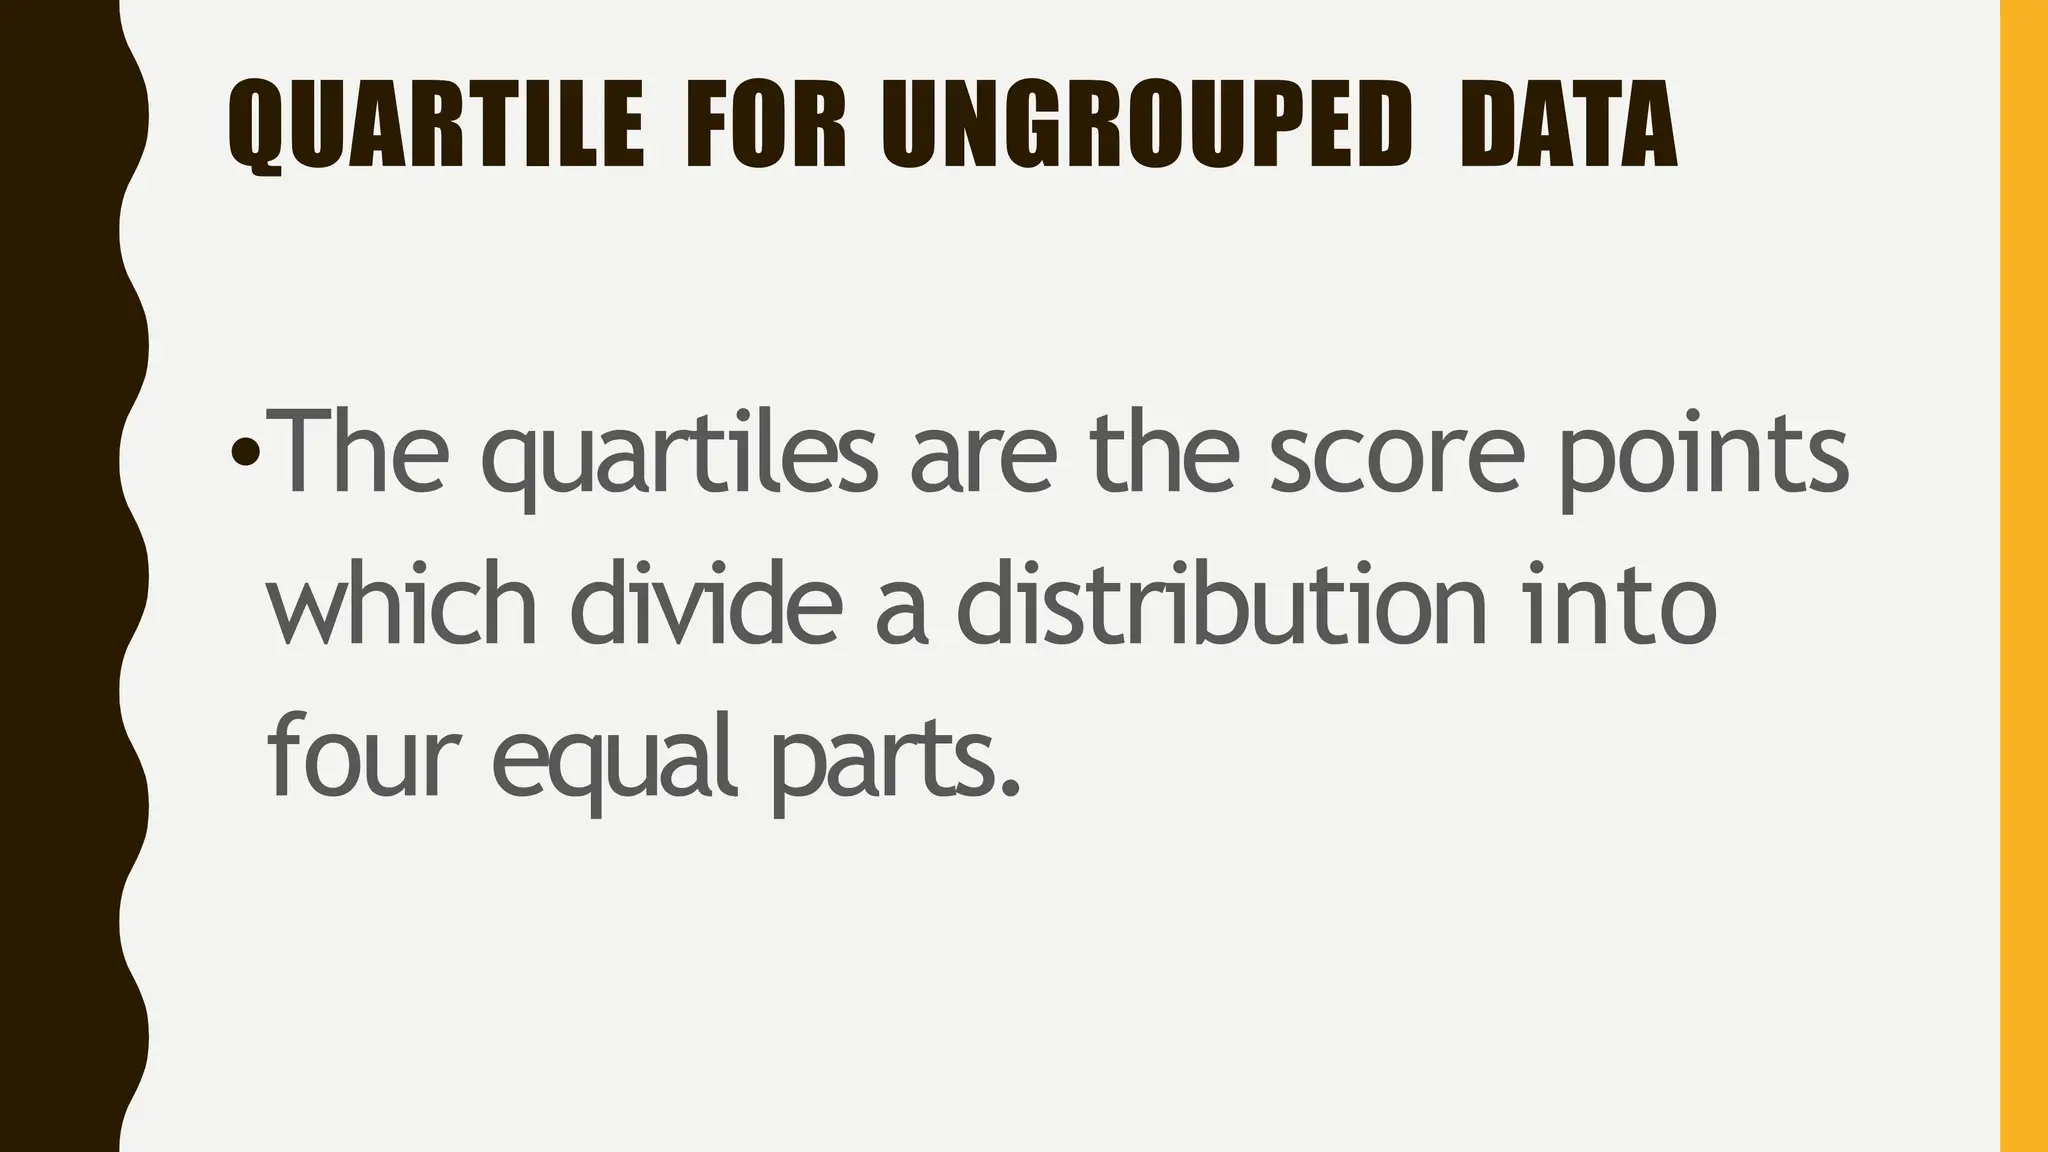
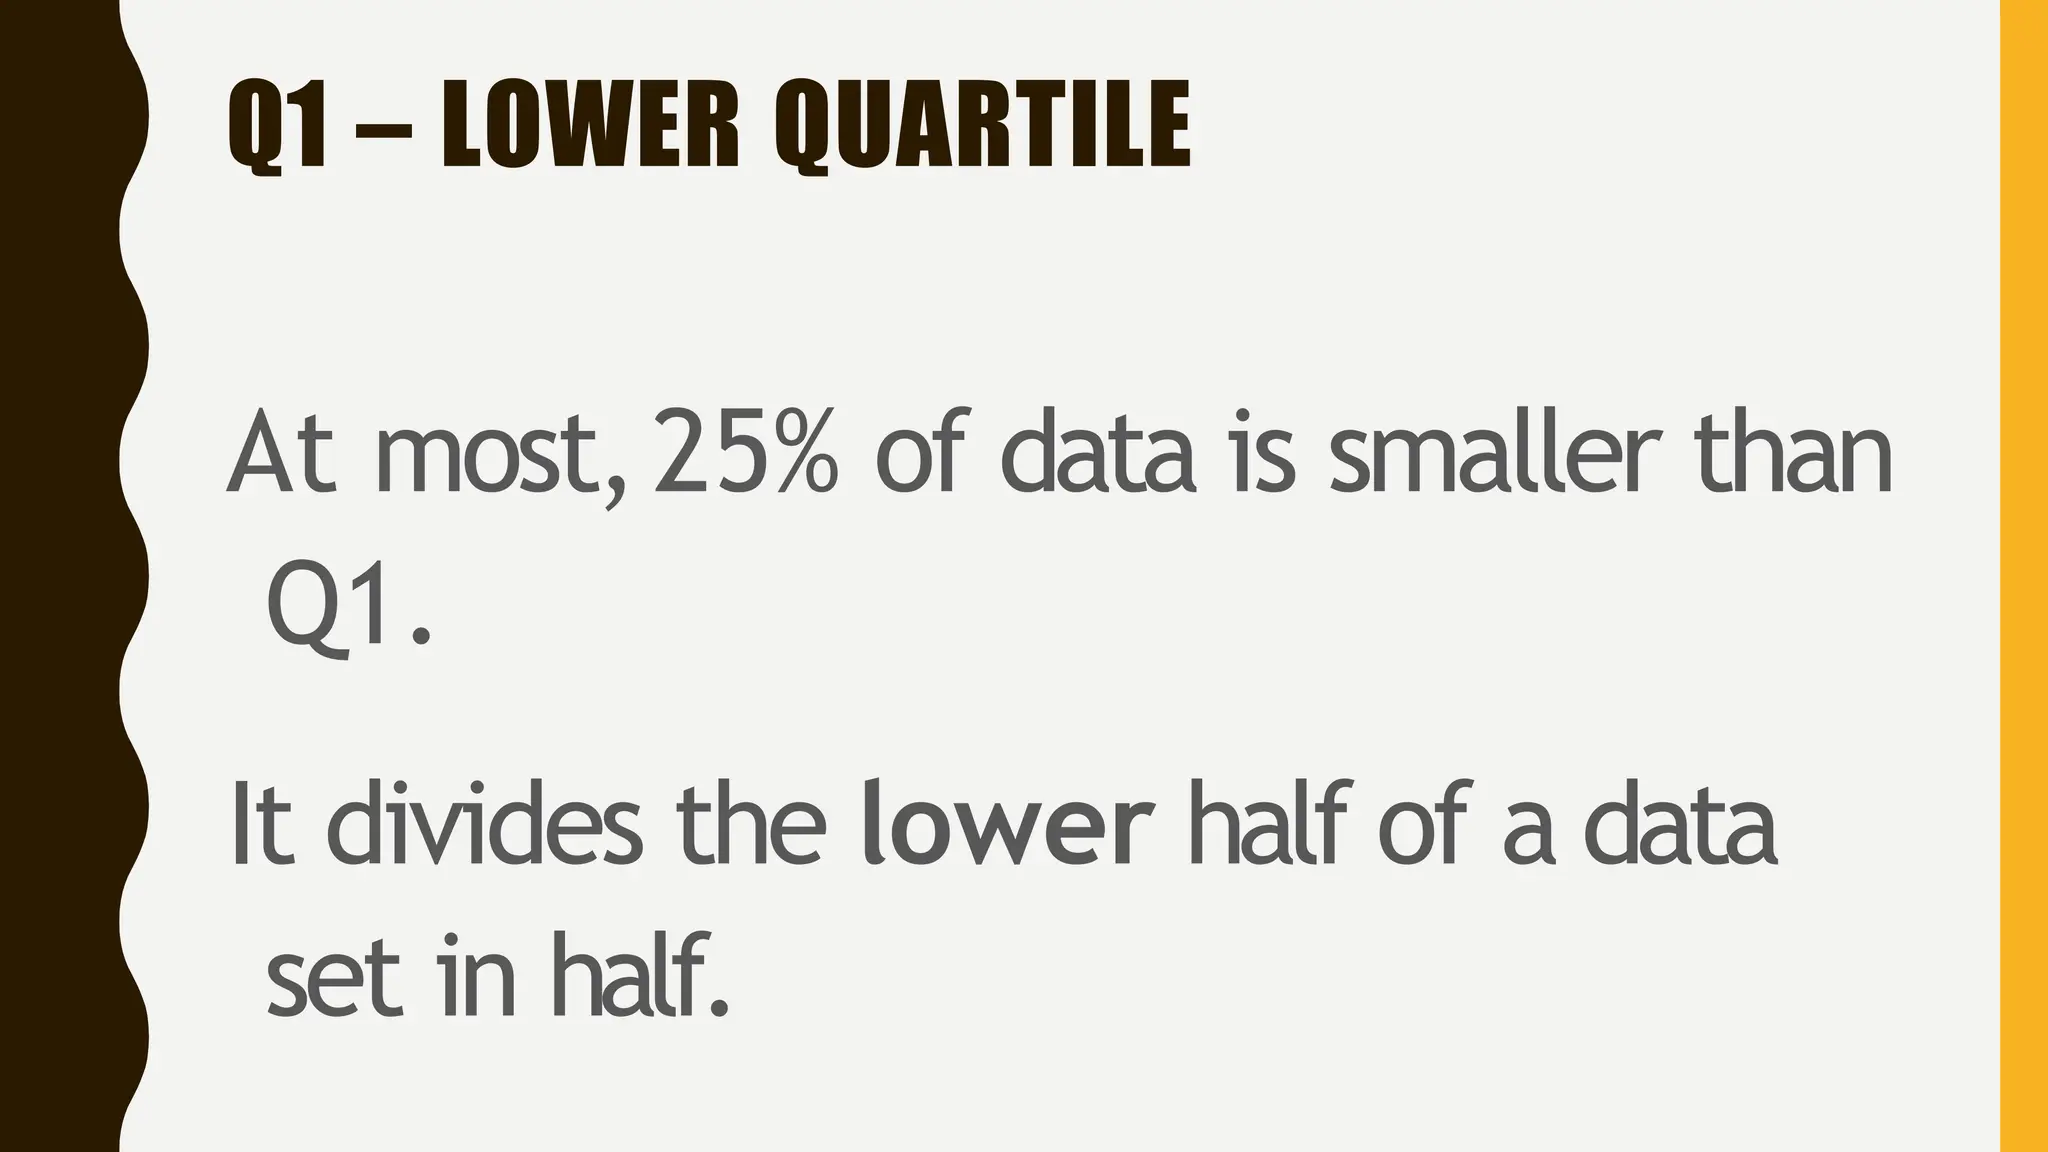
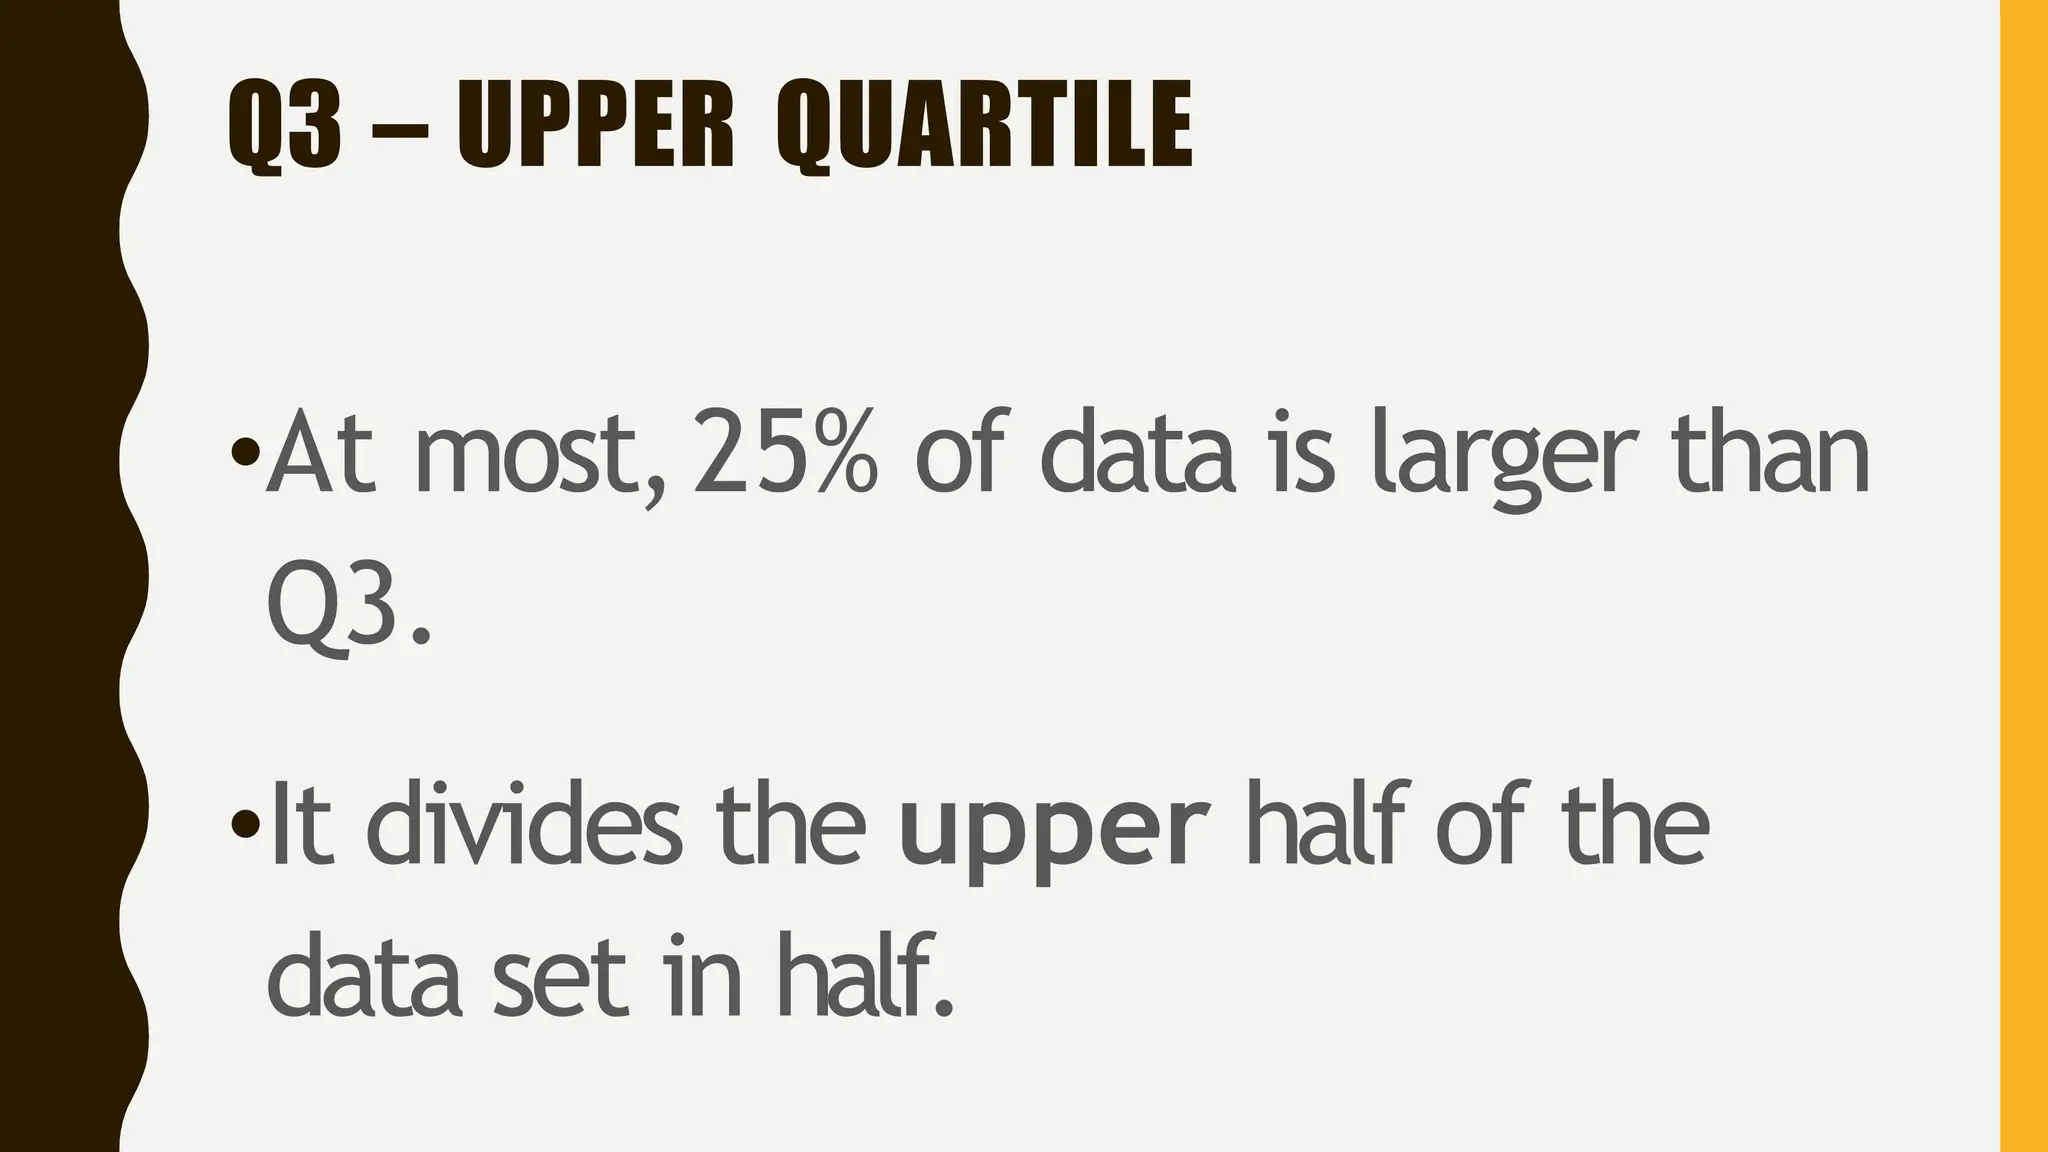
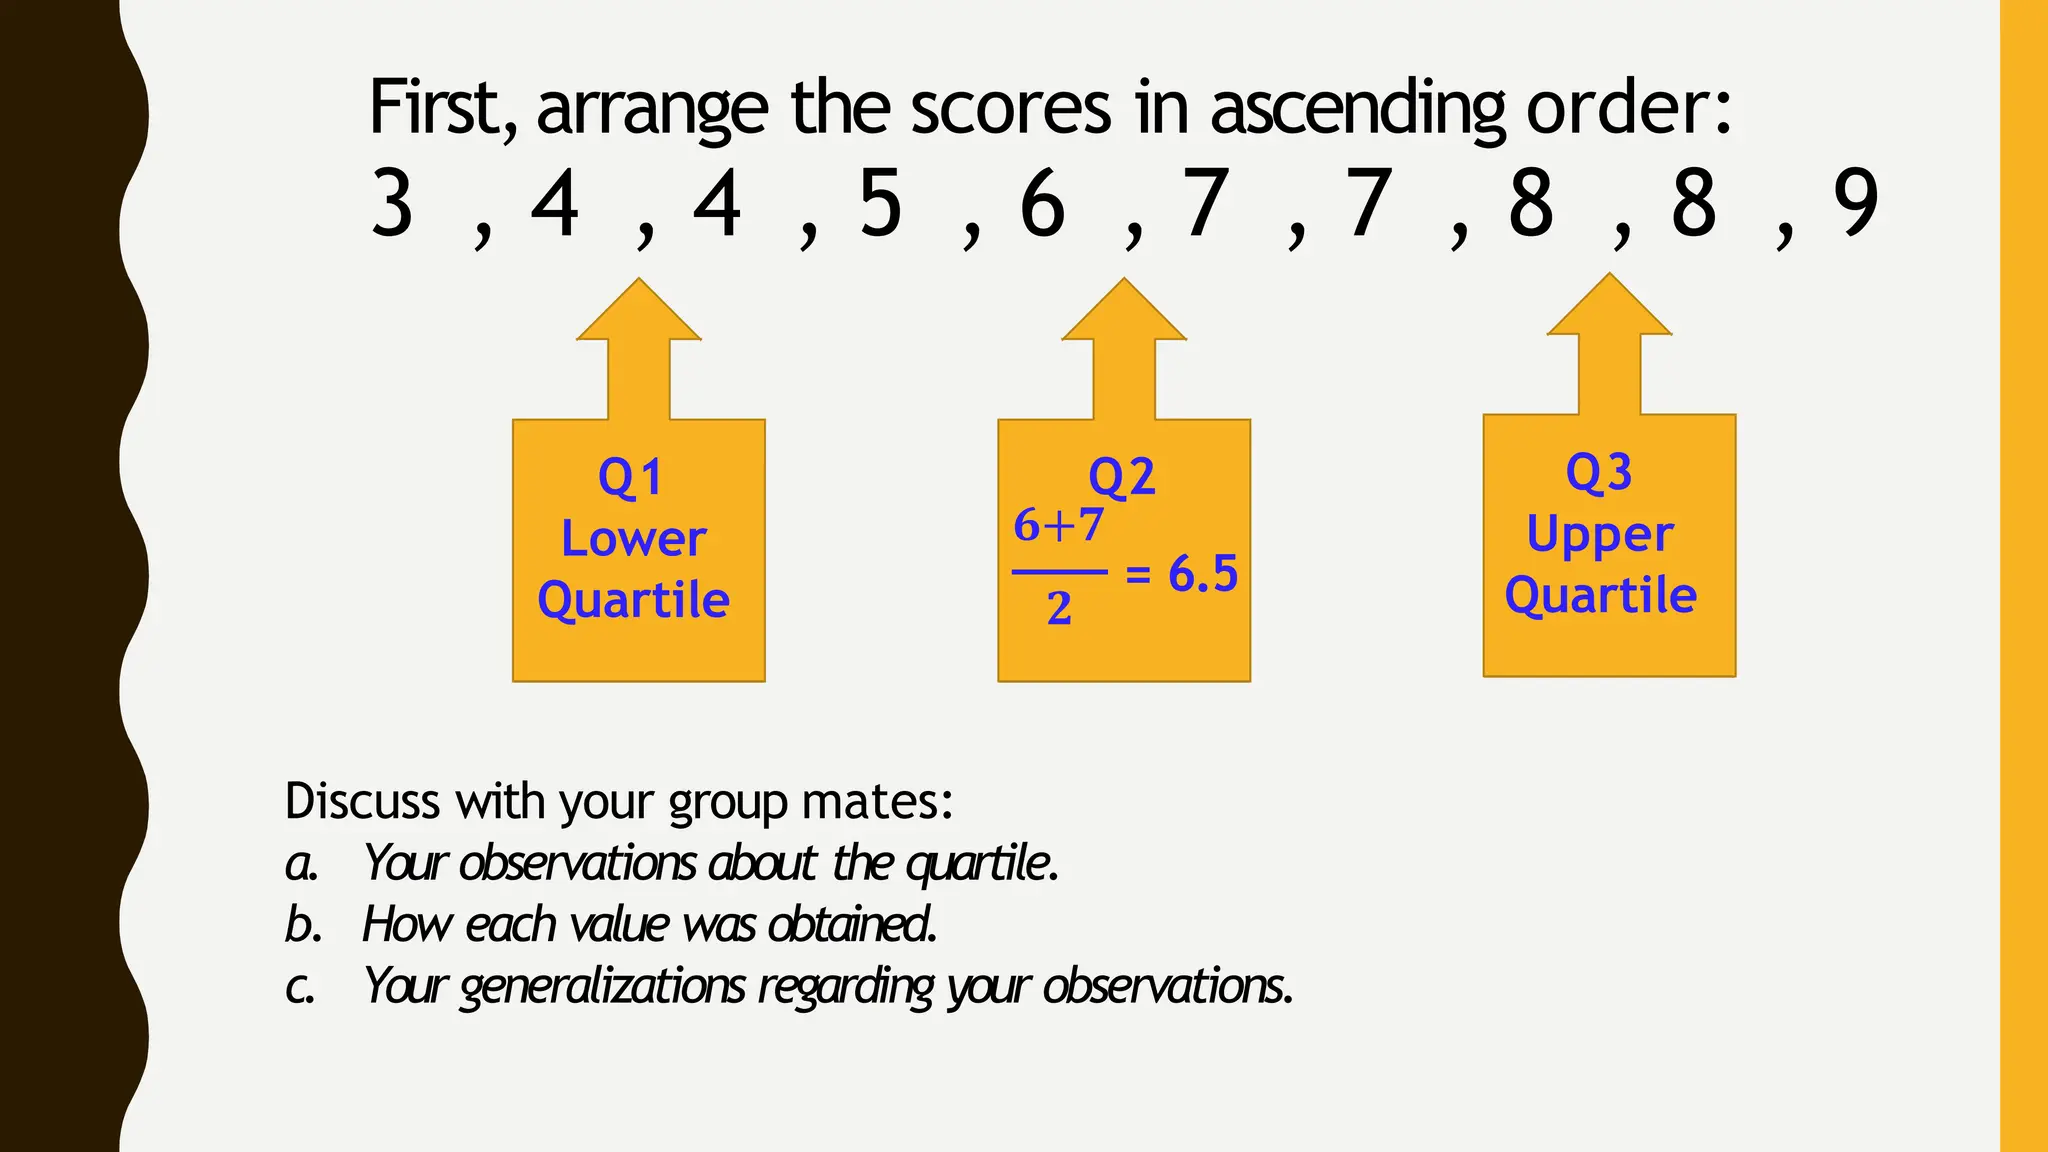
MEASURES OF
POSITION
F O U R T H Q U A R T E R - S T A T I S T I C S
OBJECTIVES
•Define measures of position
•Illustrate the following measures of
position:
–Quartiles
–Deciles
–Percentiles
NUMERICAL INFORMATION MAY BE
CLASSIFIED AS:
•Ungrouped data
•Grouped data
MEASURES OF POSITION/QUANTILES
- are techniques that divide a
set of data into equal groups
Fractiles are numbers that partition or
divide an ordered data set into equal parts.
MEASURES OF POSITION/QUANTILES
•Used to describe the position
of a data value in relation to
the rest of the data.
Types:
1. Quartiles
2. Percentiles
3. Deciles
QUANTILES CAN BE APPLIED WHEN:
•Dealing with large amount of data,which
includes the timely results for standardized
tests in schools,etc.
•Trying to discover the smallest as well as the
largest values in a given distribution.
•Examining financial fields for academic as well
as statistical studies.
MEASURES OF
POSITION FOR
UNGROUPED DATA
Q U A R T I L E , D E C I L E A N D P E R C E N T I L E
QUARTILE
U N G R O U P E D D A T A B Y I N S P E C T I O N
QUARTILE FOR UNGROUPED DATA
•The quartiles are the score points
which divide a distribution into
four equal parts.
Quartiles
Q1, Q2, Q3
Quartiles
Q1, Q2, Q3
divides ranked scores into four equal parts
Quartiles
Q1, Q2, Q3
divides ranked scores into four equal parts
Quartiles
25% 25% 25% 25%
Q1 Q2 Q3
Q1 – LOWER QUARTILE
At most,25% of data is smaller than
Q1.
It divides the lower half of a data
set in half.
Q2 – MIDDLE QUARTILE
•The median divides the data set in
half.
•50% of the data values fall below
the median and 50% fall above.
Q3 – UPPER QUARTILE
•At most,25% of data is larger than
Q3.
•It divides the upper half of the
data set in half.
Q1 Q2 Q3
25% 25% 25% 25%
EXAMPLE……
A group of students obtained the
following scores in their statistics
quiz:
8, 2, 5, 4, 8, 5, 7, 1, 3, 6, 9
(LM Activity 4,#2)
First,arrange the scores in ascending order:
1, 2, 3
3, 4, 5, 5
5, 6, 7, 8
8, 8, 9
Q1
Lower
Quartile
Q2
Middle
Quartile
Q3
Upper
Quartile
Observe how the lower quartile (Q1), middle quartile
(Q 2),and upper quartile (Q3) of the scores are
obtained.Complete the statements below:
The first quartile 3 is obtained by .
(observe the position of 3 from 1 to 5).
The second quartile 5 is obtained by .
(observe the position of 5 from 1 to 9).
The third quartile 8 is obtained by .
(observe the position of 8 from 6 to 9).
Middle Quartile
is also the
MEDIAN
EXAMPLE……
The scores of 10 students in a
Mathematics seatwork are:
7, 4, 8, 9, 3, 6, 7, 4, 5, 8
(LM Activity 4,#3)
First,arrange the scores in ascending order:
3 , 4 , 4 , 5 , 6 , 7 , 7 , 8 , 8 , 9
Q1
Lower
Quartile
Q2
𝟐
𝟔+𝟕
= 6.5
Q3
Upper
Quartile
Discuss with your group mates:
a. Your observations about the quartile.
b. How each value was obtained.
c. Your generalizations regarding your observations.
EXAMPLE……
1.The owner of a coffee shop recorded the
number of customers who came into his
café each hour in a day.The results were 14,
10,12,9 17,5,8,9 10 ,and 11.Find the
lower quartiles and upper quartile of the
data.
2.Find Q1, Q 2,and Q3.
12 ,9 ,24 ,3 ,13 ,20 ,17 ,11
QUARTILE
U N G R O U P E D D A T A B Y M E N D E N H A L L
A N D S I N C I C H M E T H O D

measures-of-position-for-ungrouped-data_MAth 10_Part1.pptx

  • 1.
    MEASURES OF POSITION F OU R T H Q U A R T E R - S T A T I S T I C S
  • 2.
    OBJECTIVES •Define measures ofposition •Illustrate the following measures of position: –Quartiles –Deciles –Percentiles
  • 3.
    NUMERICAL INFORMATION MAYBE CLASSIFIED AS: •Ungrouped data •Grouped data
  • 5.
    MEASURES OF POSITION/QUANTILES -are techniques that divide a set of data into equal groups Fractiles are numbers that partition or divide an ordered data set into equal parts.
  • 6.
    MEASURES OF POSITION/QUANTILES •Usedto describe the position of a data value in relation to the rest of the data. Types: 1. Quartiles 2. Percentiles 3. Deciles
  • 7.
    QUANTILES CAN BEAPPLIED WHEN: •Dealing with large amount of data,which includes the timely results for standardized tests in schools,etc. •Trying to discover the smallest as well as the largest values in a given distribution. •Examining financial fields for academic as well as statistical studies.
  • 8.
    MEASURES OF POSITION FOR UNGROUPEDDATA Q U A R T I L E , D E C I L E A N D P E R C E N T I L E
  • 9.
    QUARTILE U N GR O U P E D D A T A B Y I N S P E C T I O N
  • 10.
    QUARTILE FOR UNGROUPEDDATA •The quartiles are the score points which divide a distribution into four equal parts.
  • 11.
  • 12.
  • 13.
    Q1, Q2, Q3 dividesranked scores into four equal parts Quartiles
  • 14.
    Q1, Q2, Q3 dividesranked scores into four equal parts Quartiles 25% 25% 25% 25% Q1 Q2 Q3
  • 15.
    Q1 – LOWERQUARTILE At most,25% of data is smaller than Q1. It divides the lower half of a data set in half.
  • 16.
    Q2 – MIDDLEQUARTILE •The median divides the data set in half. •50% of the data values fall below the median and 50% fall above.
  • 17.
    Q3 – UPPERQUARTILE •At most,25% of data is larger than Q3. •It divides the upper half of the data set in half.
  • 18.
    Q1 Q2 Q3 25%25% 25% 25%
  • 19.
    EXAMPLE…… A group ofstudents obtained the following scores in their statistics quiz: 8, 2, 5, 4, 8, 5, 7, 1, 3, 6, 9 (LM Activity 4,#2)
  • 20.
    First,arrange the scoresin ascending order: 1, 2, 3 3, 4, 5, 5 5, 6, 7, 8 8, 8, 9 Q1 Lower Quartile Q2 Middle Quartile Q3 Upper Quartile Observe how the lower quartile (Q1), middle quartile (Q 2),and upper quartile (Q3) of the scores are obtained.Complete the statements below: The first quartile 3 is obtained by . (observe the position of 3 from 1 to 5). The second quartile 5 is obtained by . (observe the position of 5 from 1 to 9). The third quartile 8 is obtained by . (observe the position of 8 from 6 to 9). Middle Quartile is also the MEDIAN
  • 21.
    EXAMPLE…… The scores of10 students in a Mathematics seatwork are: 7, 4, 8, 9, 3, 6, 7, 4, 5, 8 (LM Activity 4,#3)
  • 22.
    First,arrange the scoresin ascending order: 3 , 4 , 4 , 5 , 6 , 7 , 7 , 8 , 8 , 9 Q1 Lower Quartile Q2 𝟐 𝟔+𝟕 = 6.5 Q3 Upper Quartile Discuss with your group mates: a. Your observations about the quartile. b. How each value was obtained. c. Your generalizations regarding your observations.
  • 23.
    EXAMPLE…… 1.The owner ofa coffee shop recorded the number of customers who came into his café each hour in a day.The results were 14, 10,12,9 17,5,8,9 10 ,and 11.Find the lower quartiles and upper quartile of the data. 2.Find Q1, Q 2,and Q3. 12 ,9 ,24 ,3 ,13 ,20 ,17 ,11
  • 24.
    QUARTILE U N GR O U P E D D A T A B Y M E N D E N H A L L A N D S I N C I C H M E T H O D