Downloaded 455 times
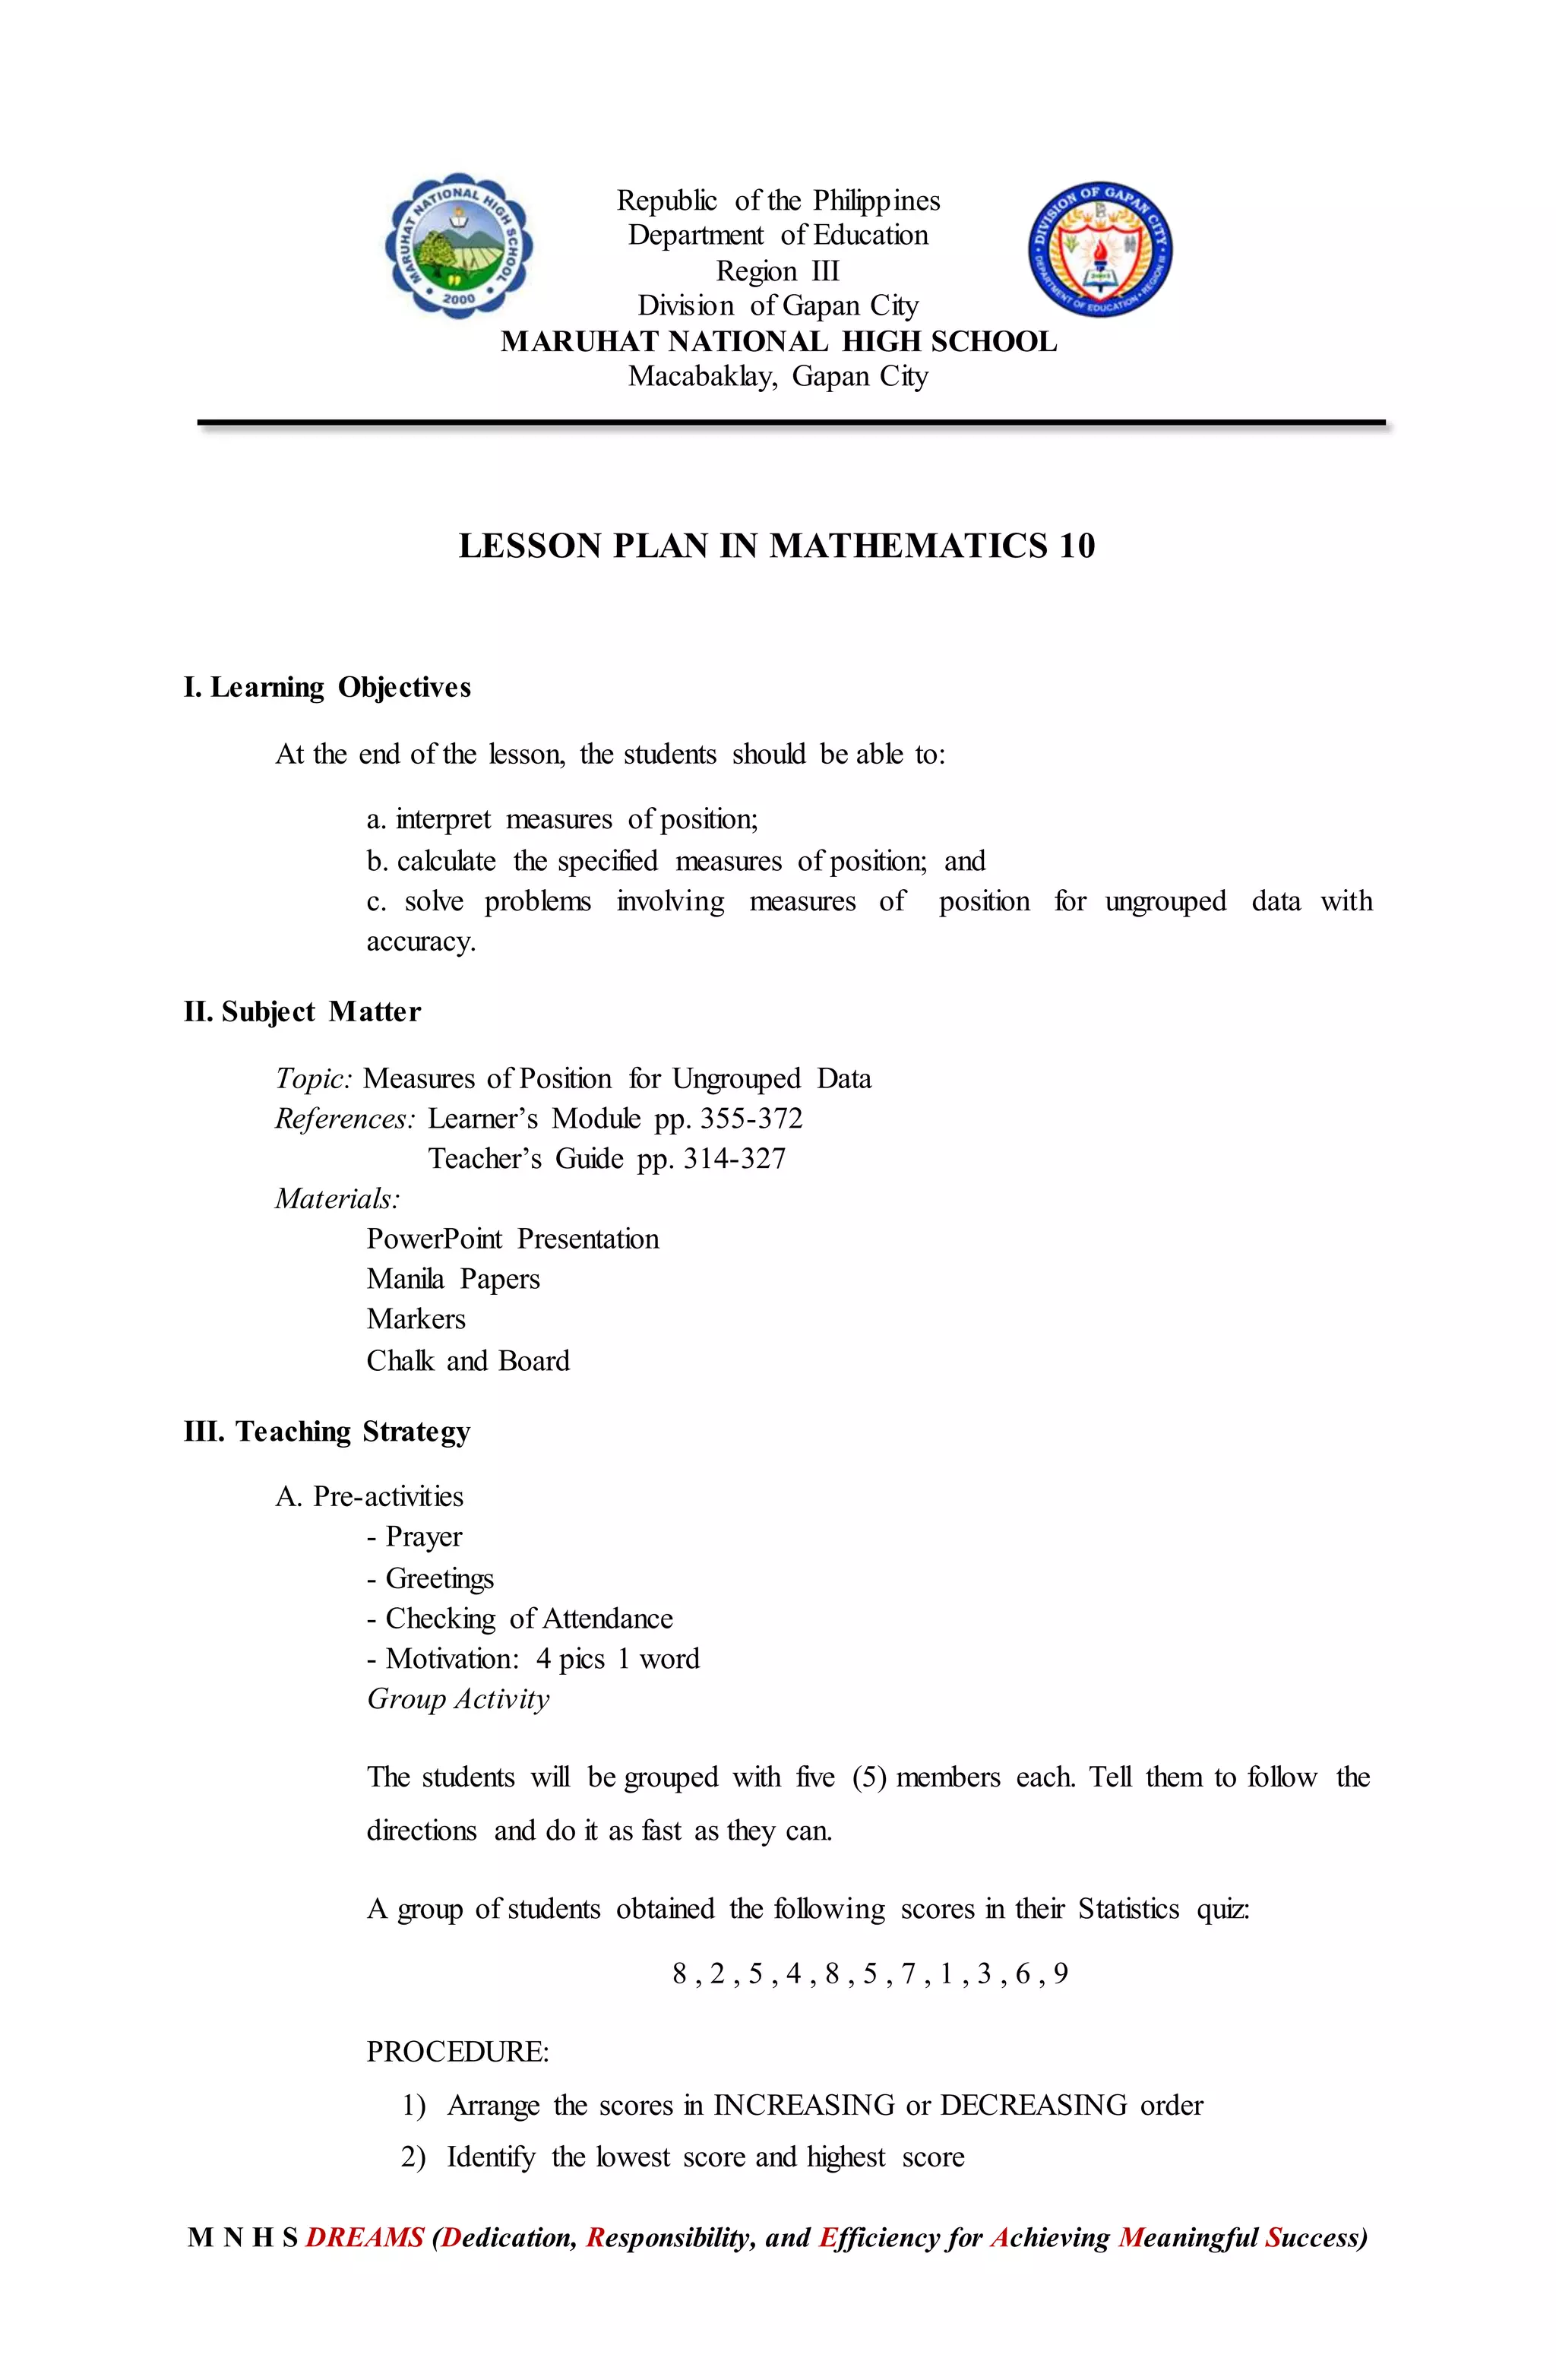
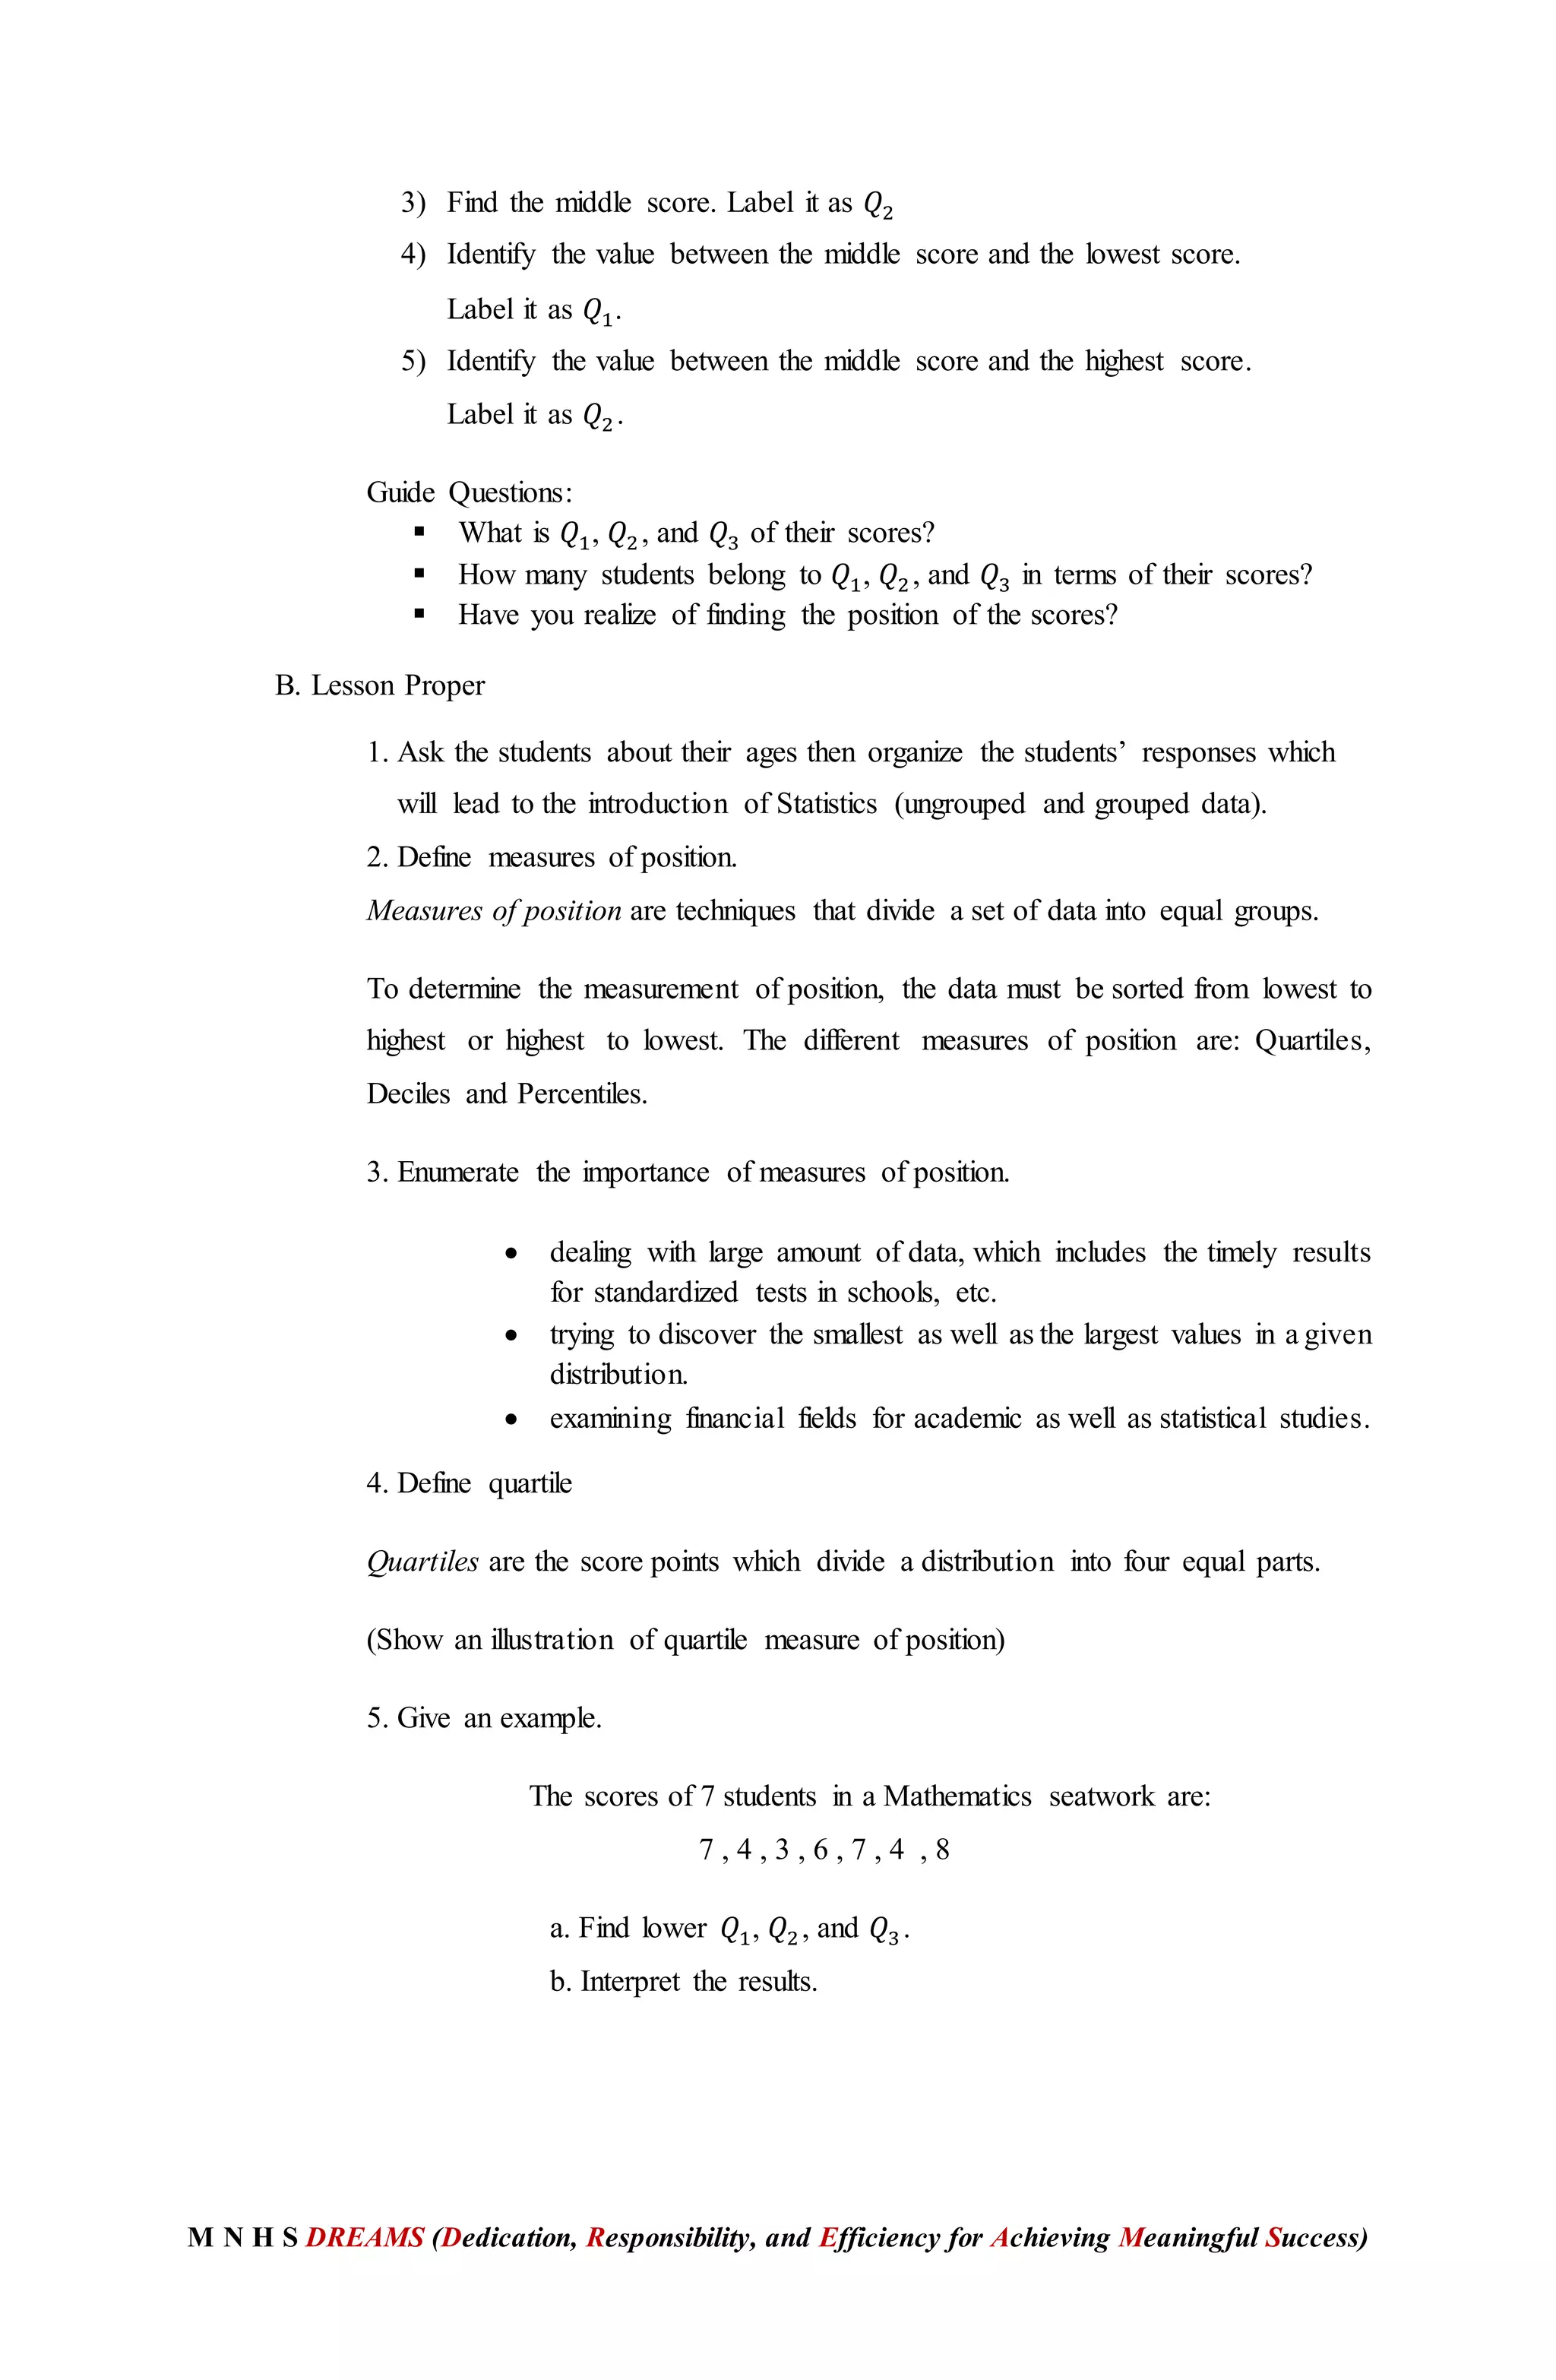
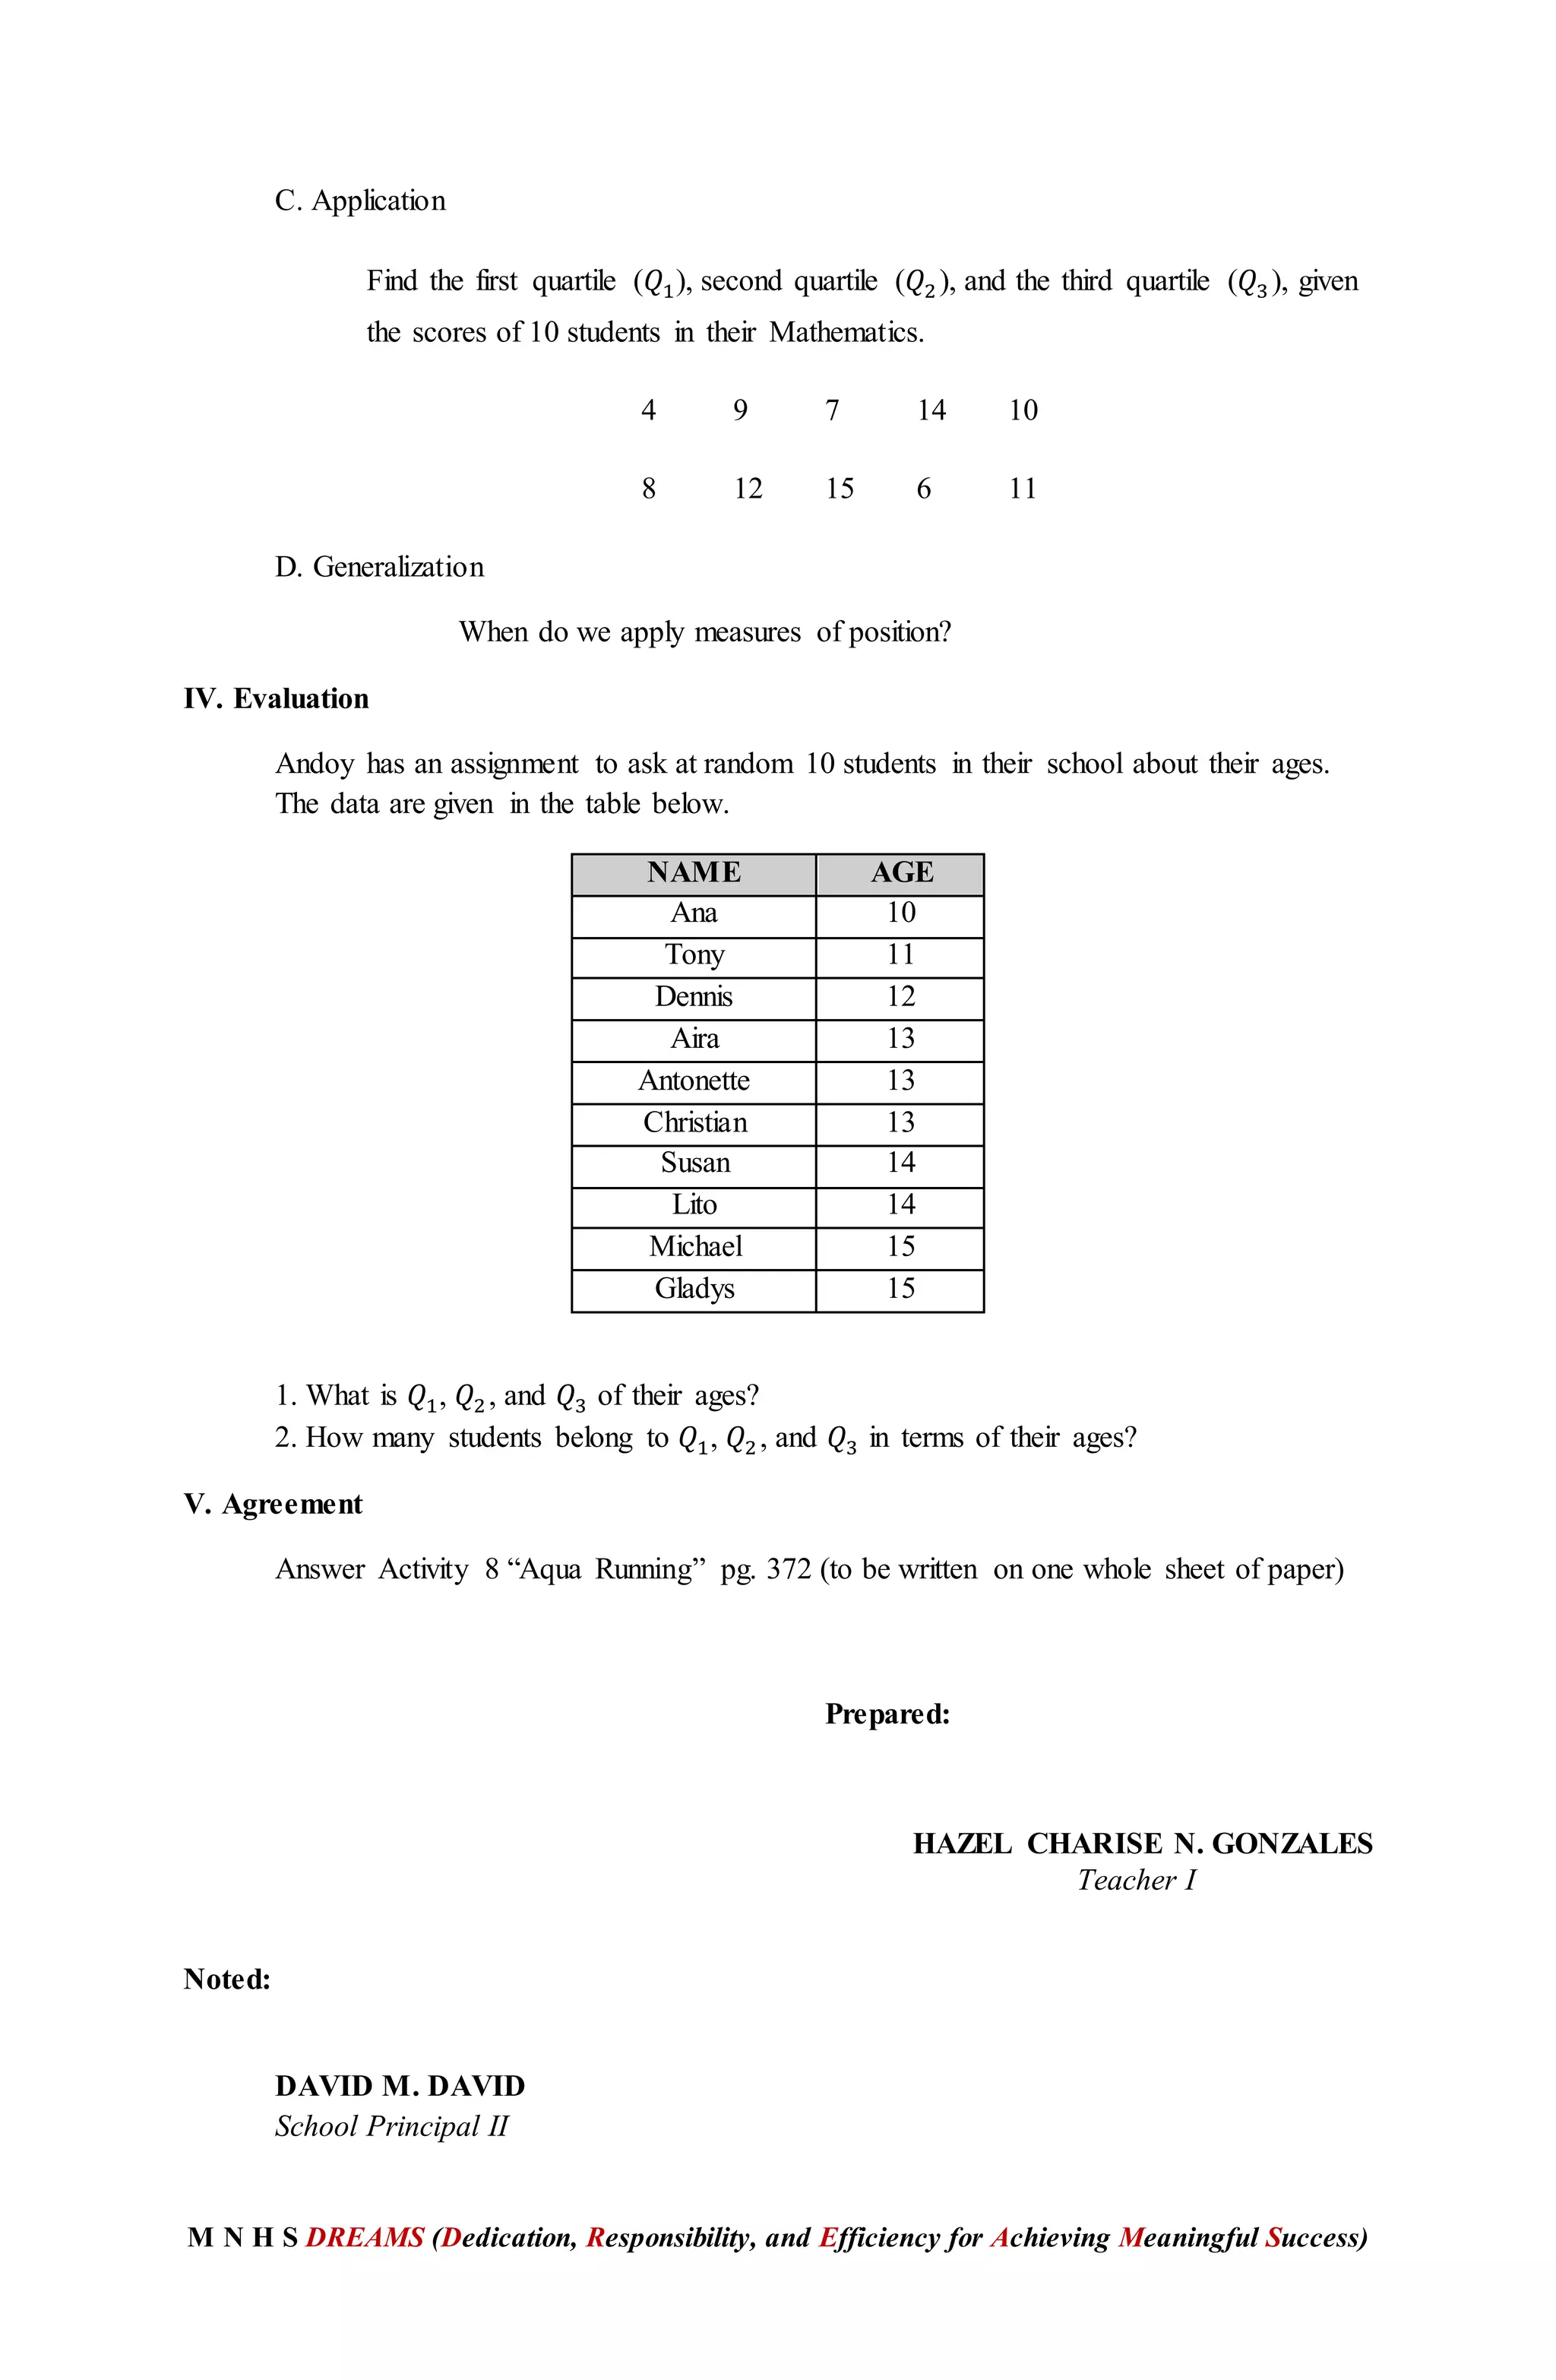

This lesson plan teaches measures of position for ungrouped data. It begins with an activity where students arrange exam scores in order and identify the quartiles. The lesson then defines measures of position like quartiles and deciles, and explains how to find and interpret them using an example of students' math scores. Students practice finding the quartiles of another data set. Finally, an evaluation activity asks students to find and interpret the quartiles of classmates' ages from a table of data.