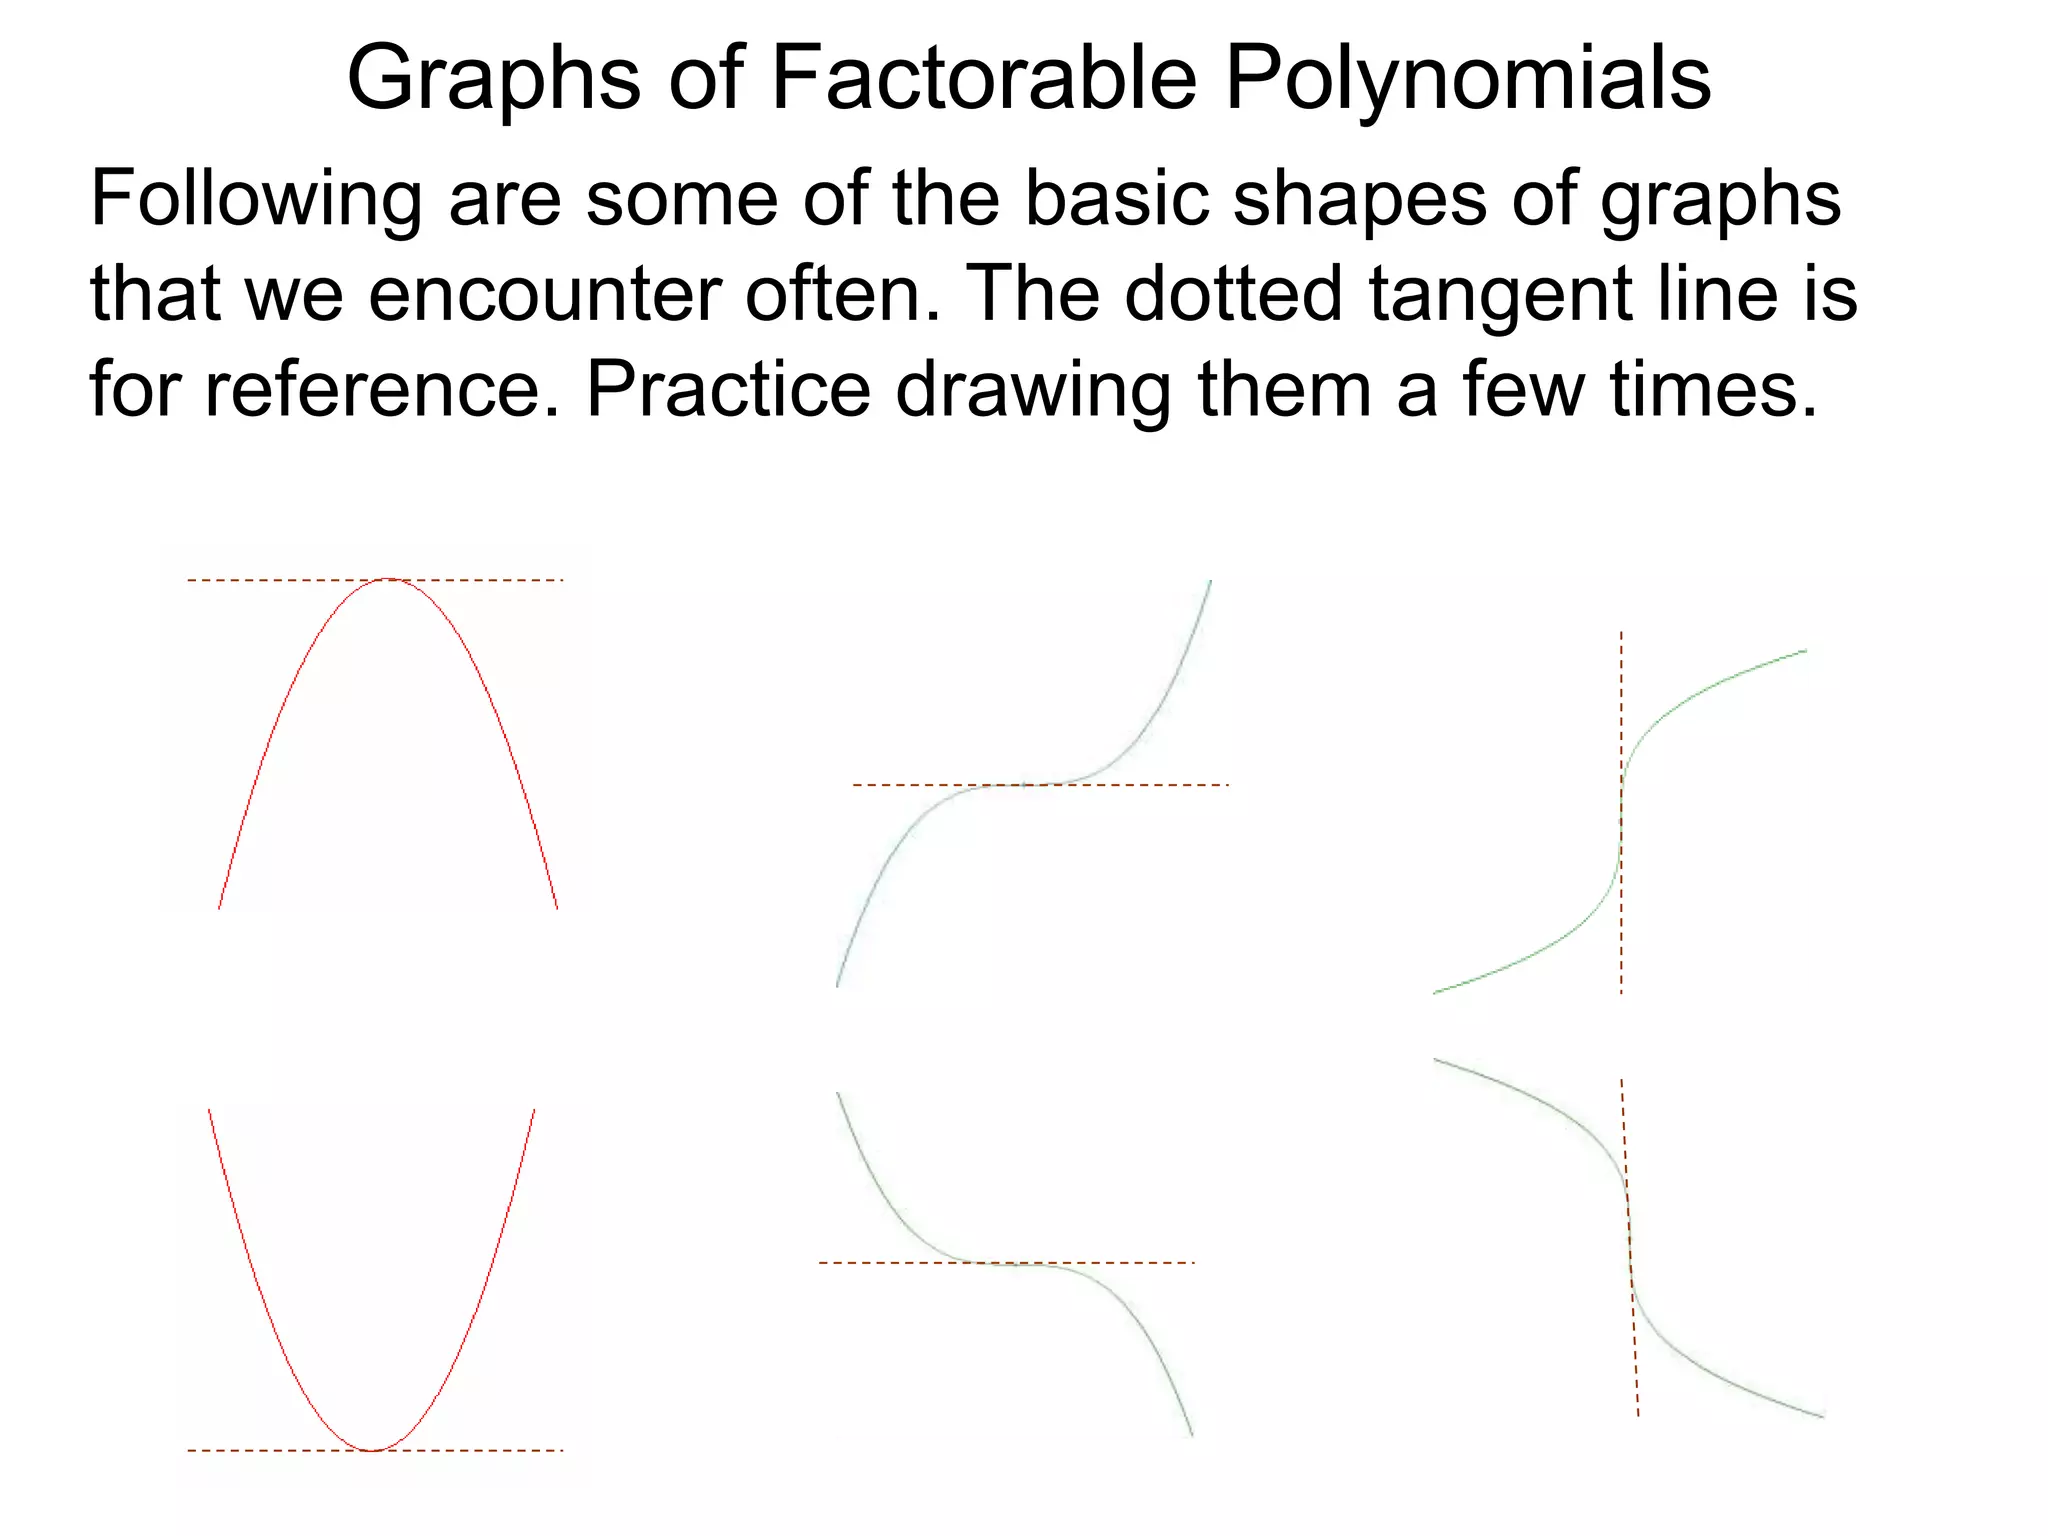
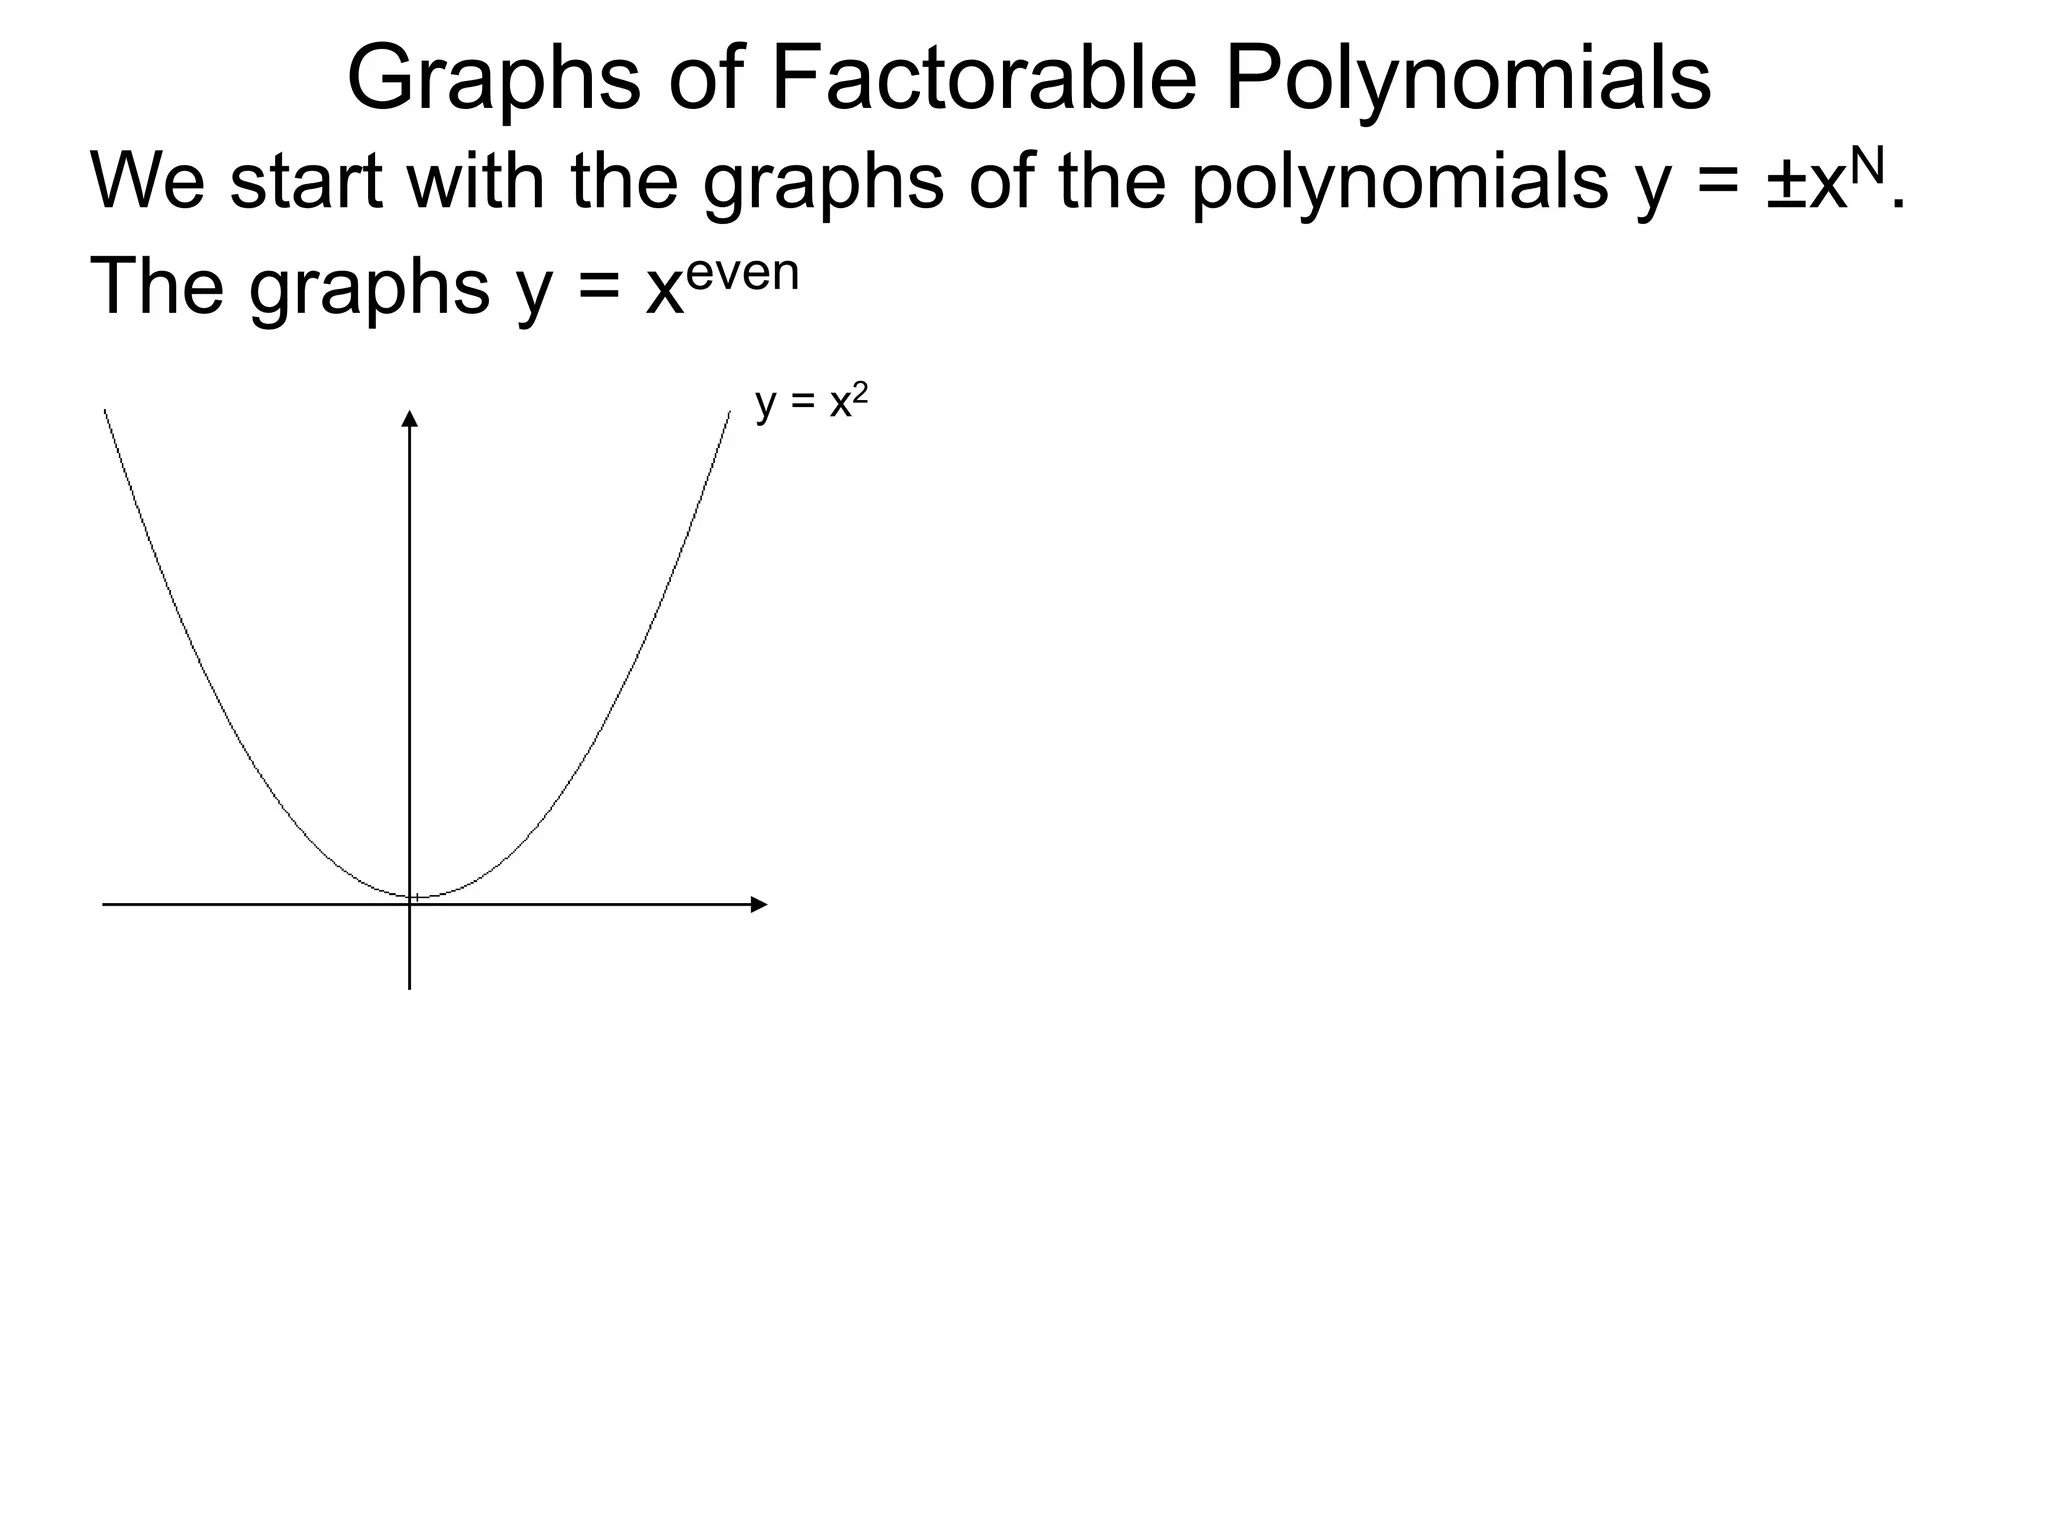
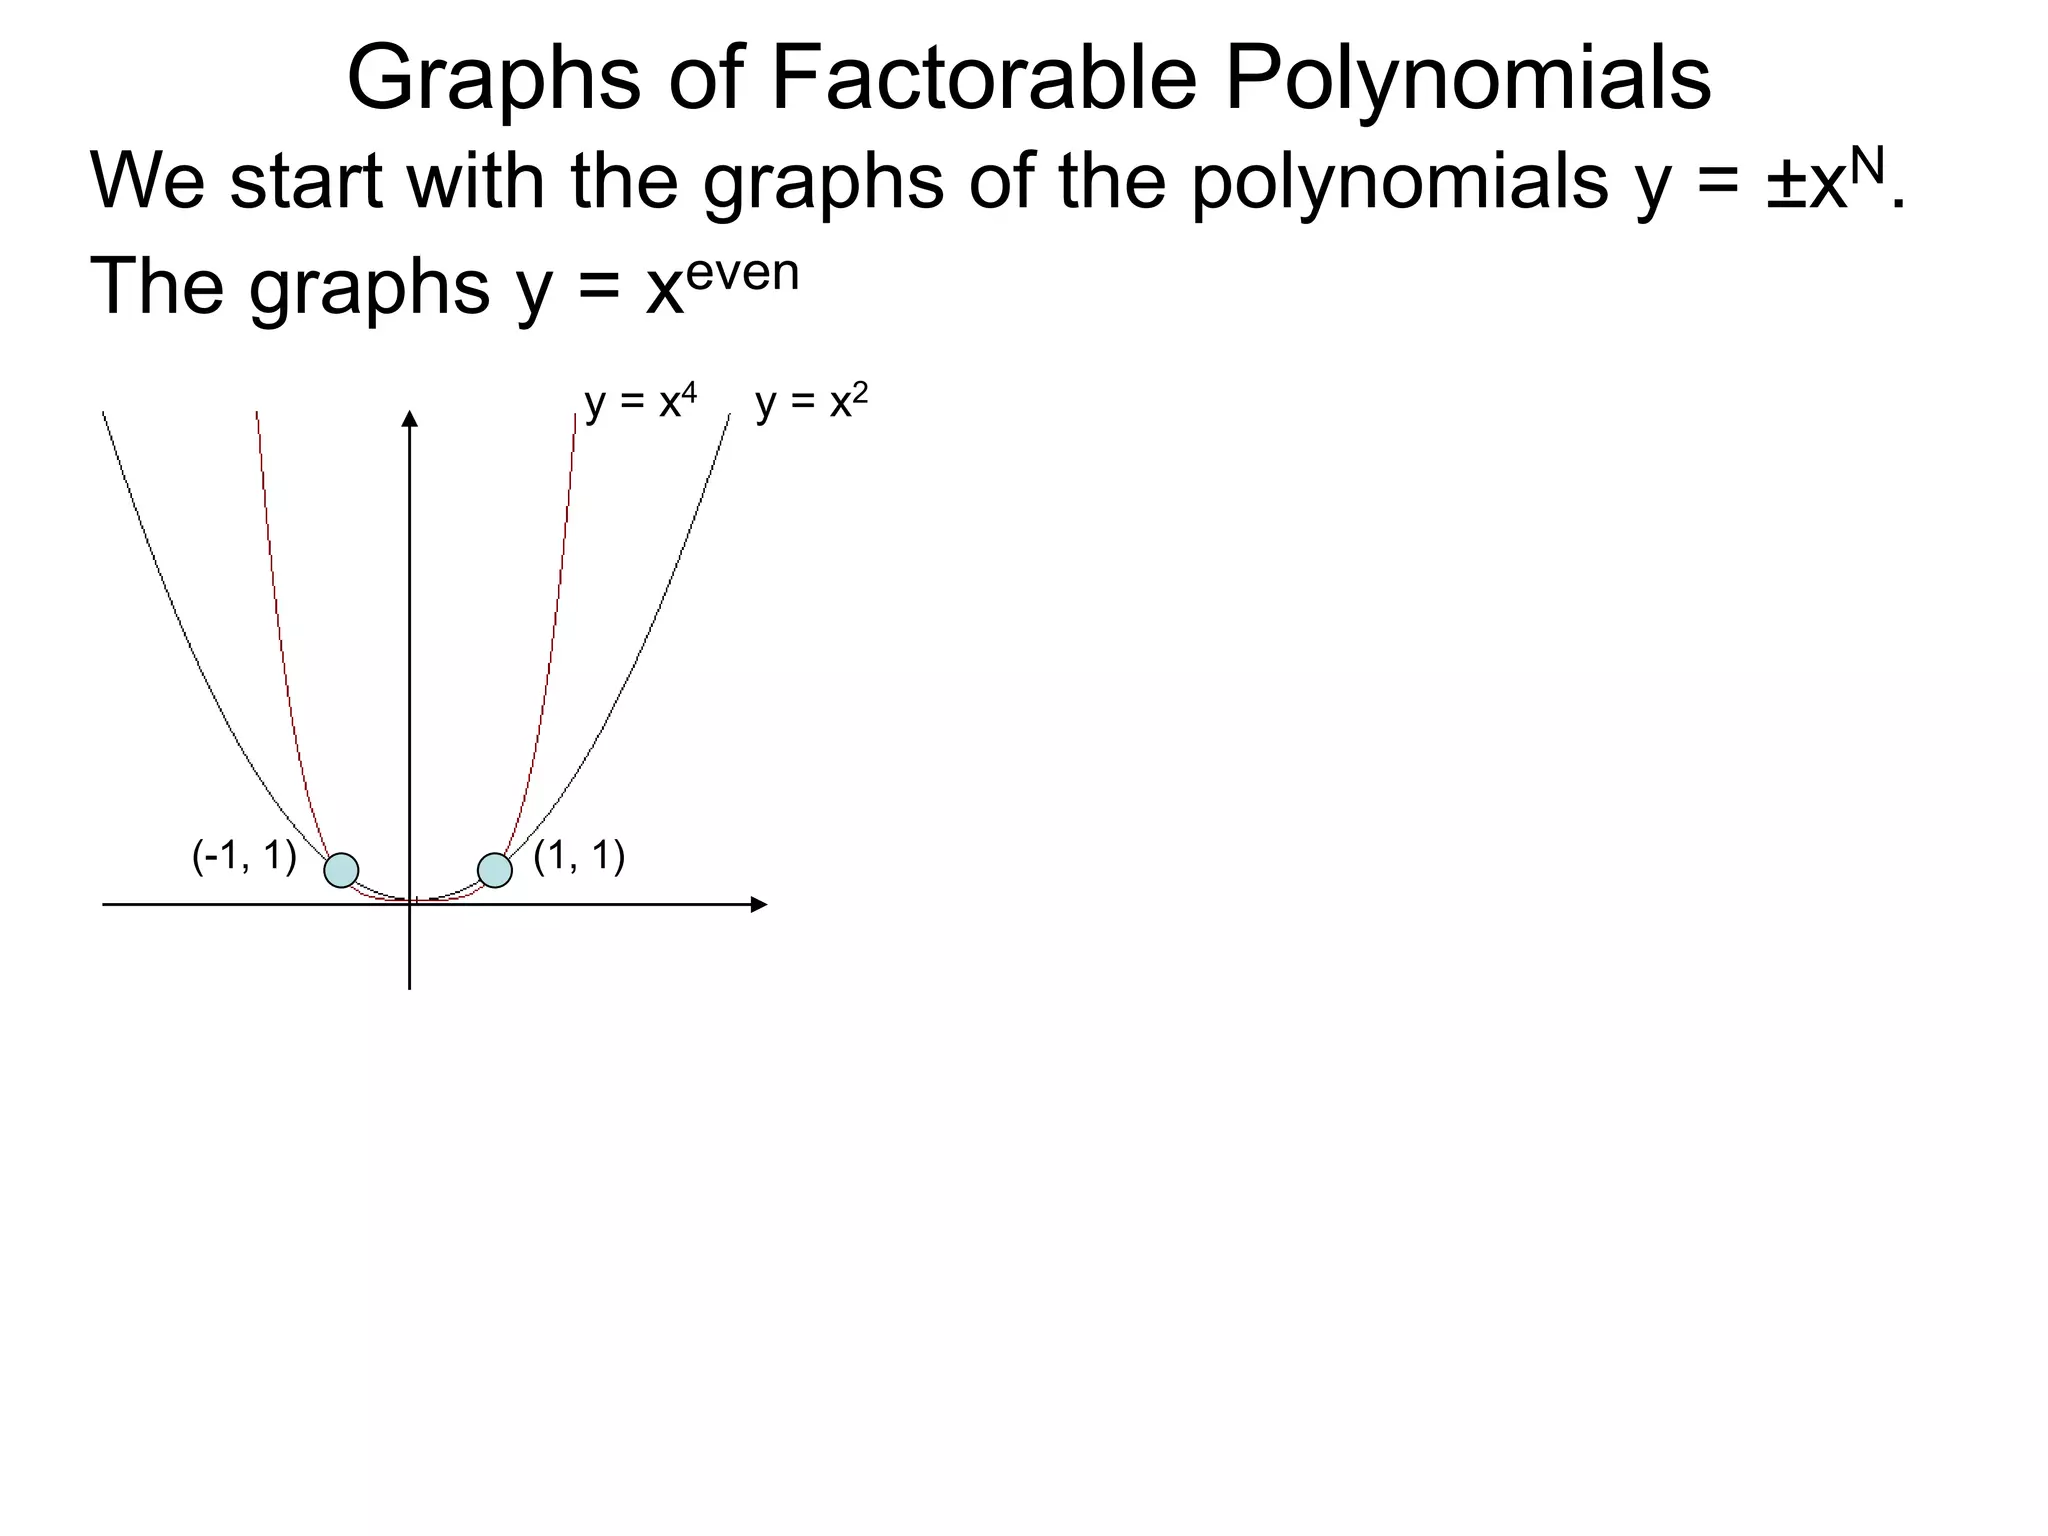
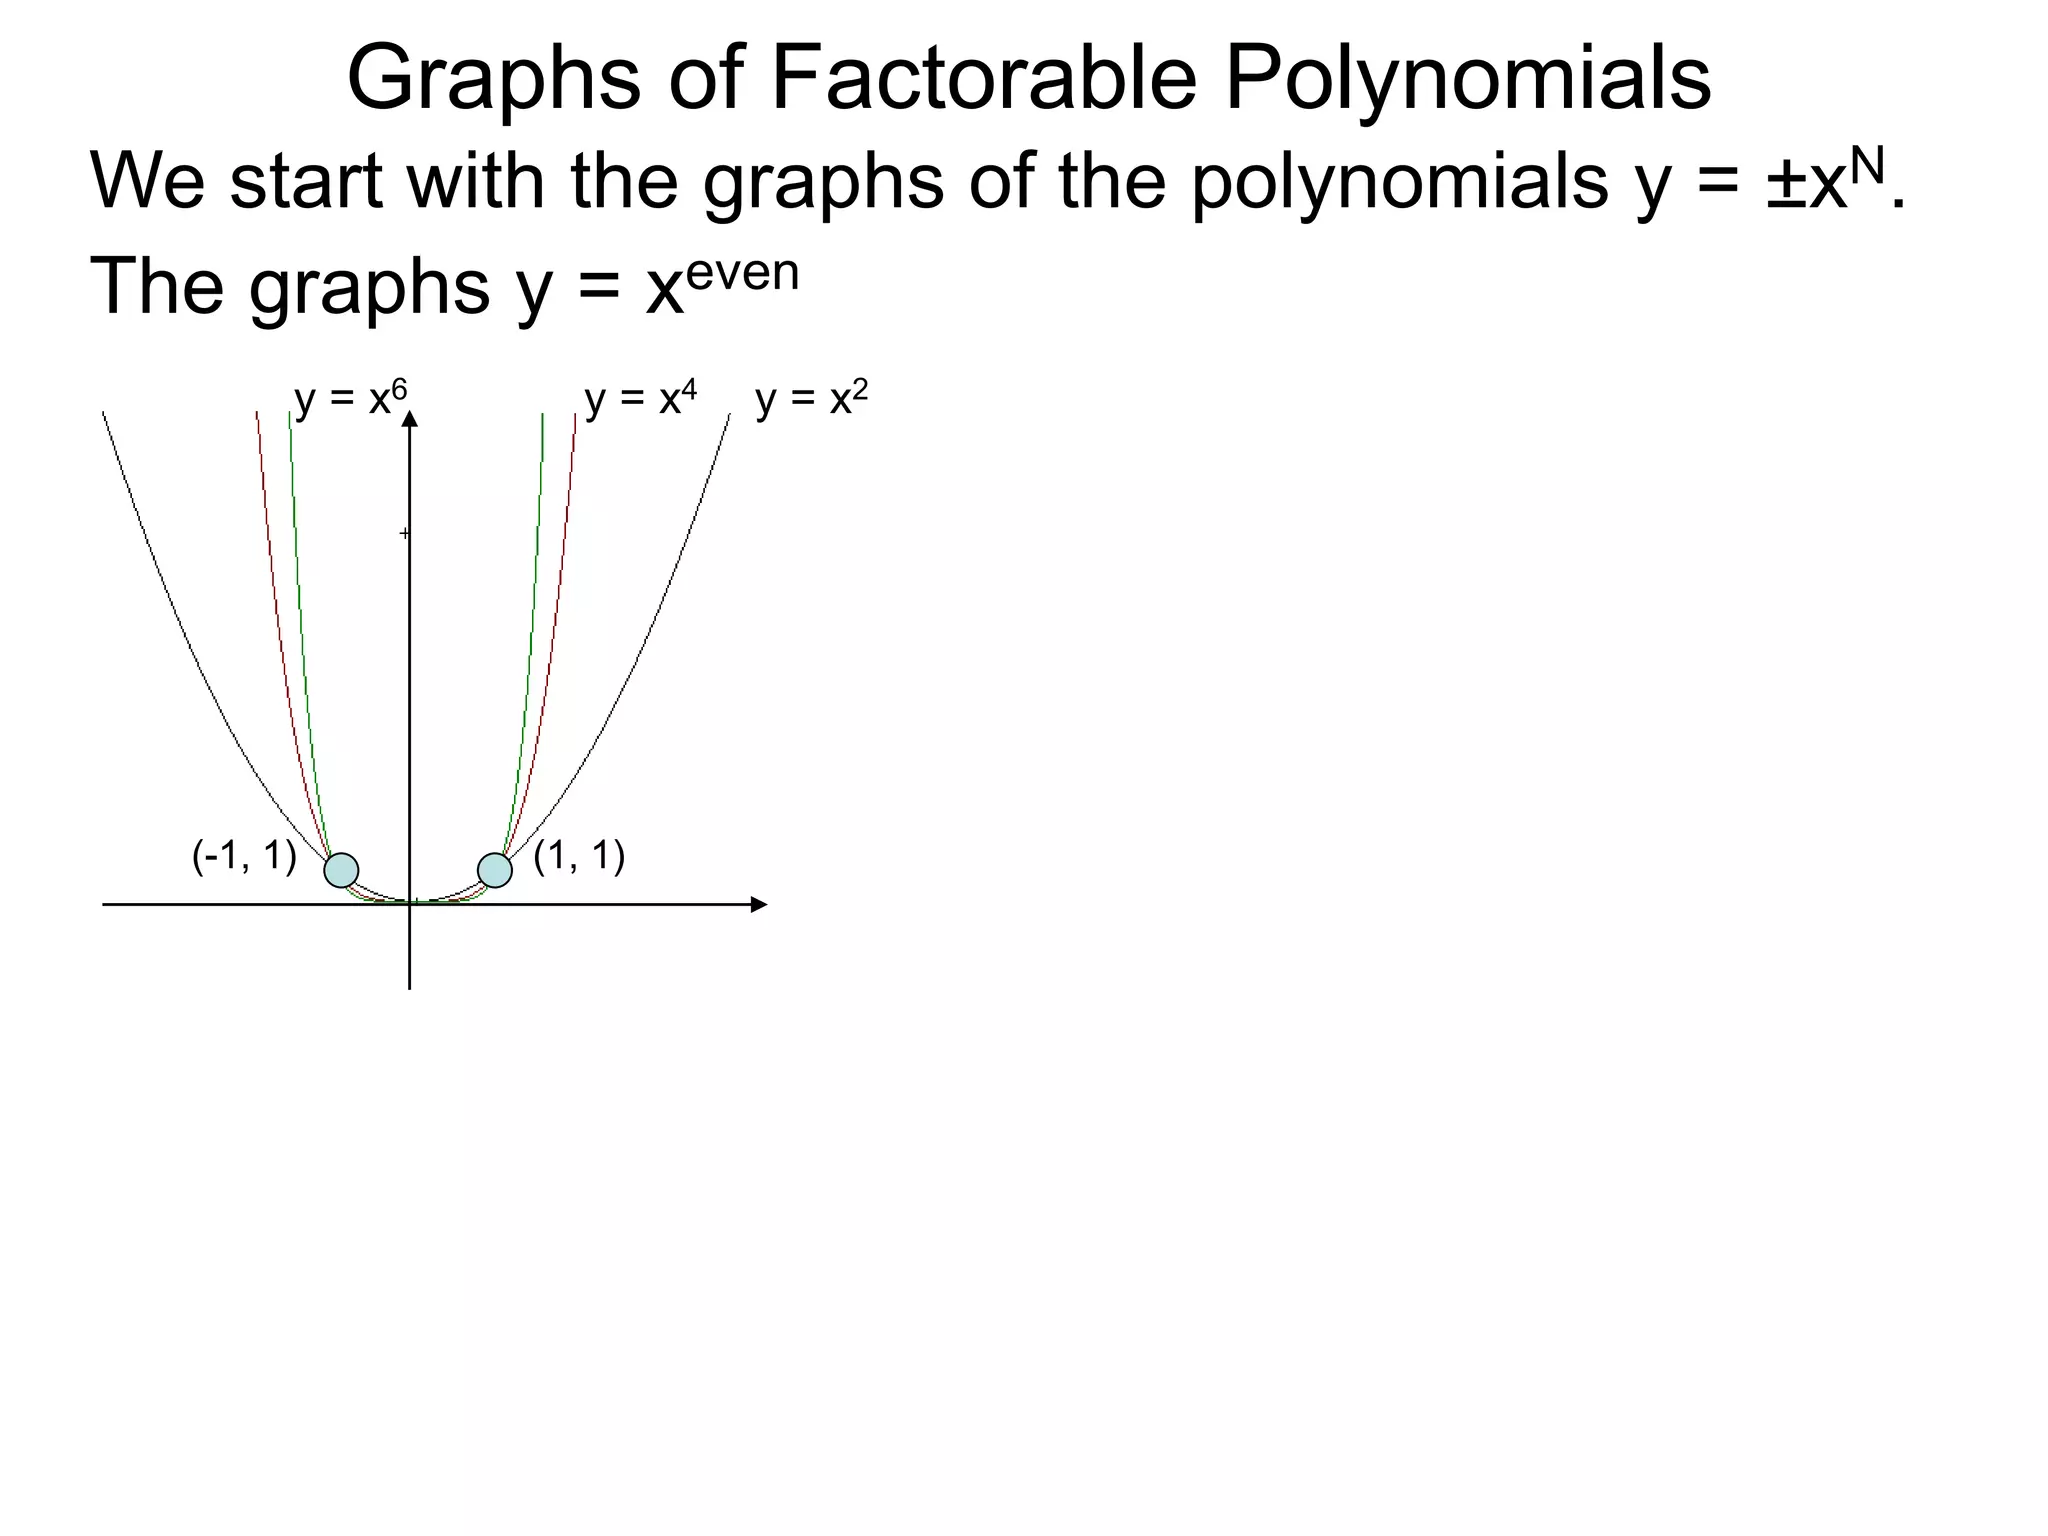
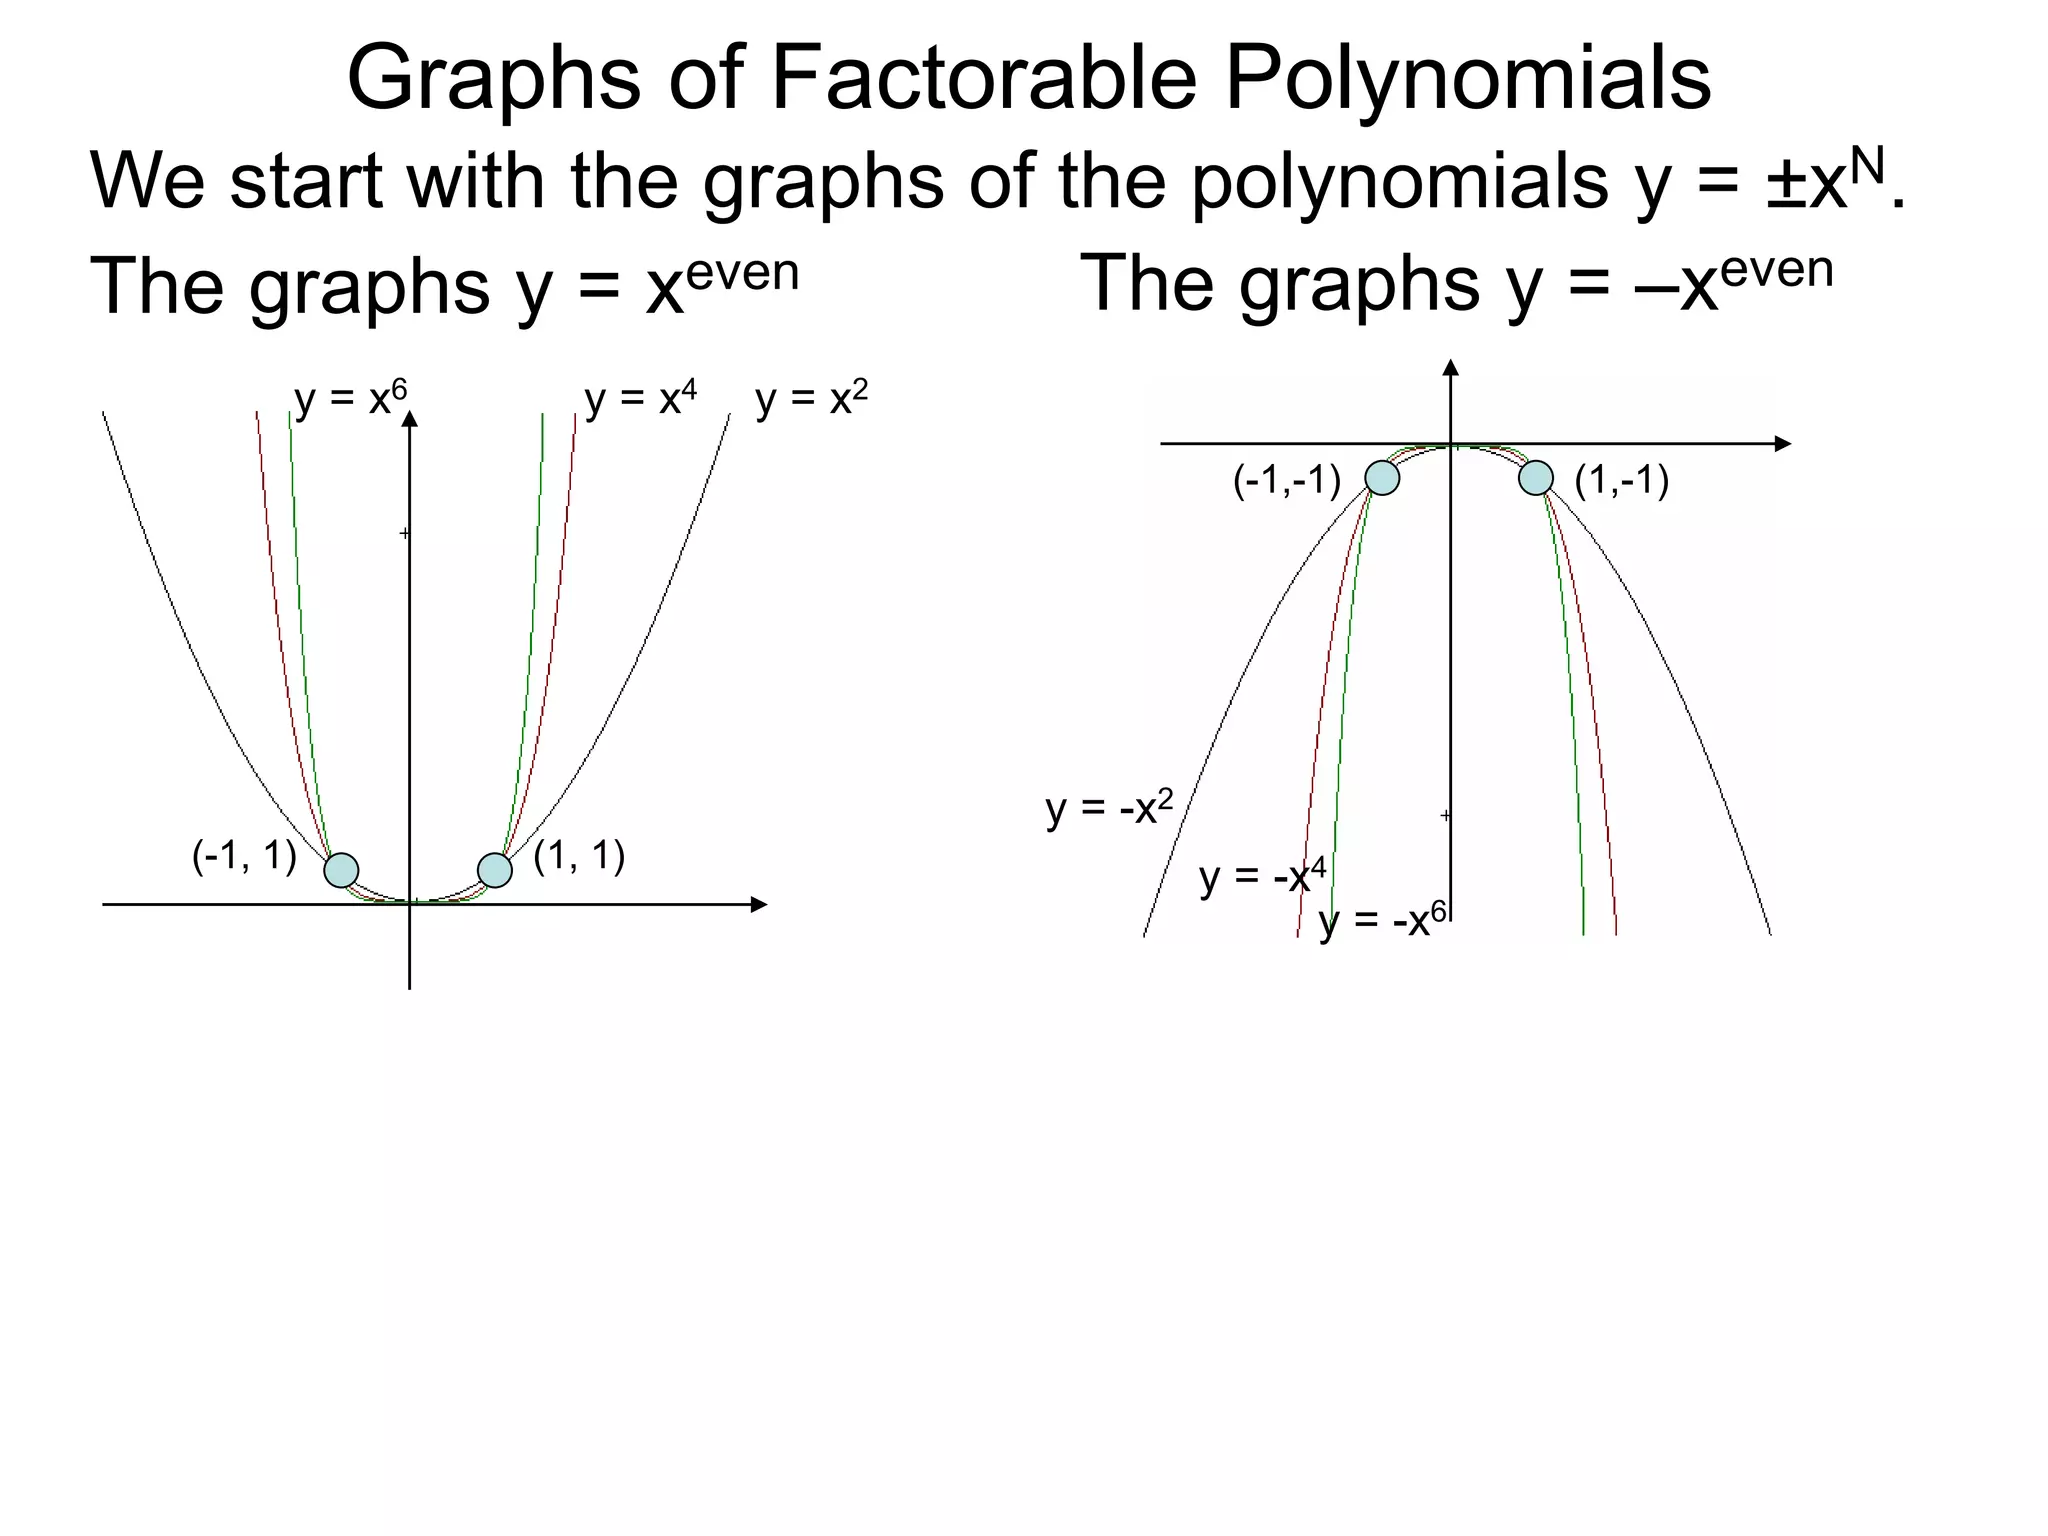
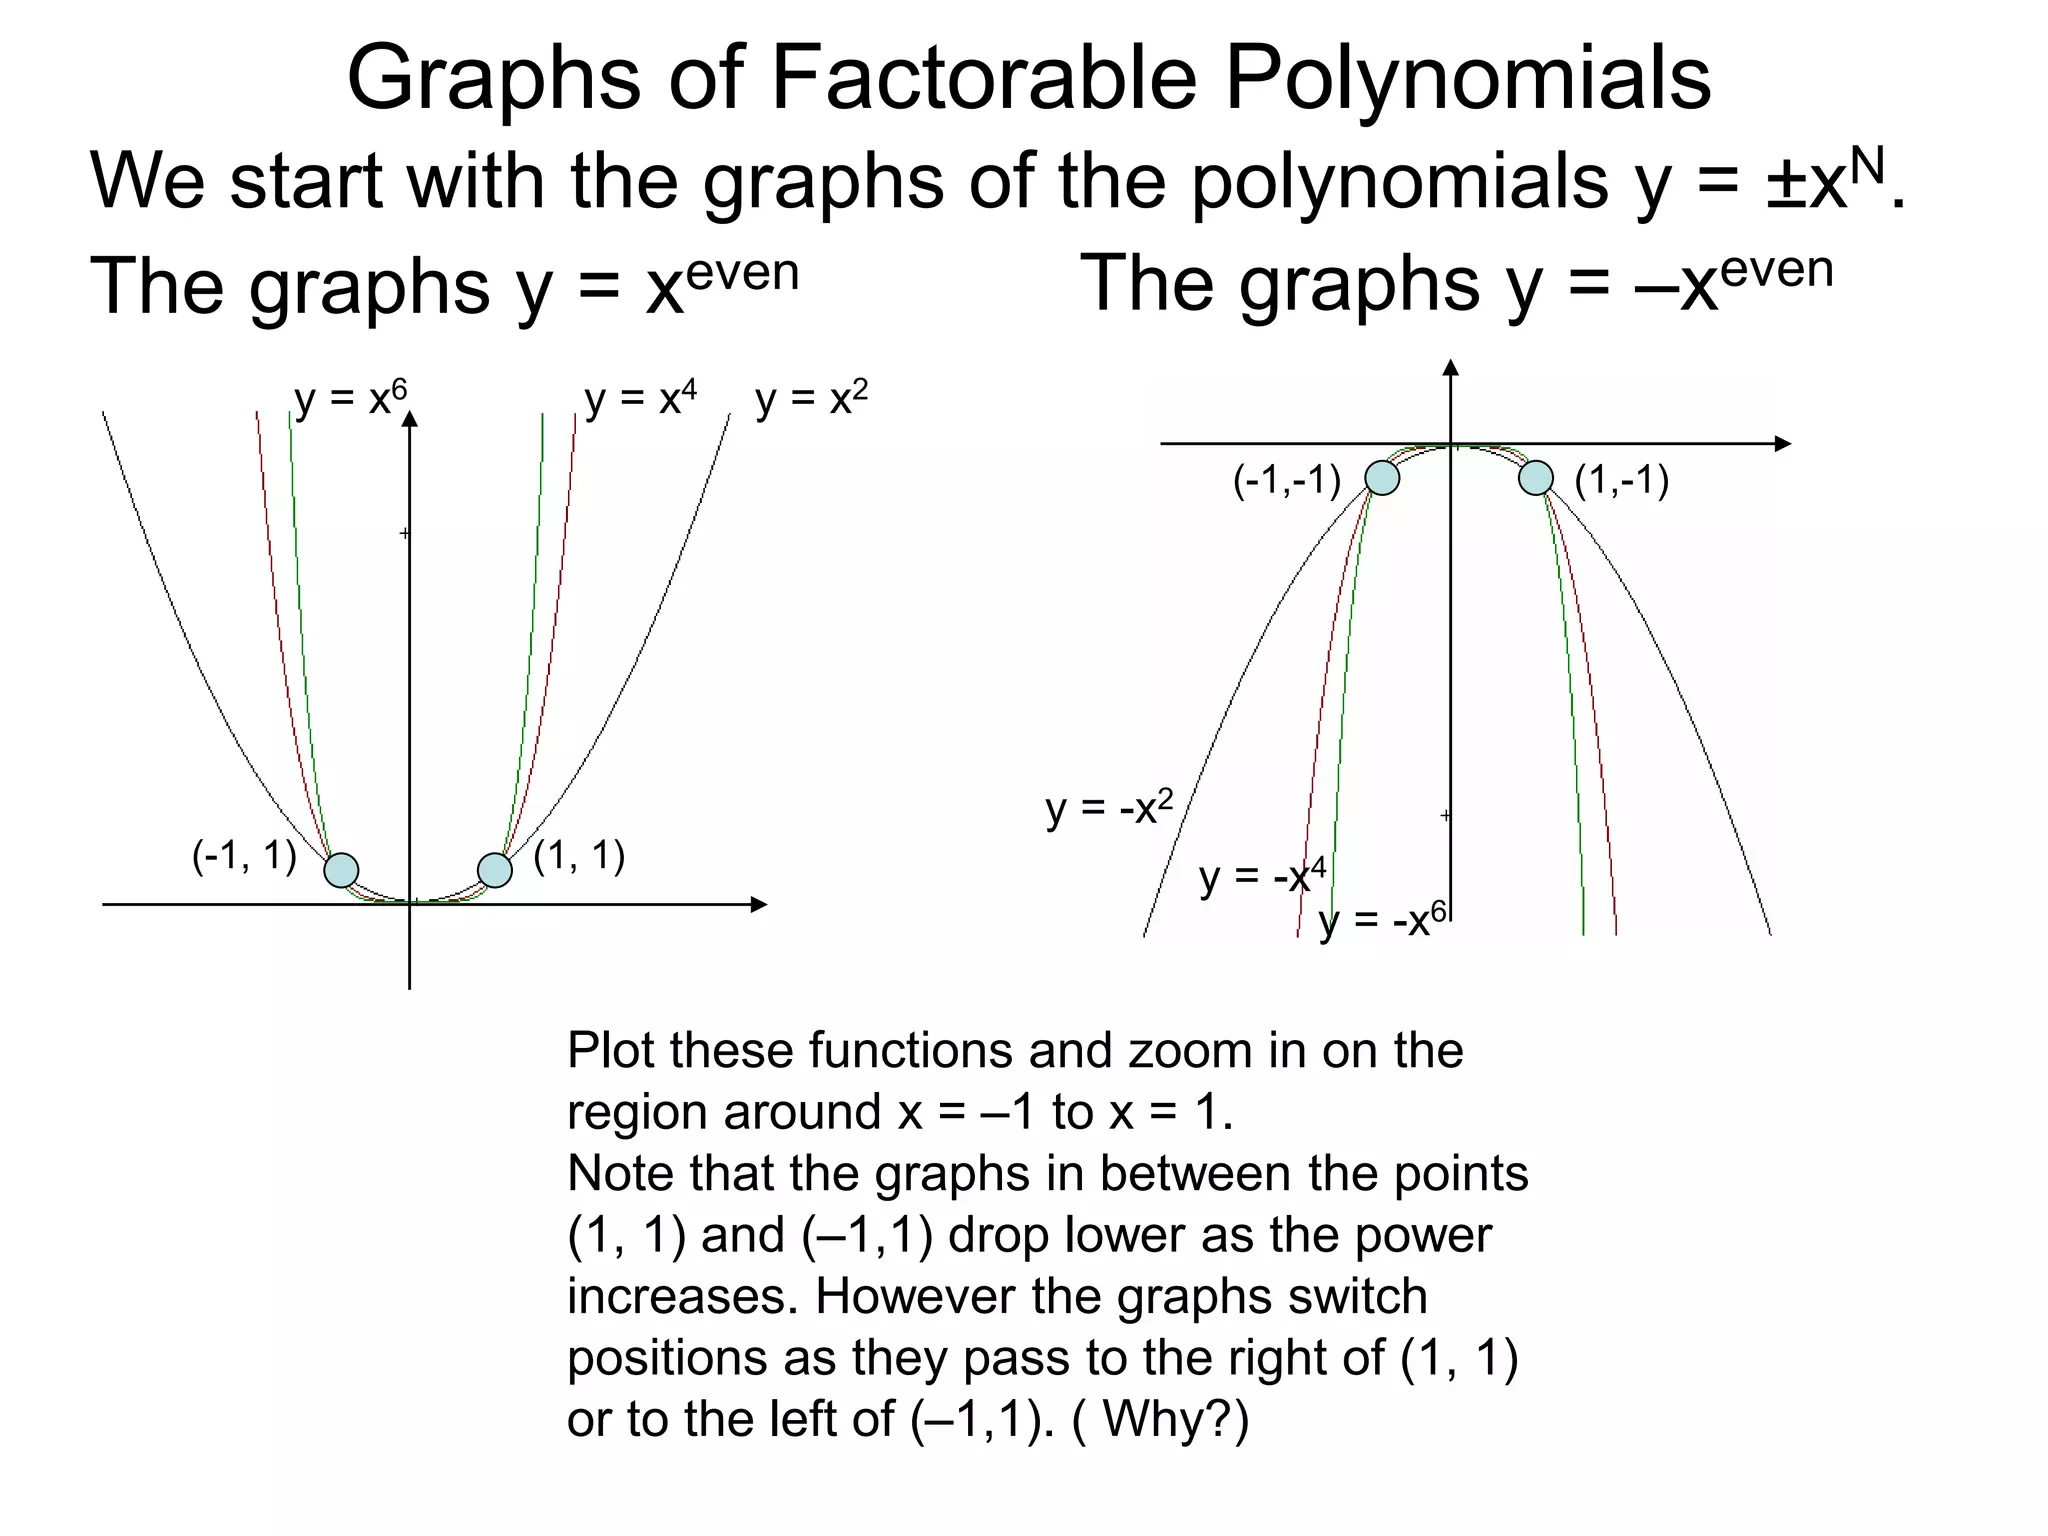
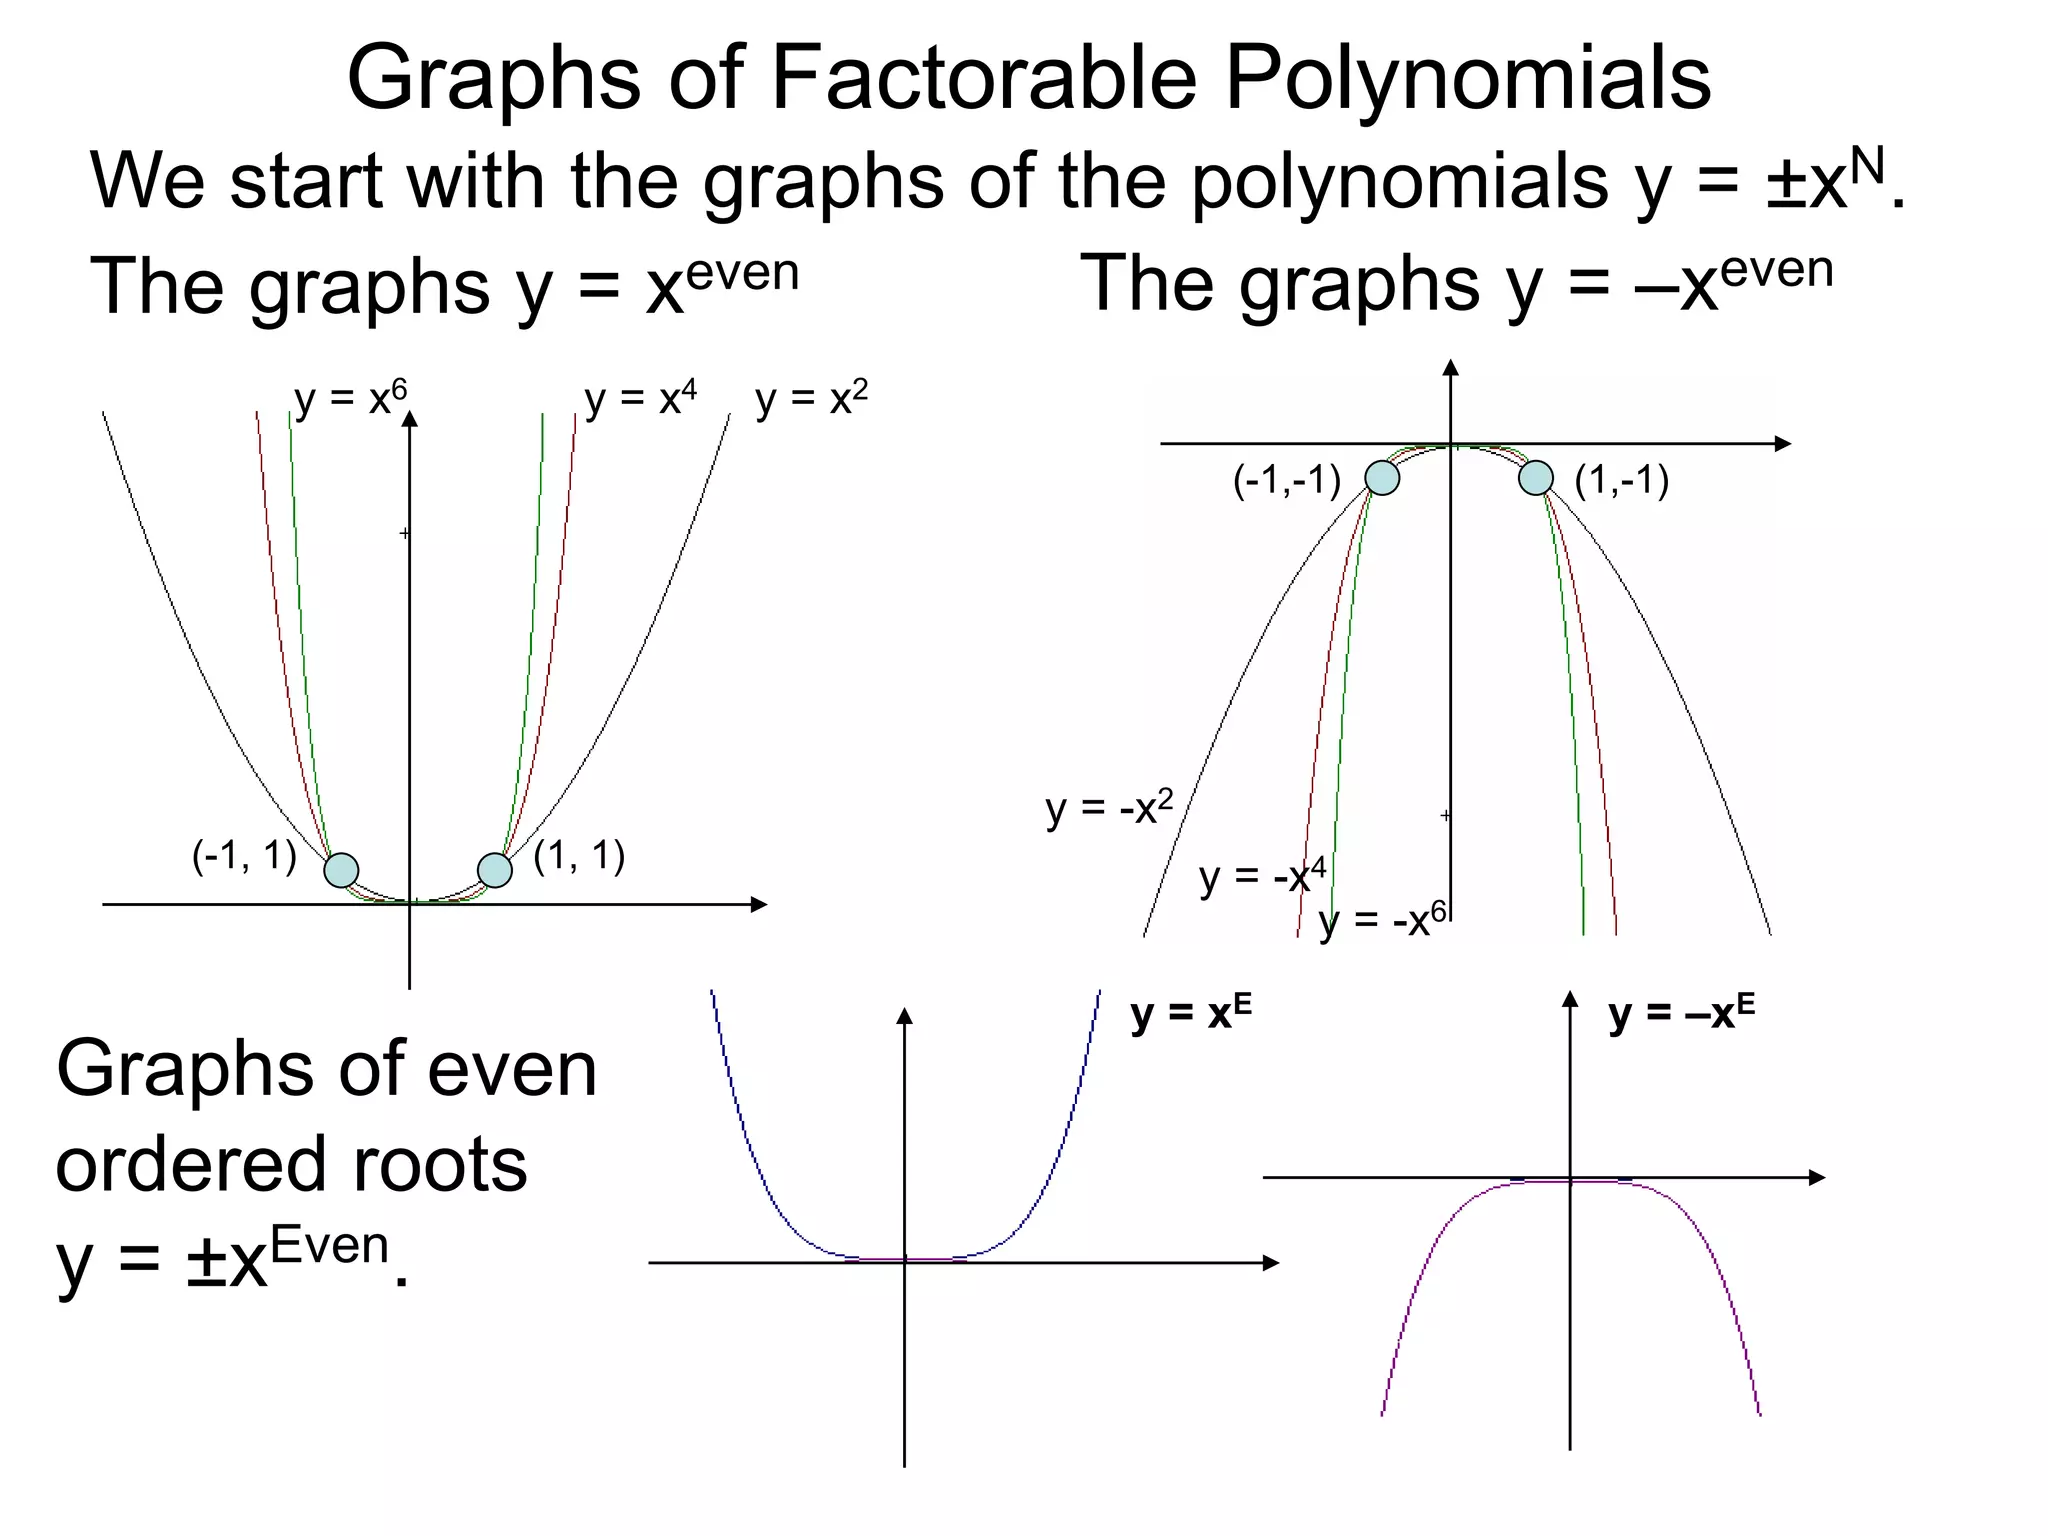
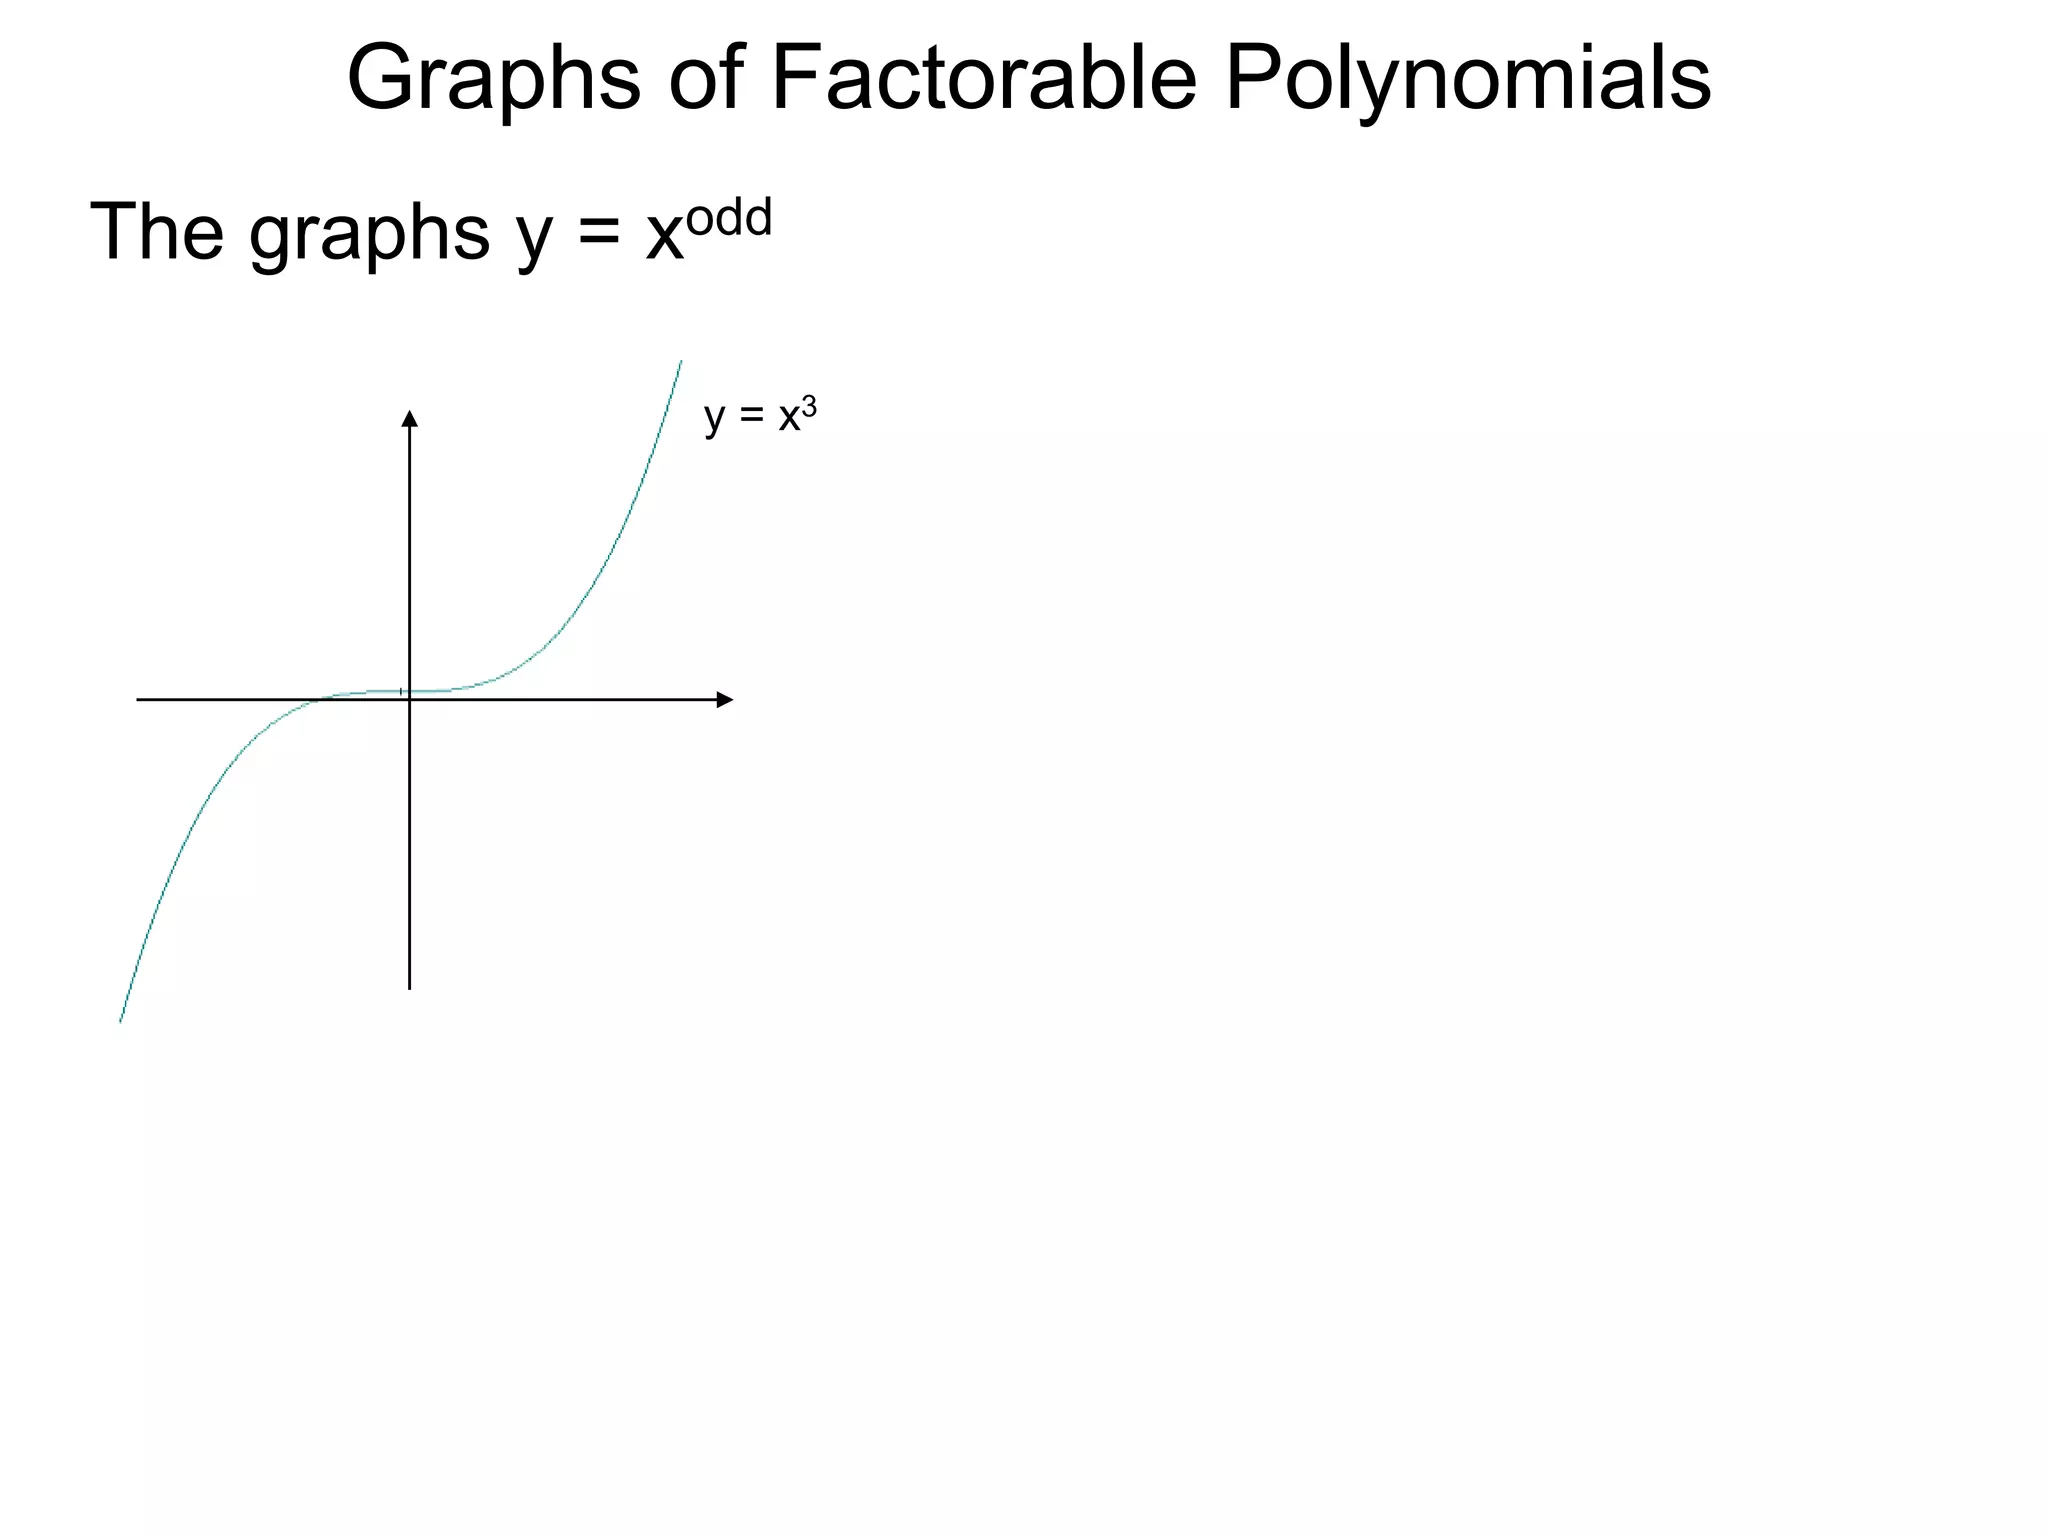
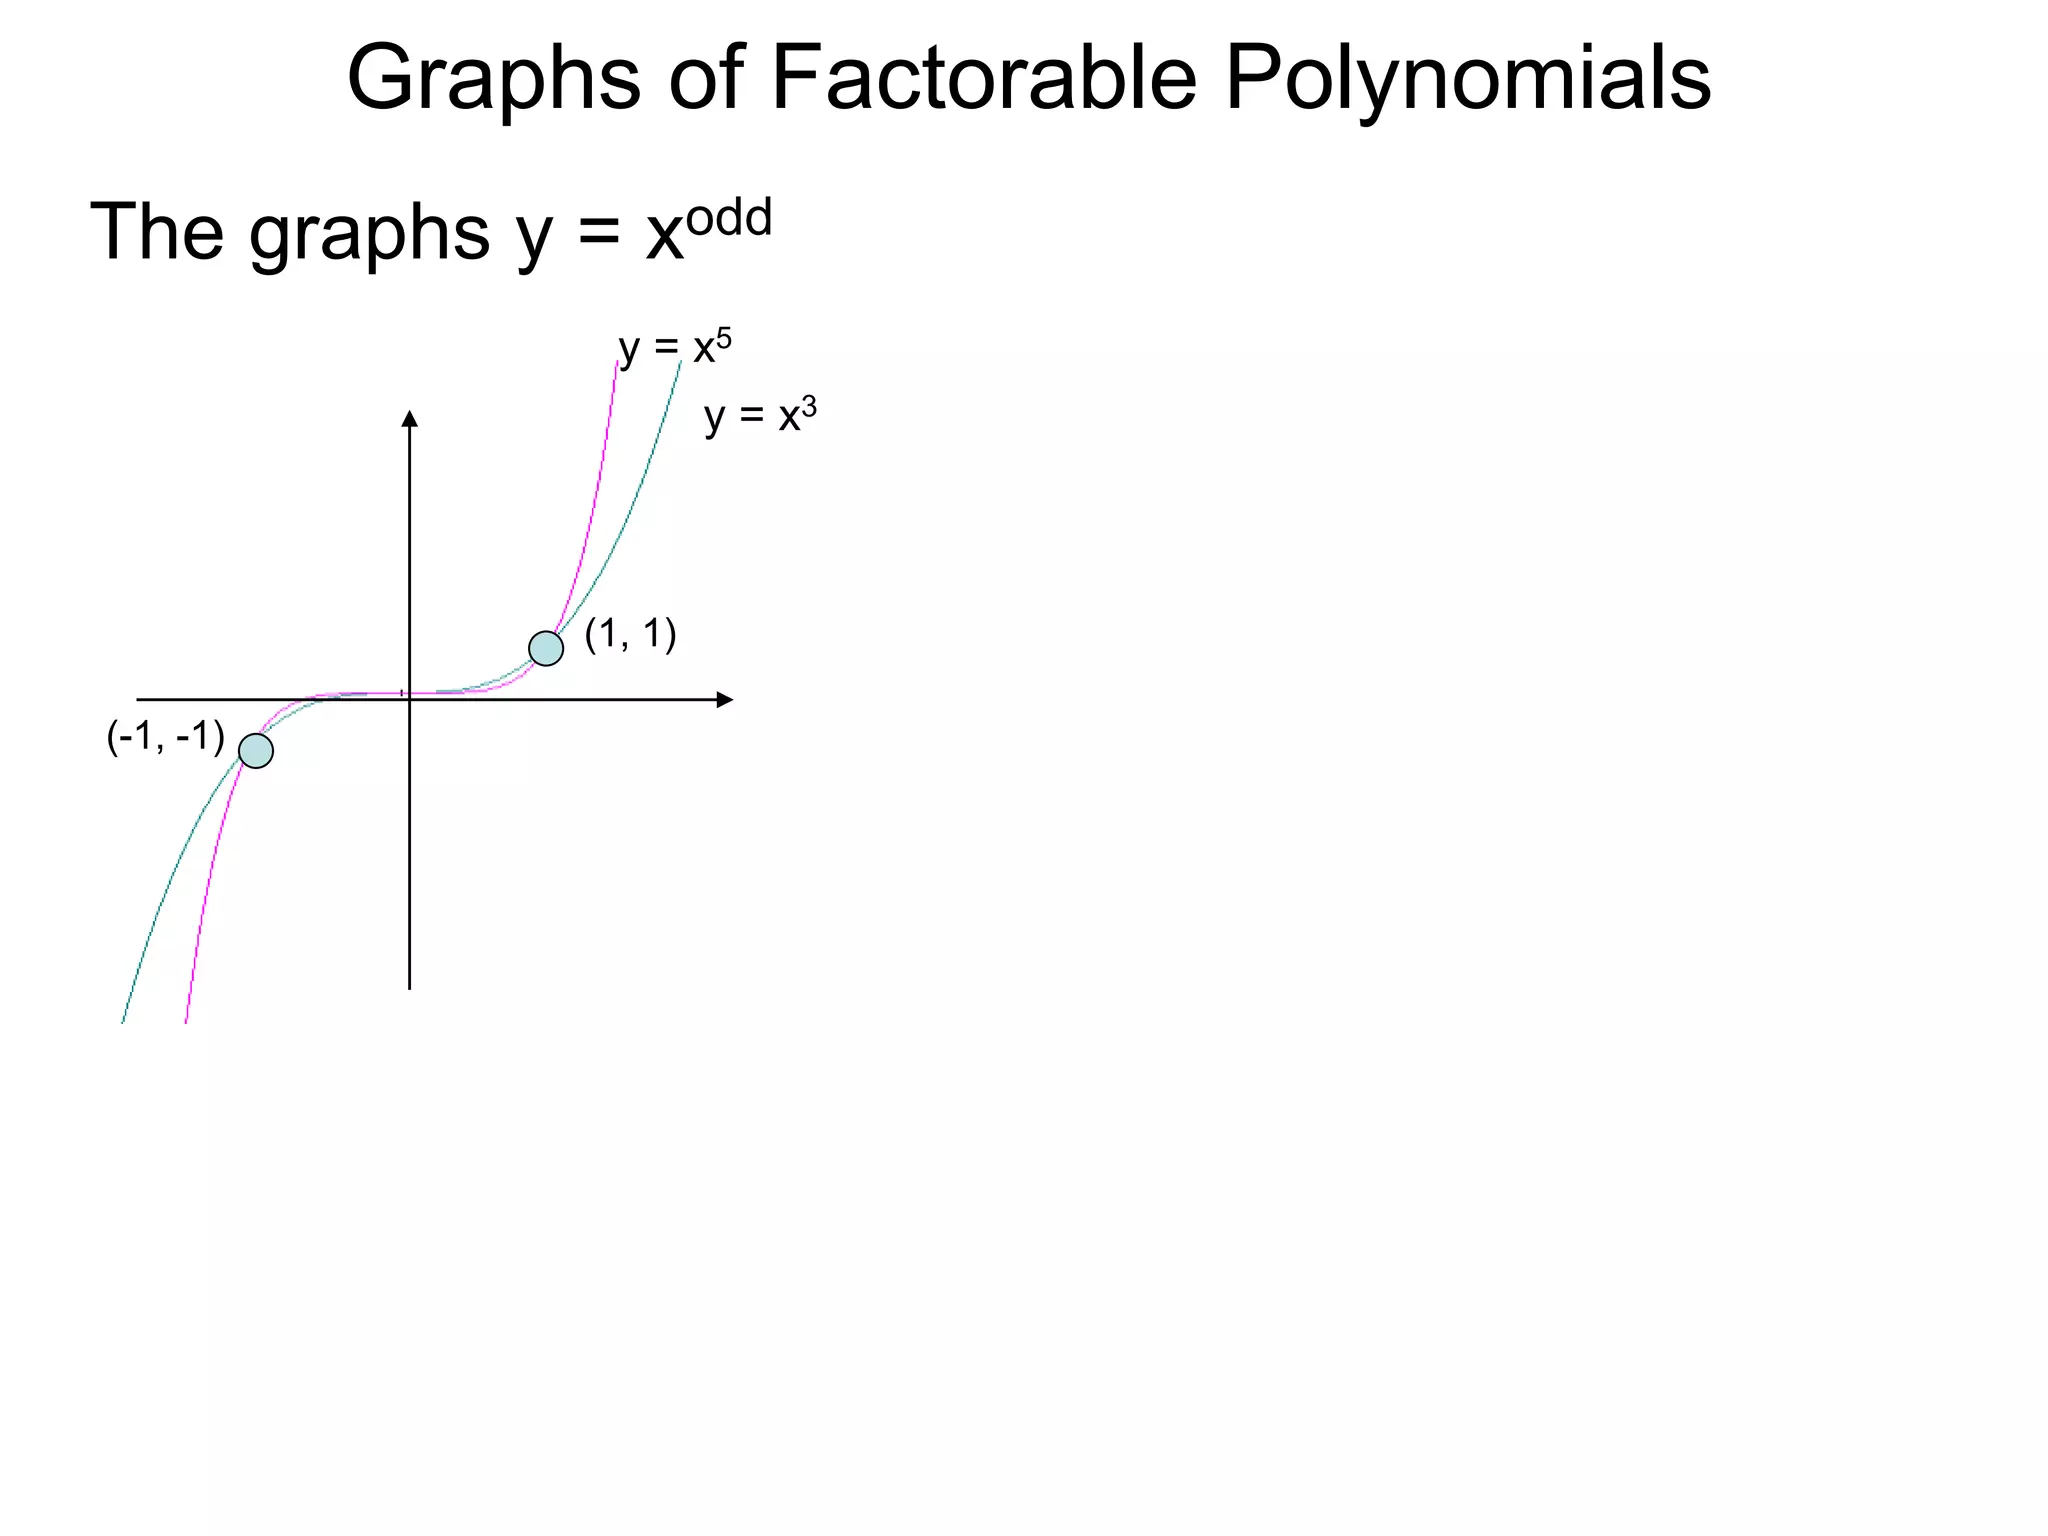
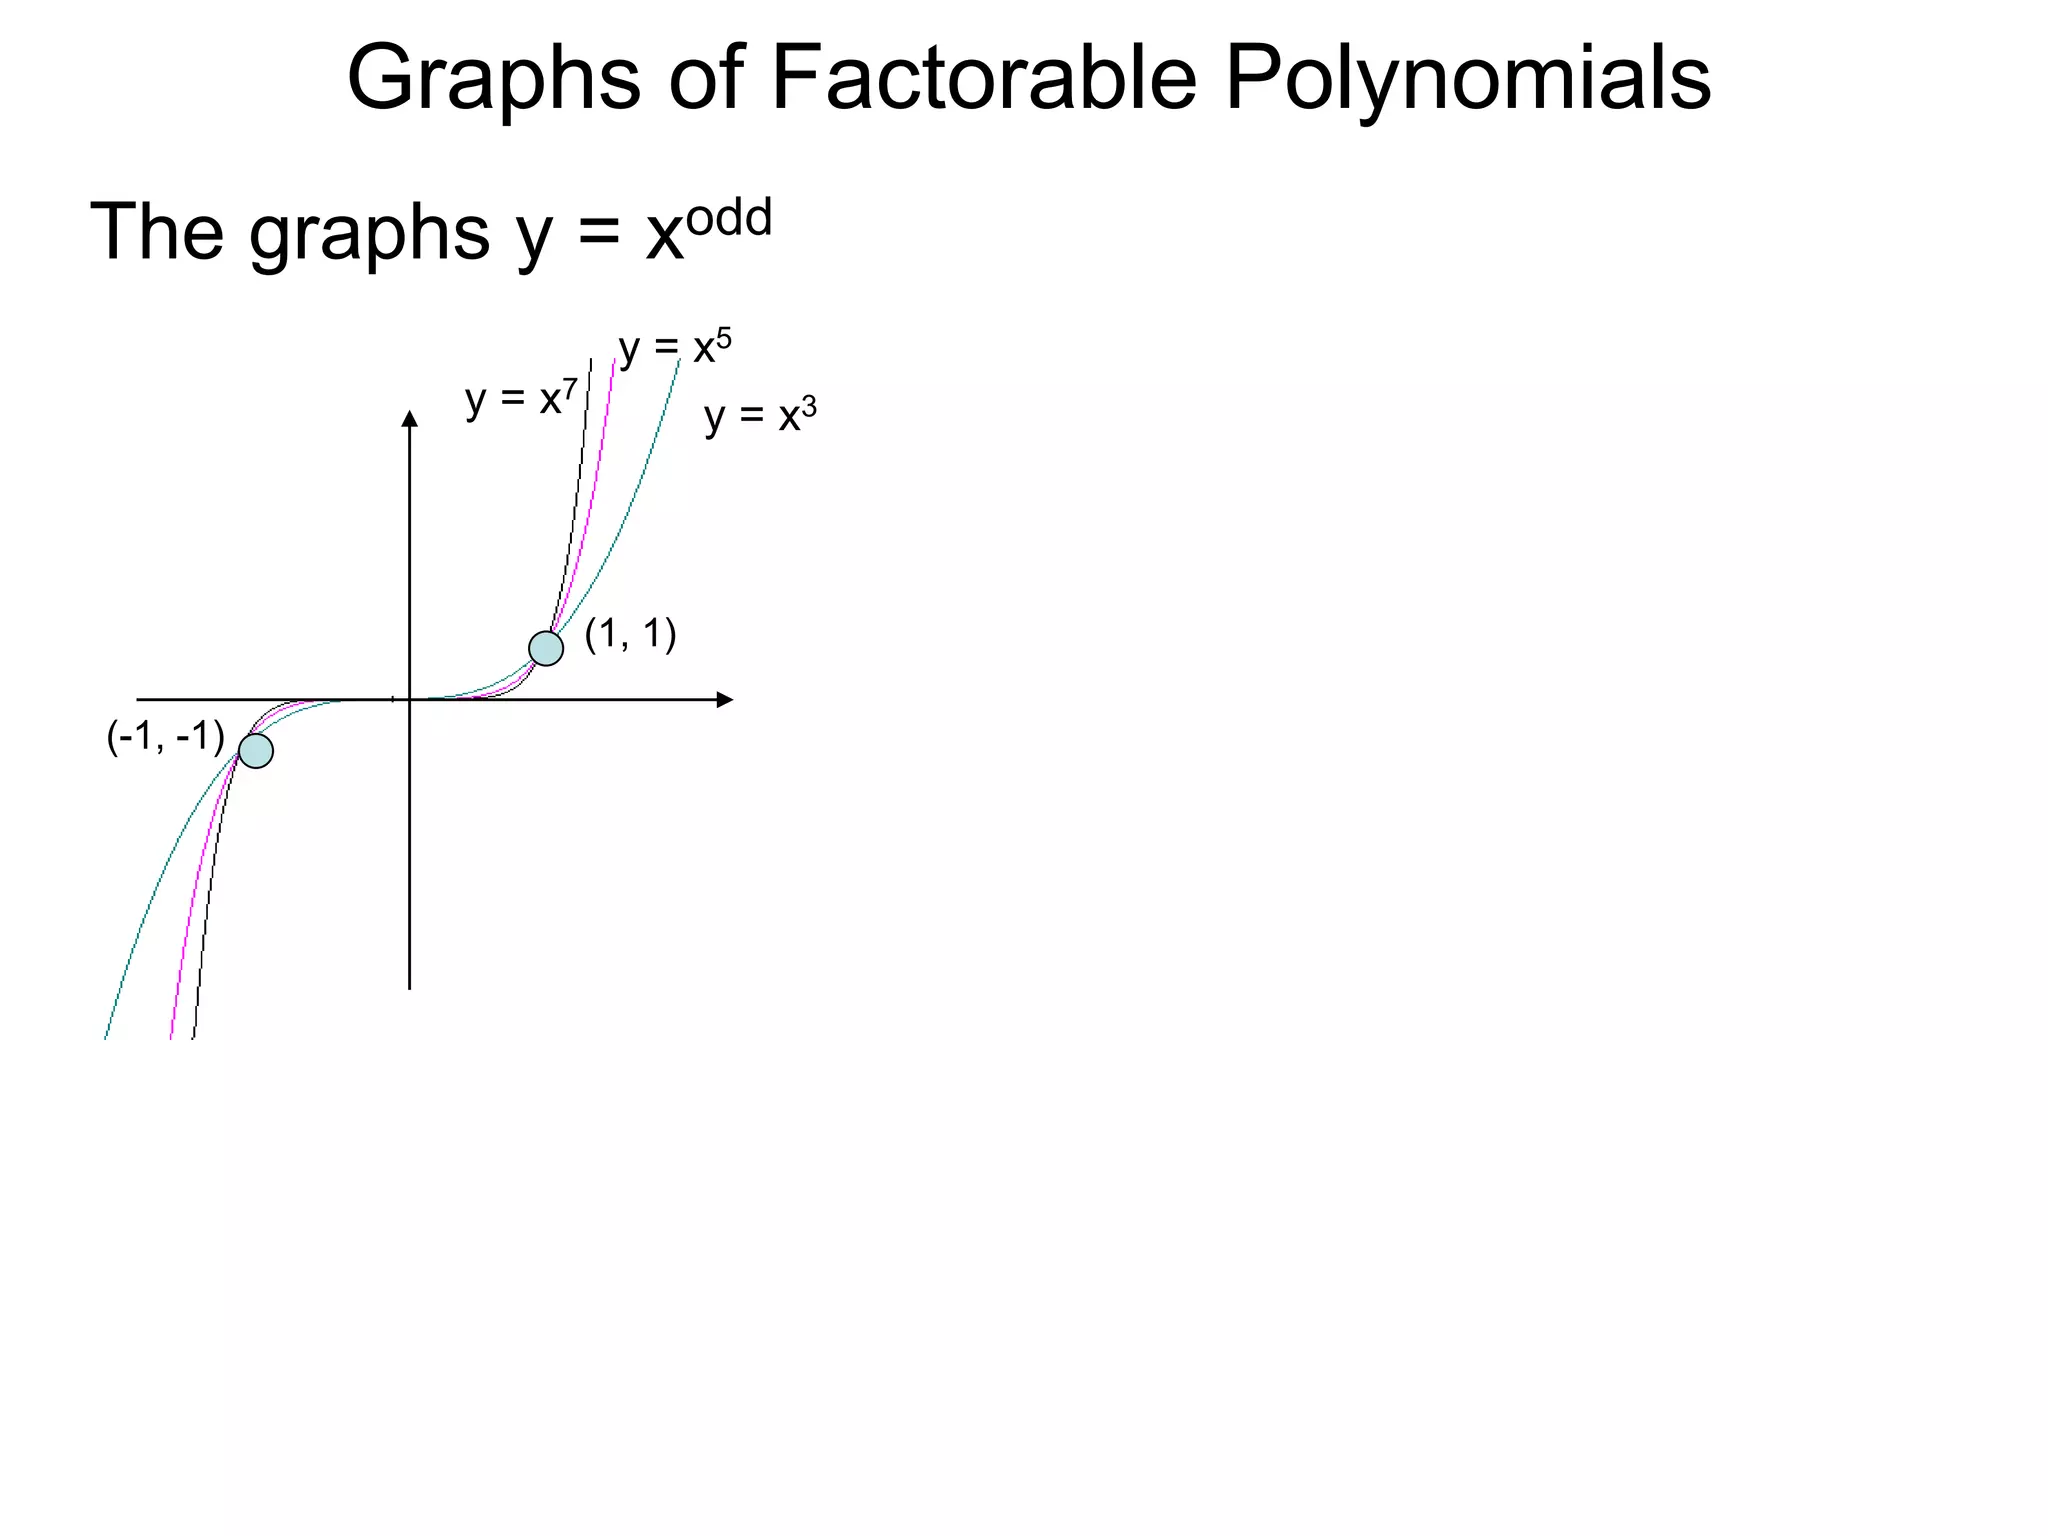
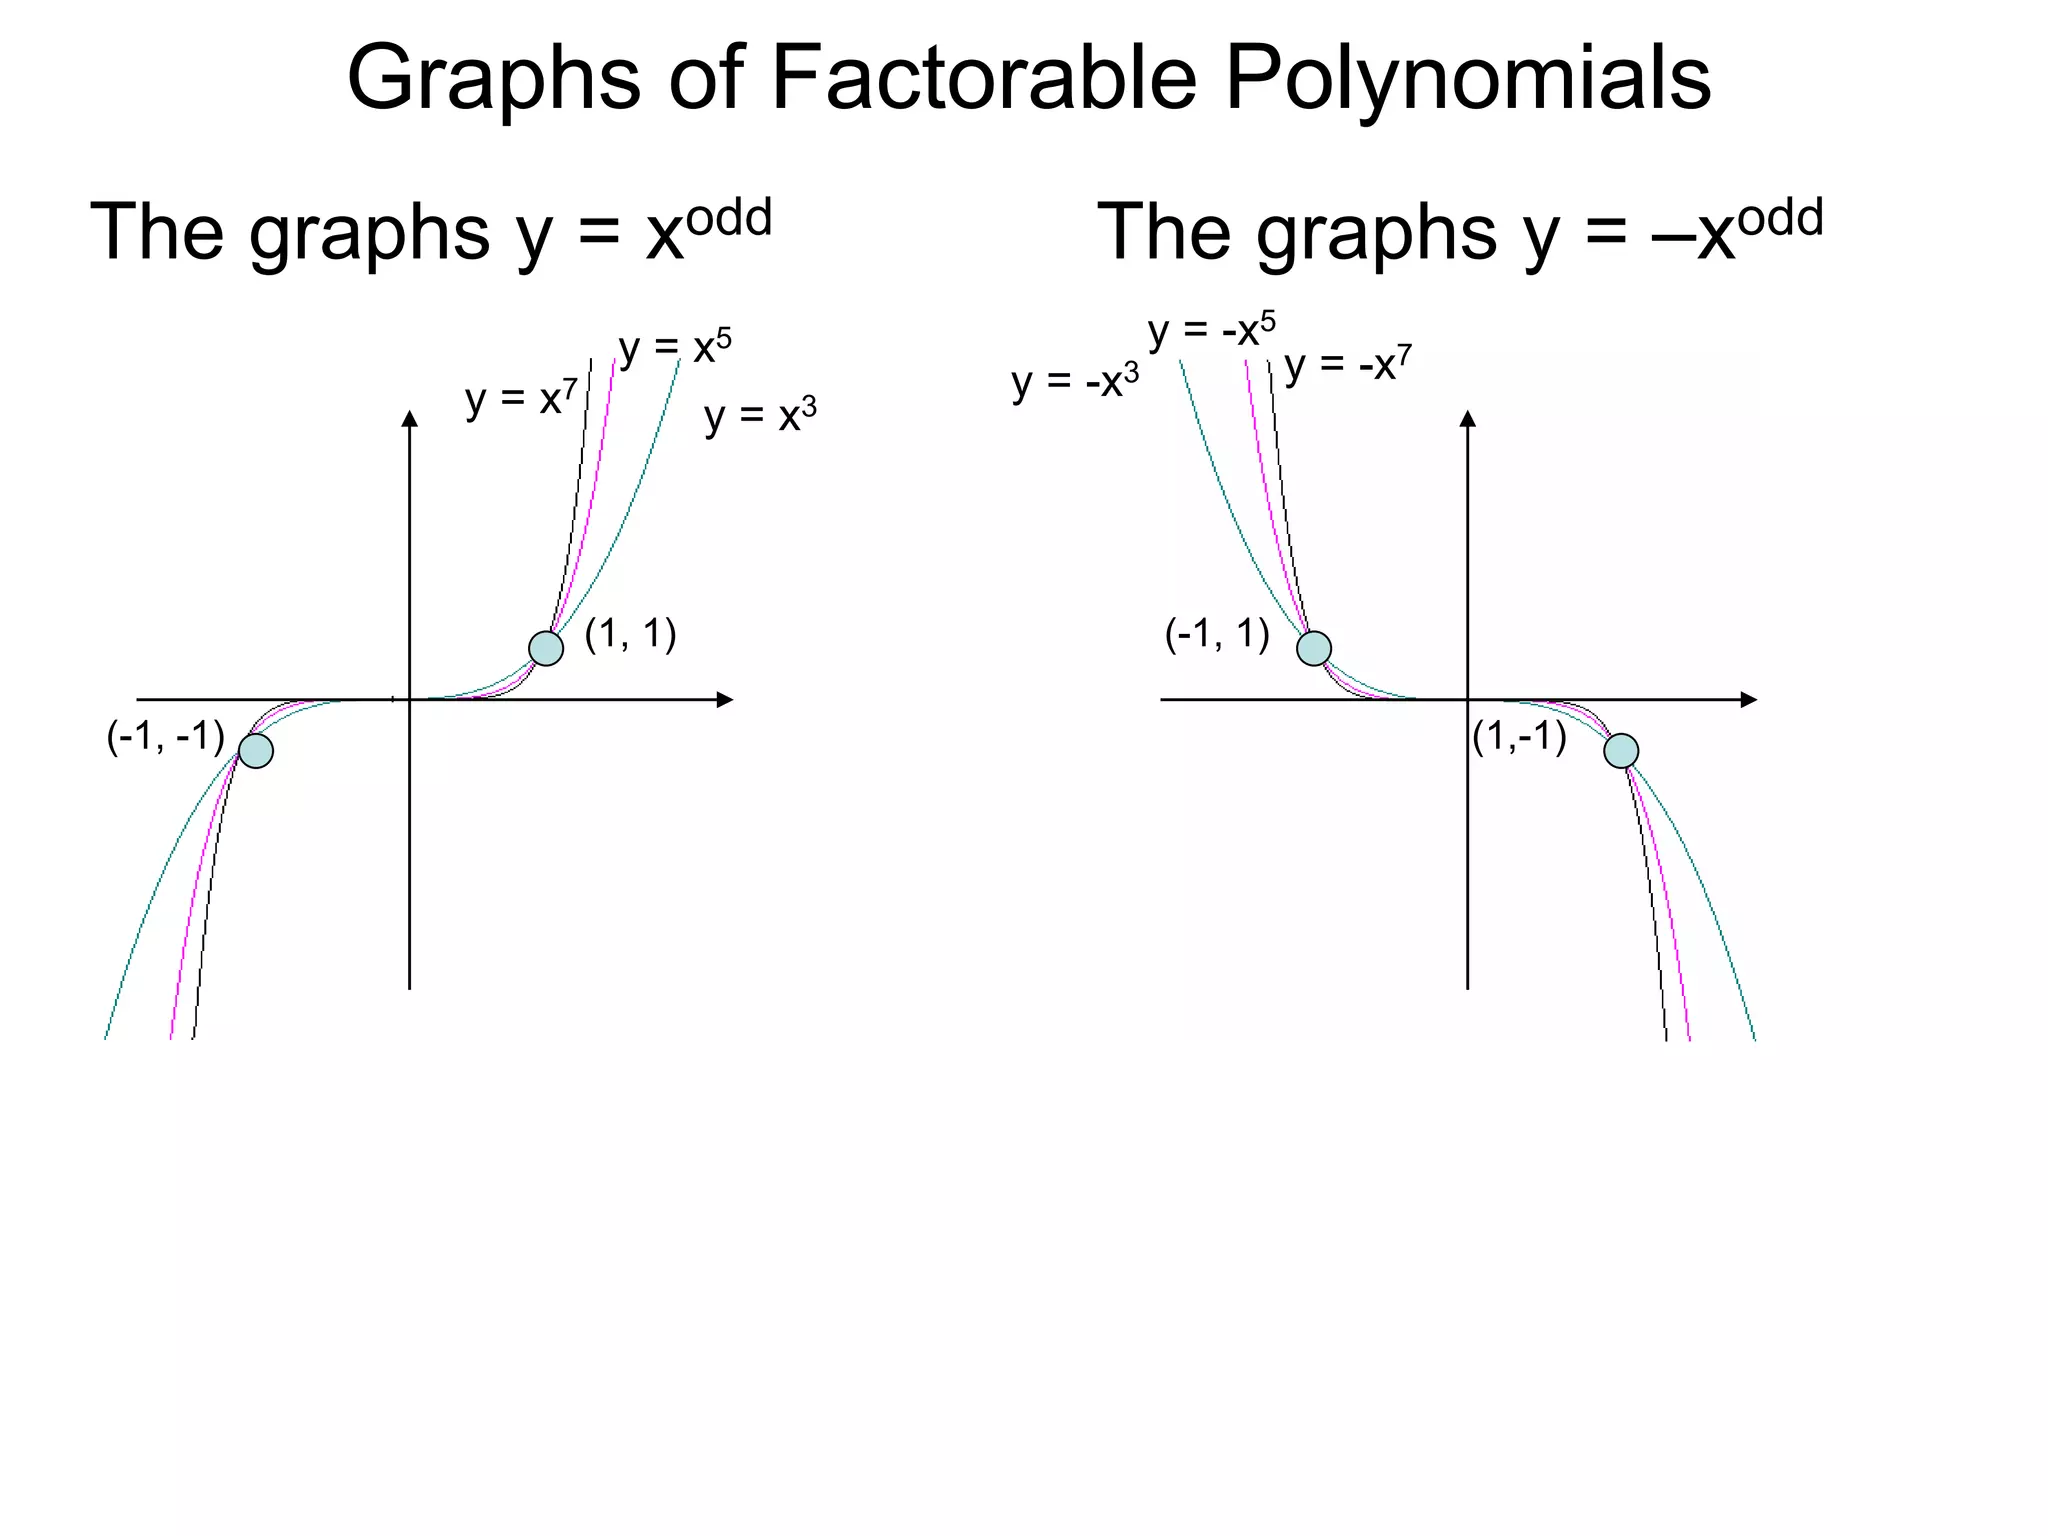
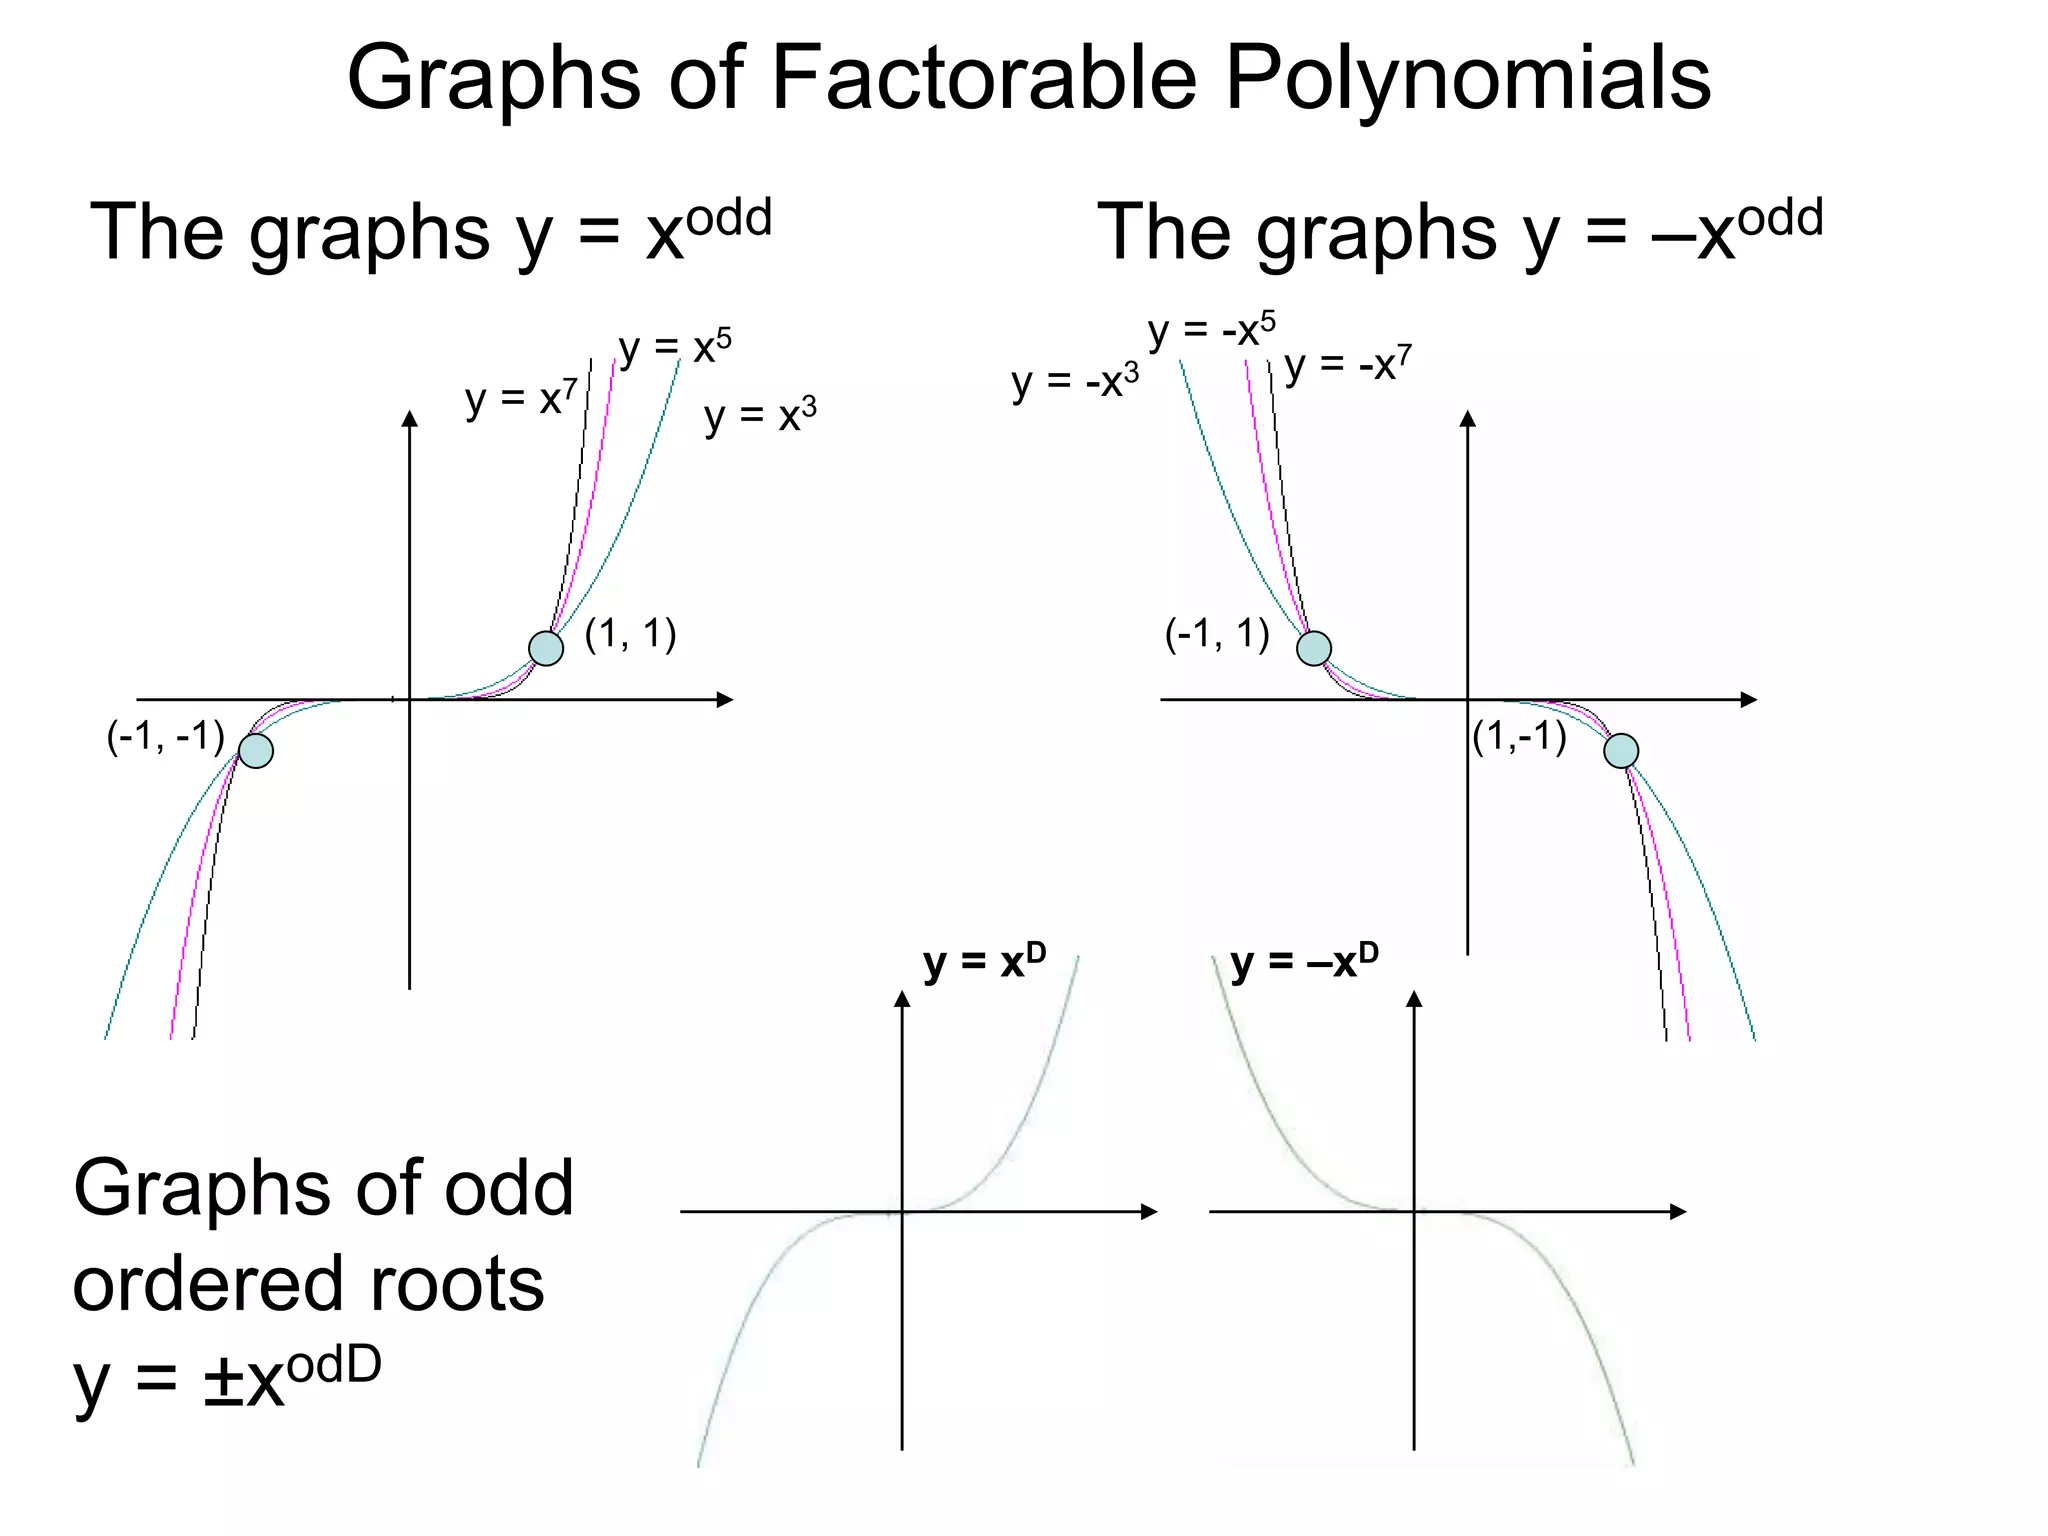
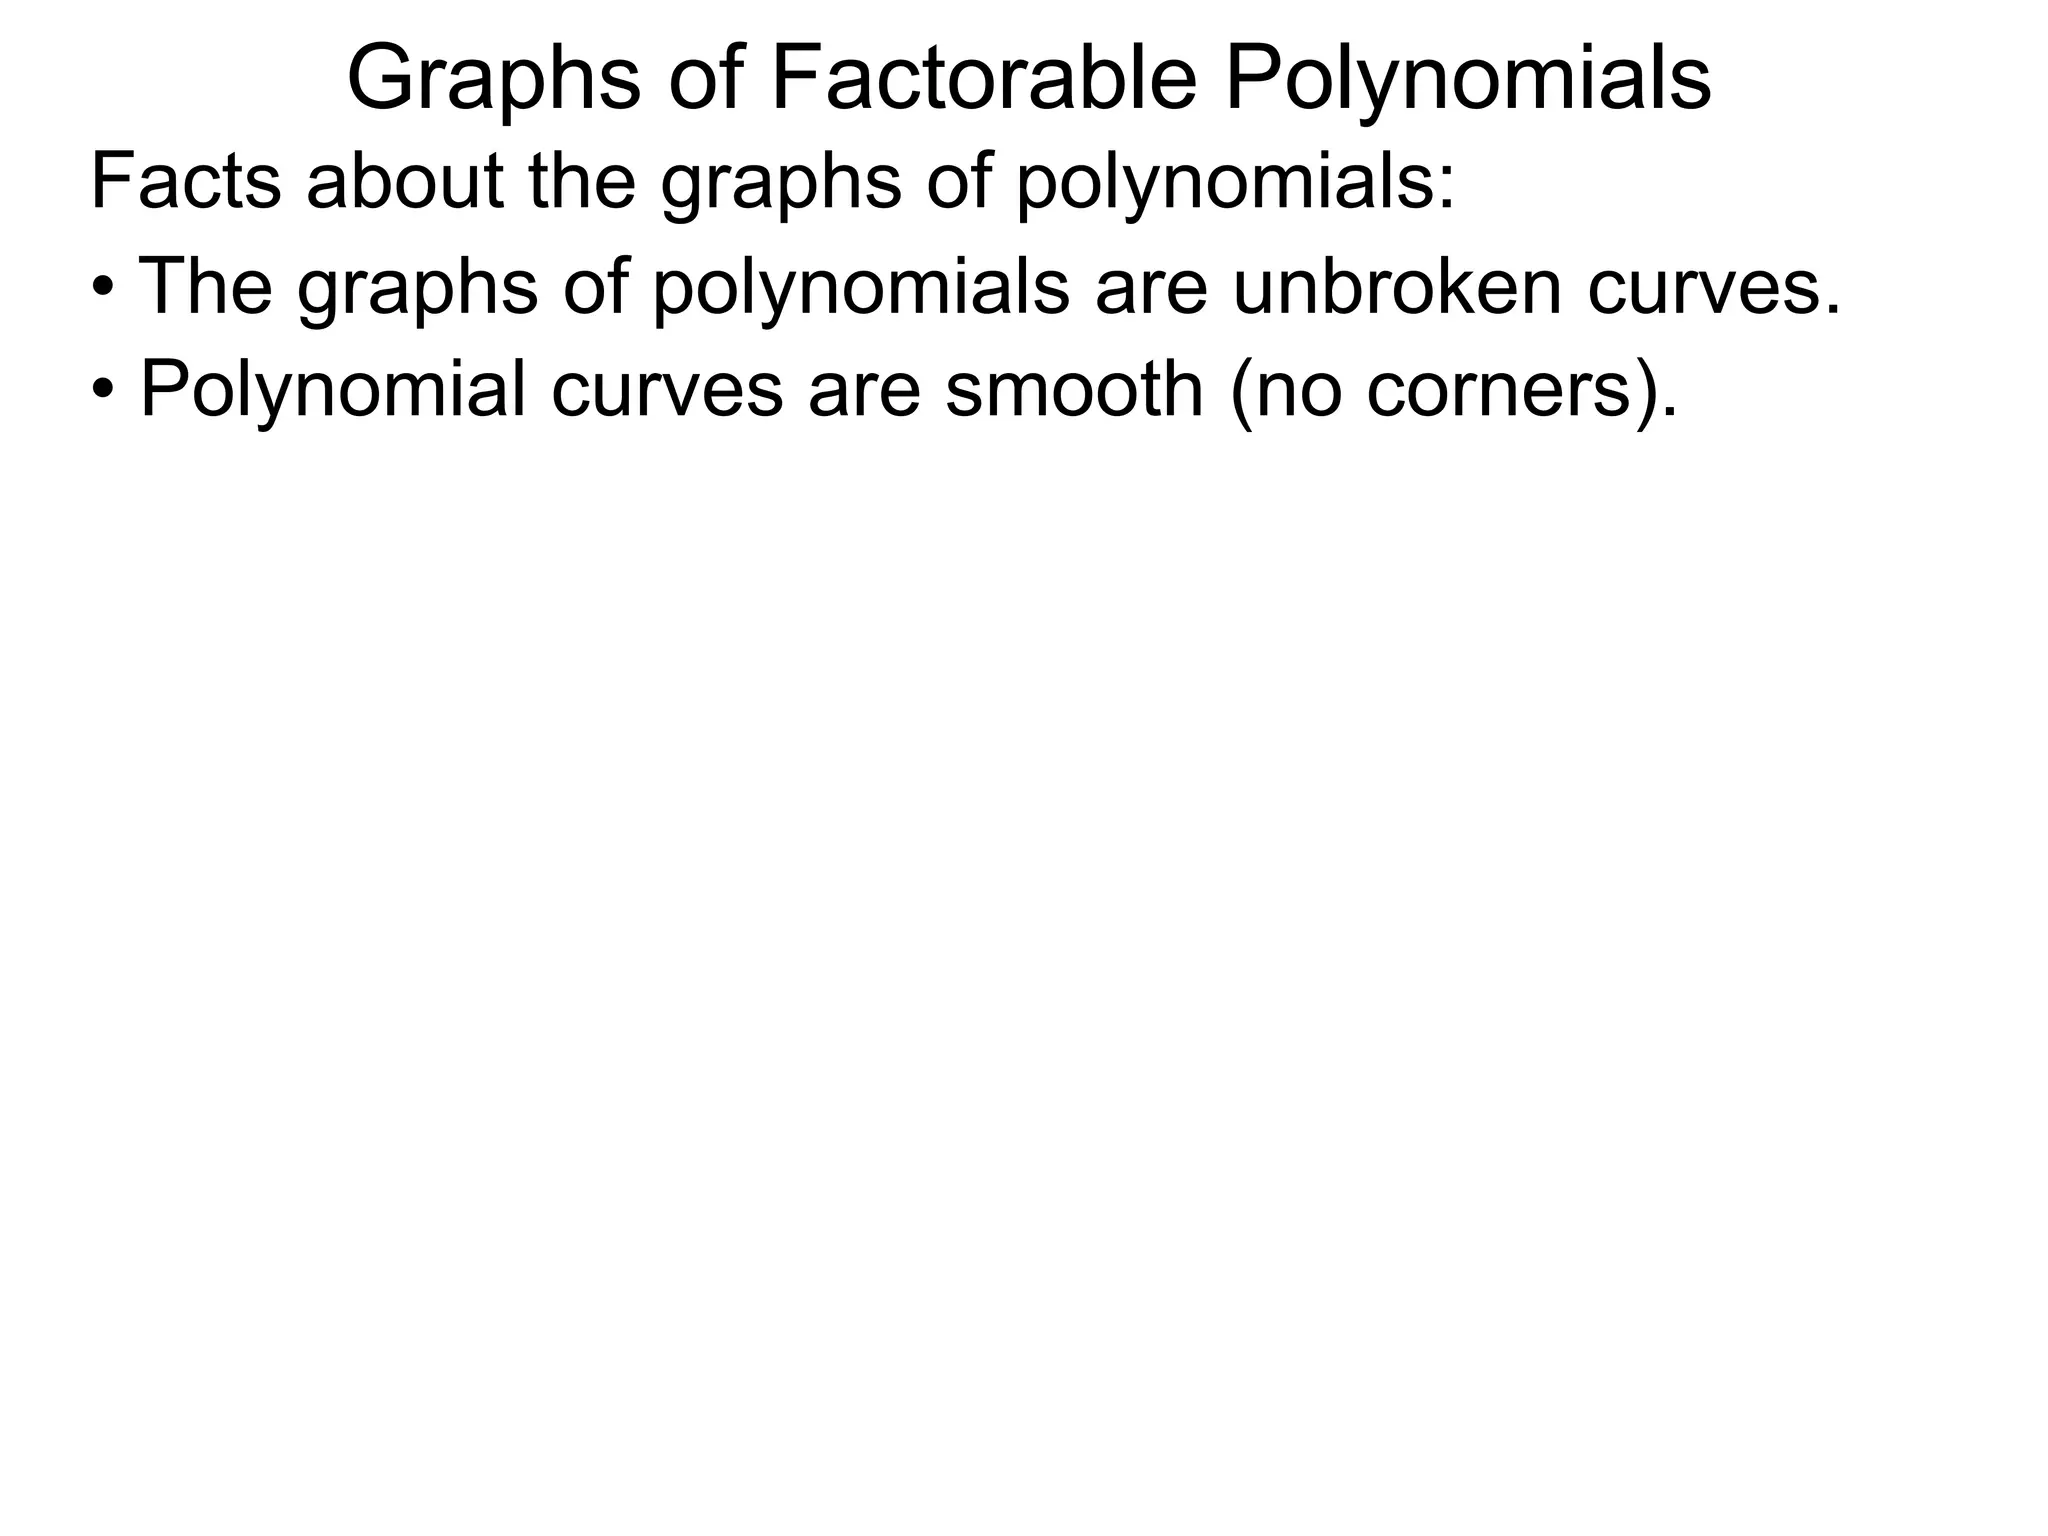
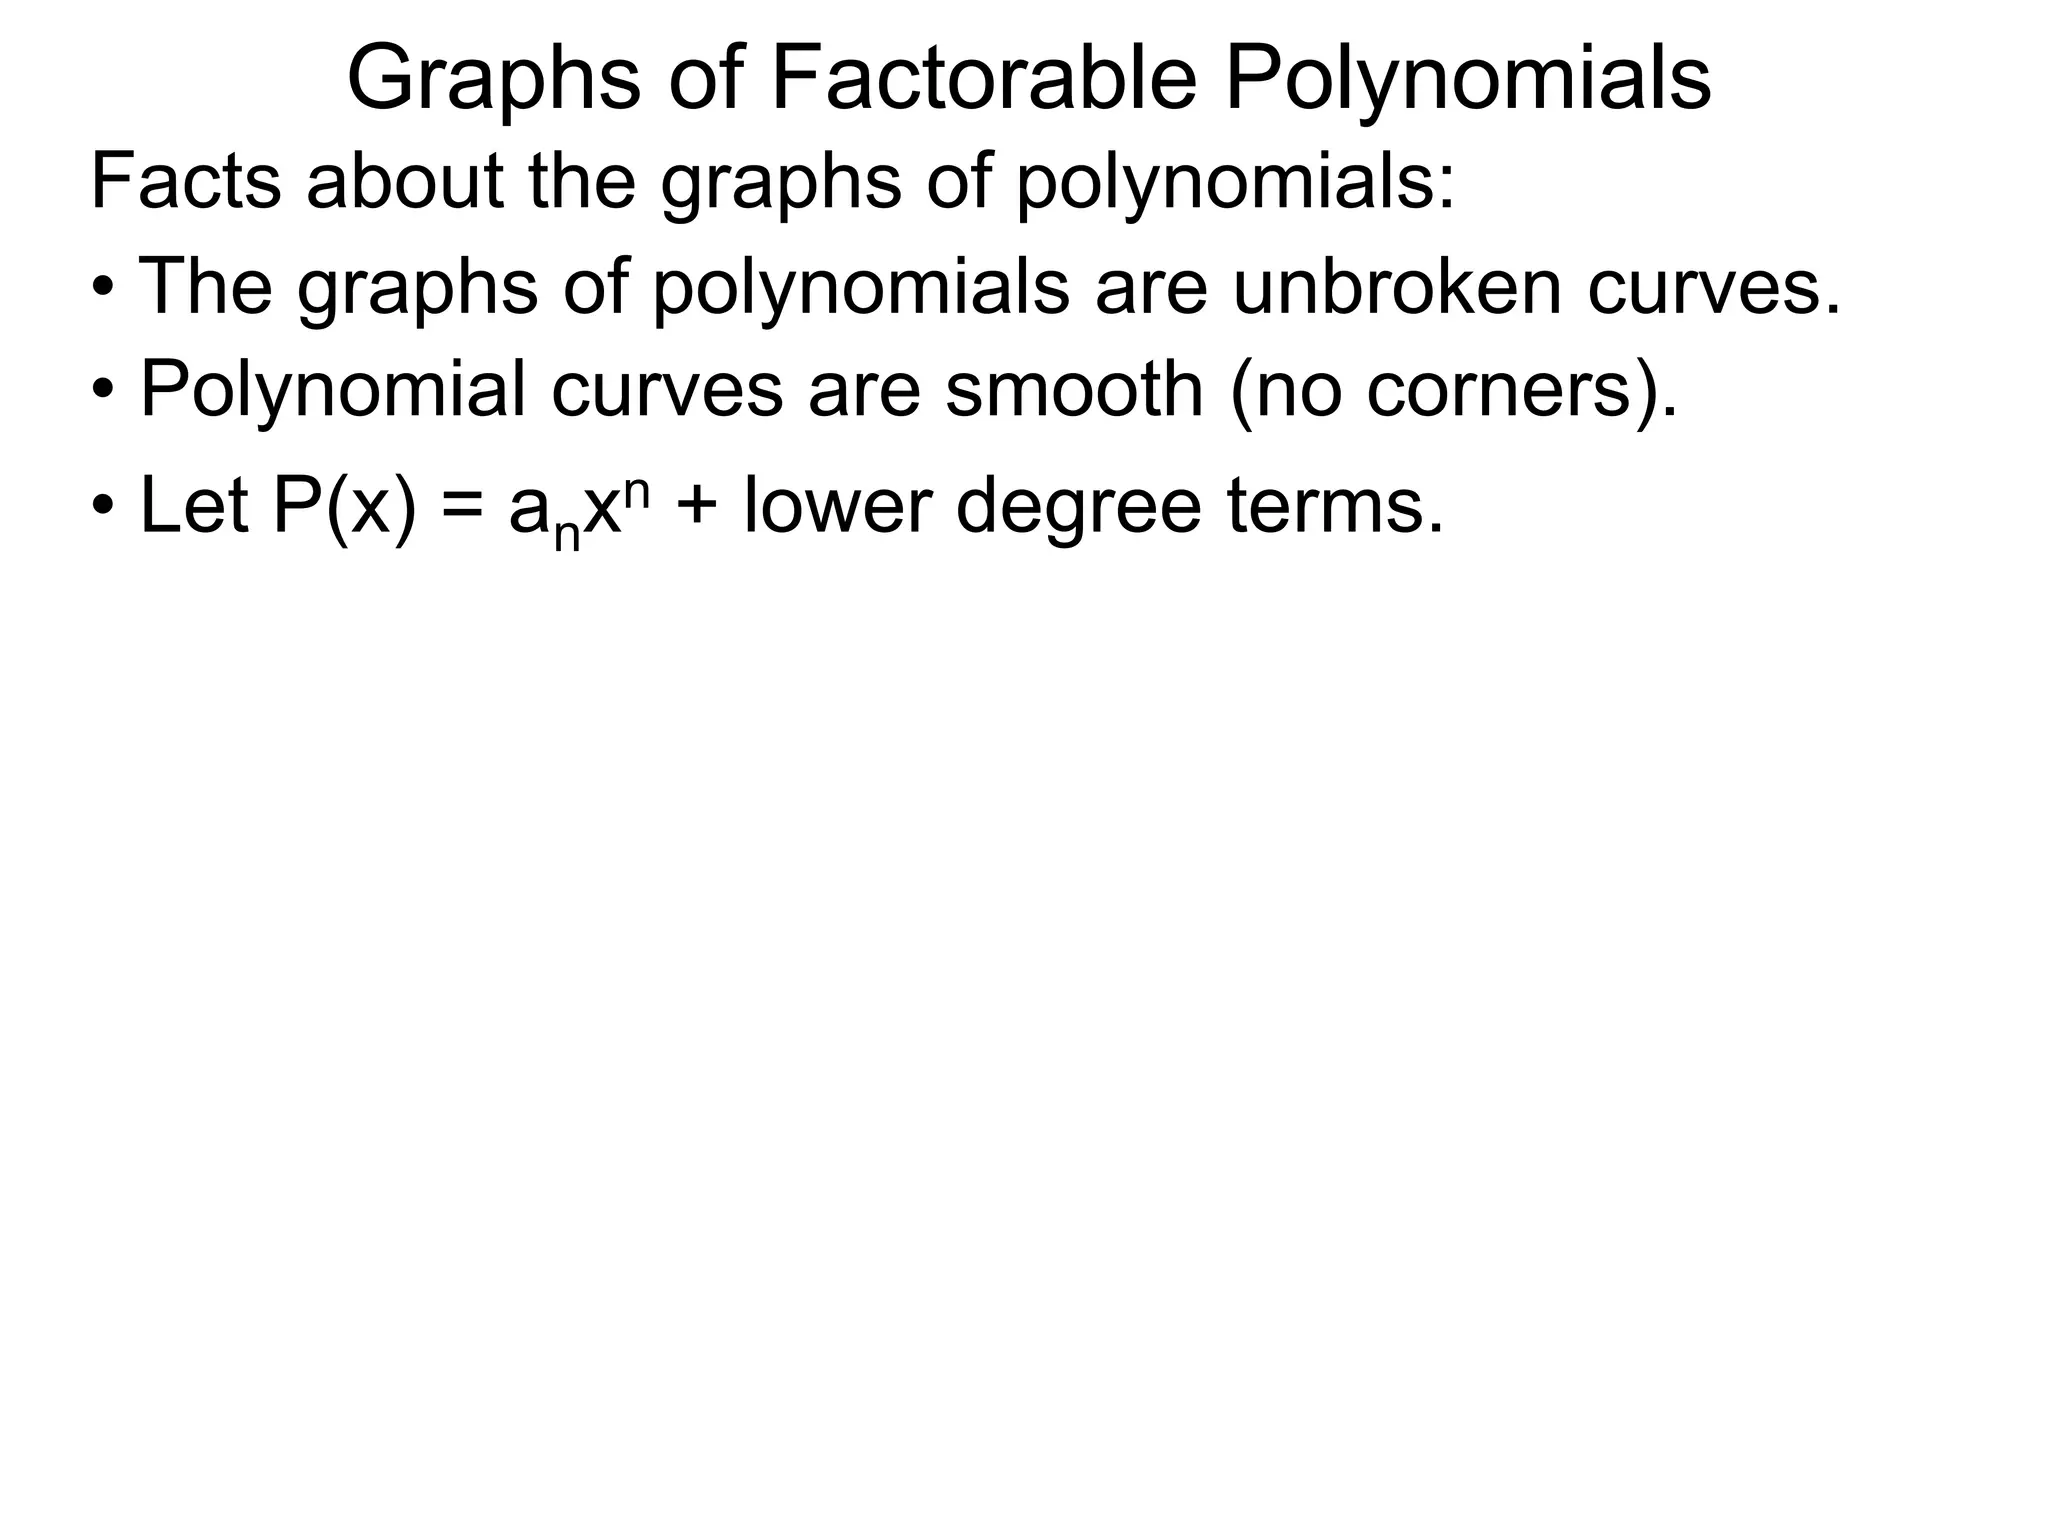
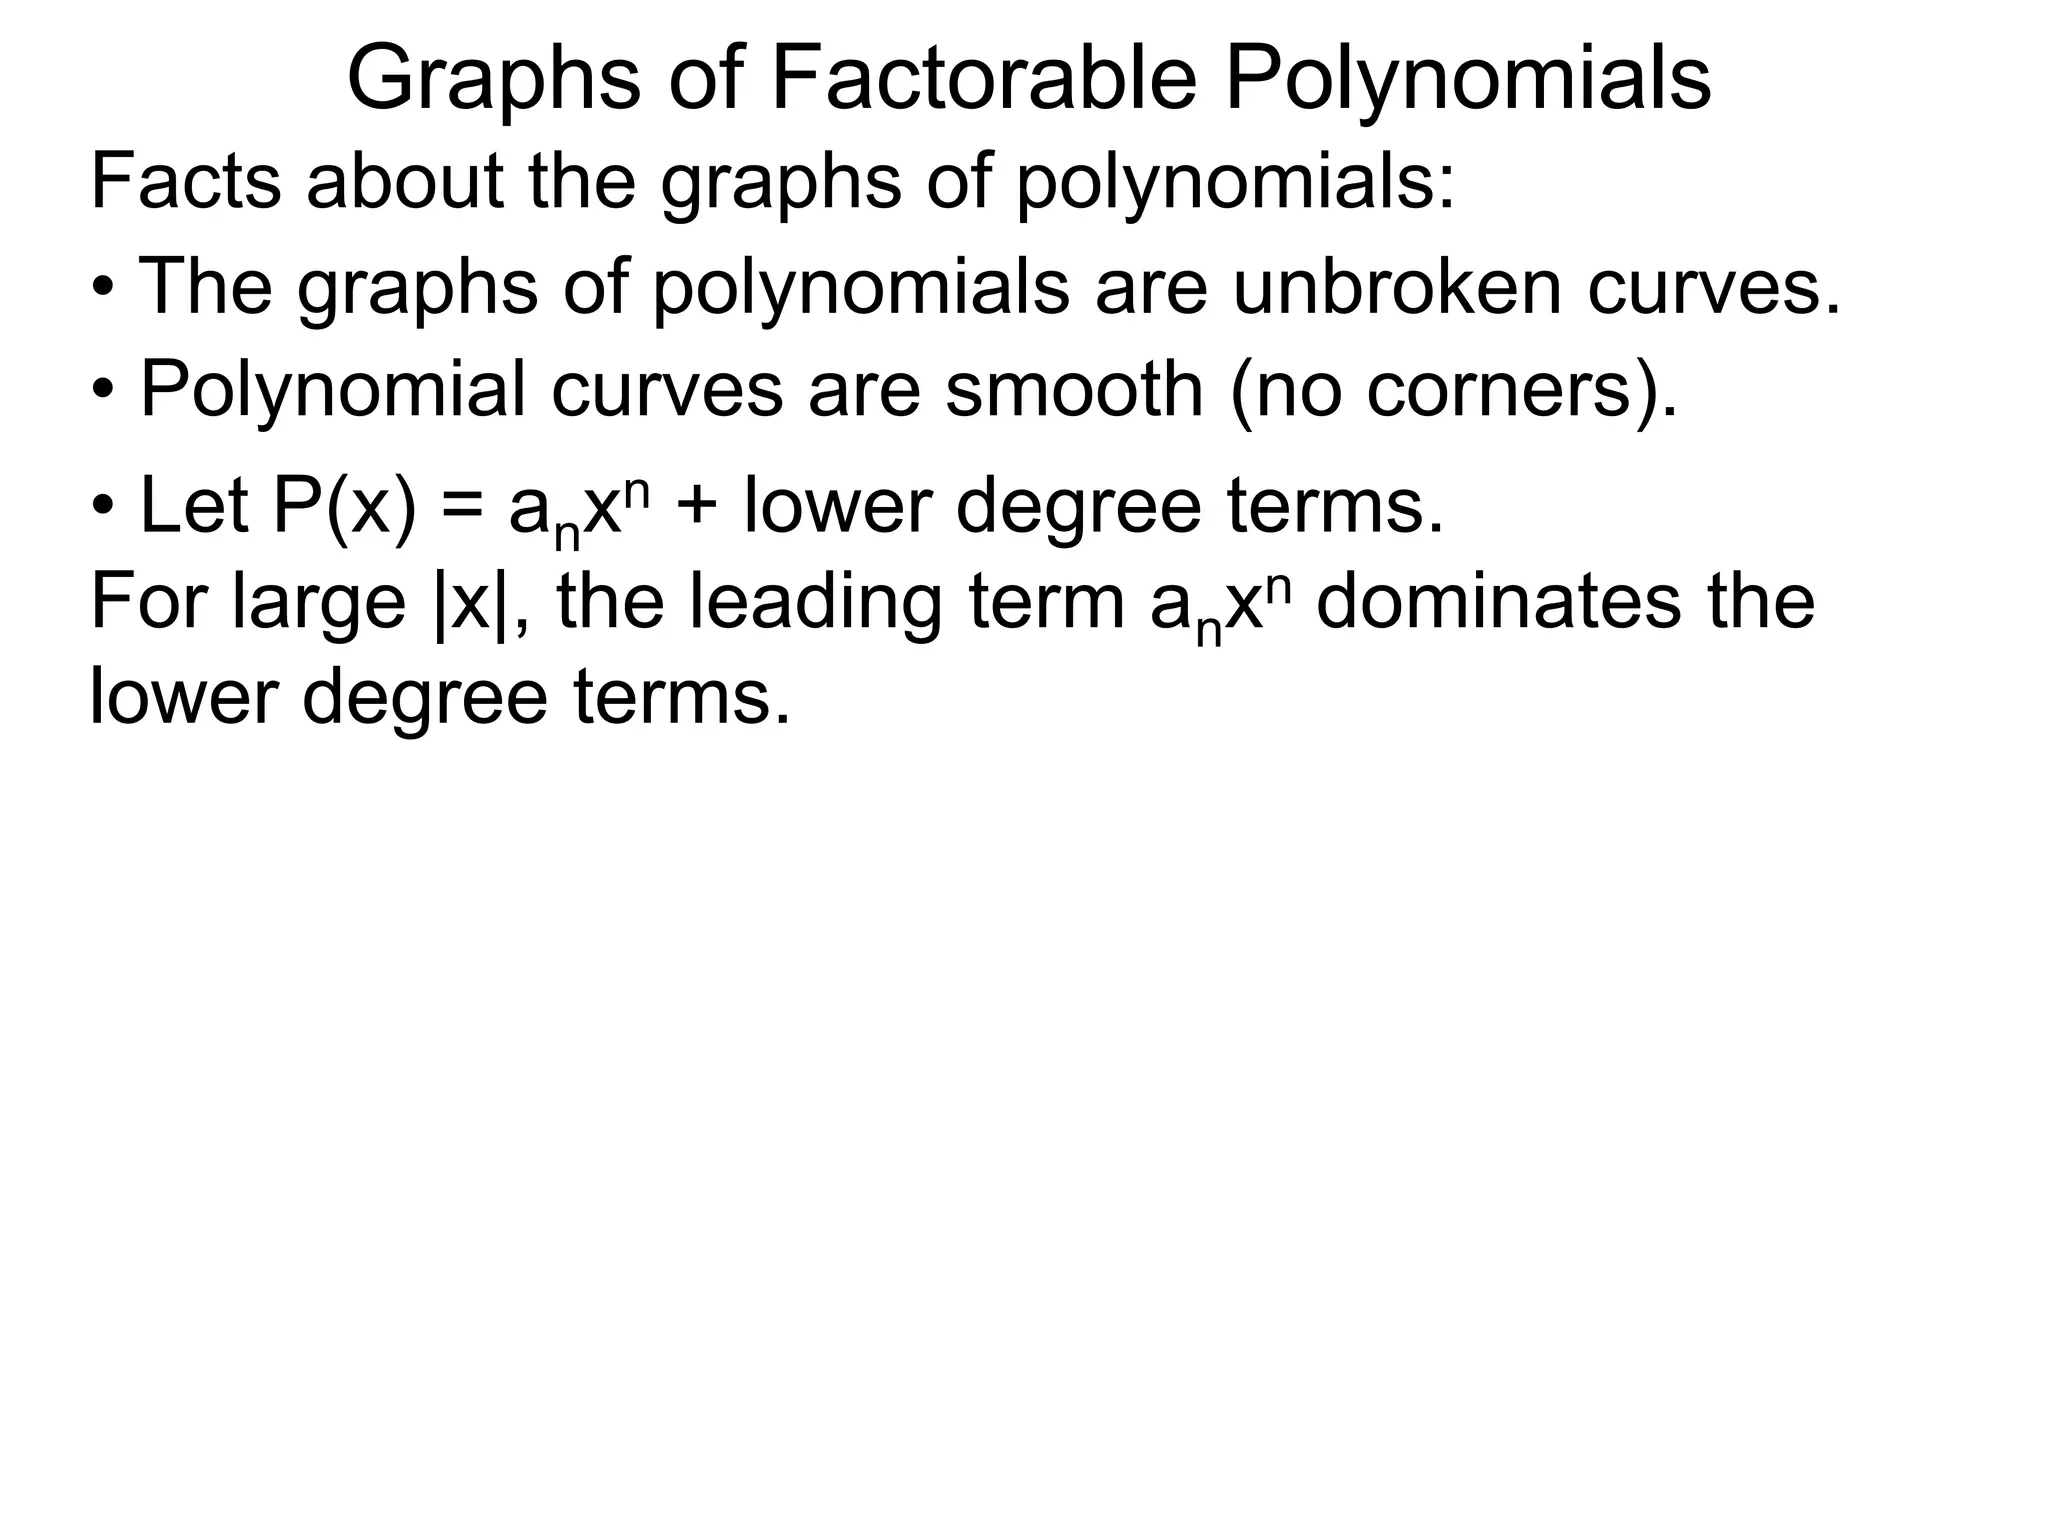
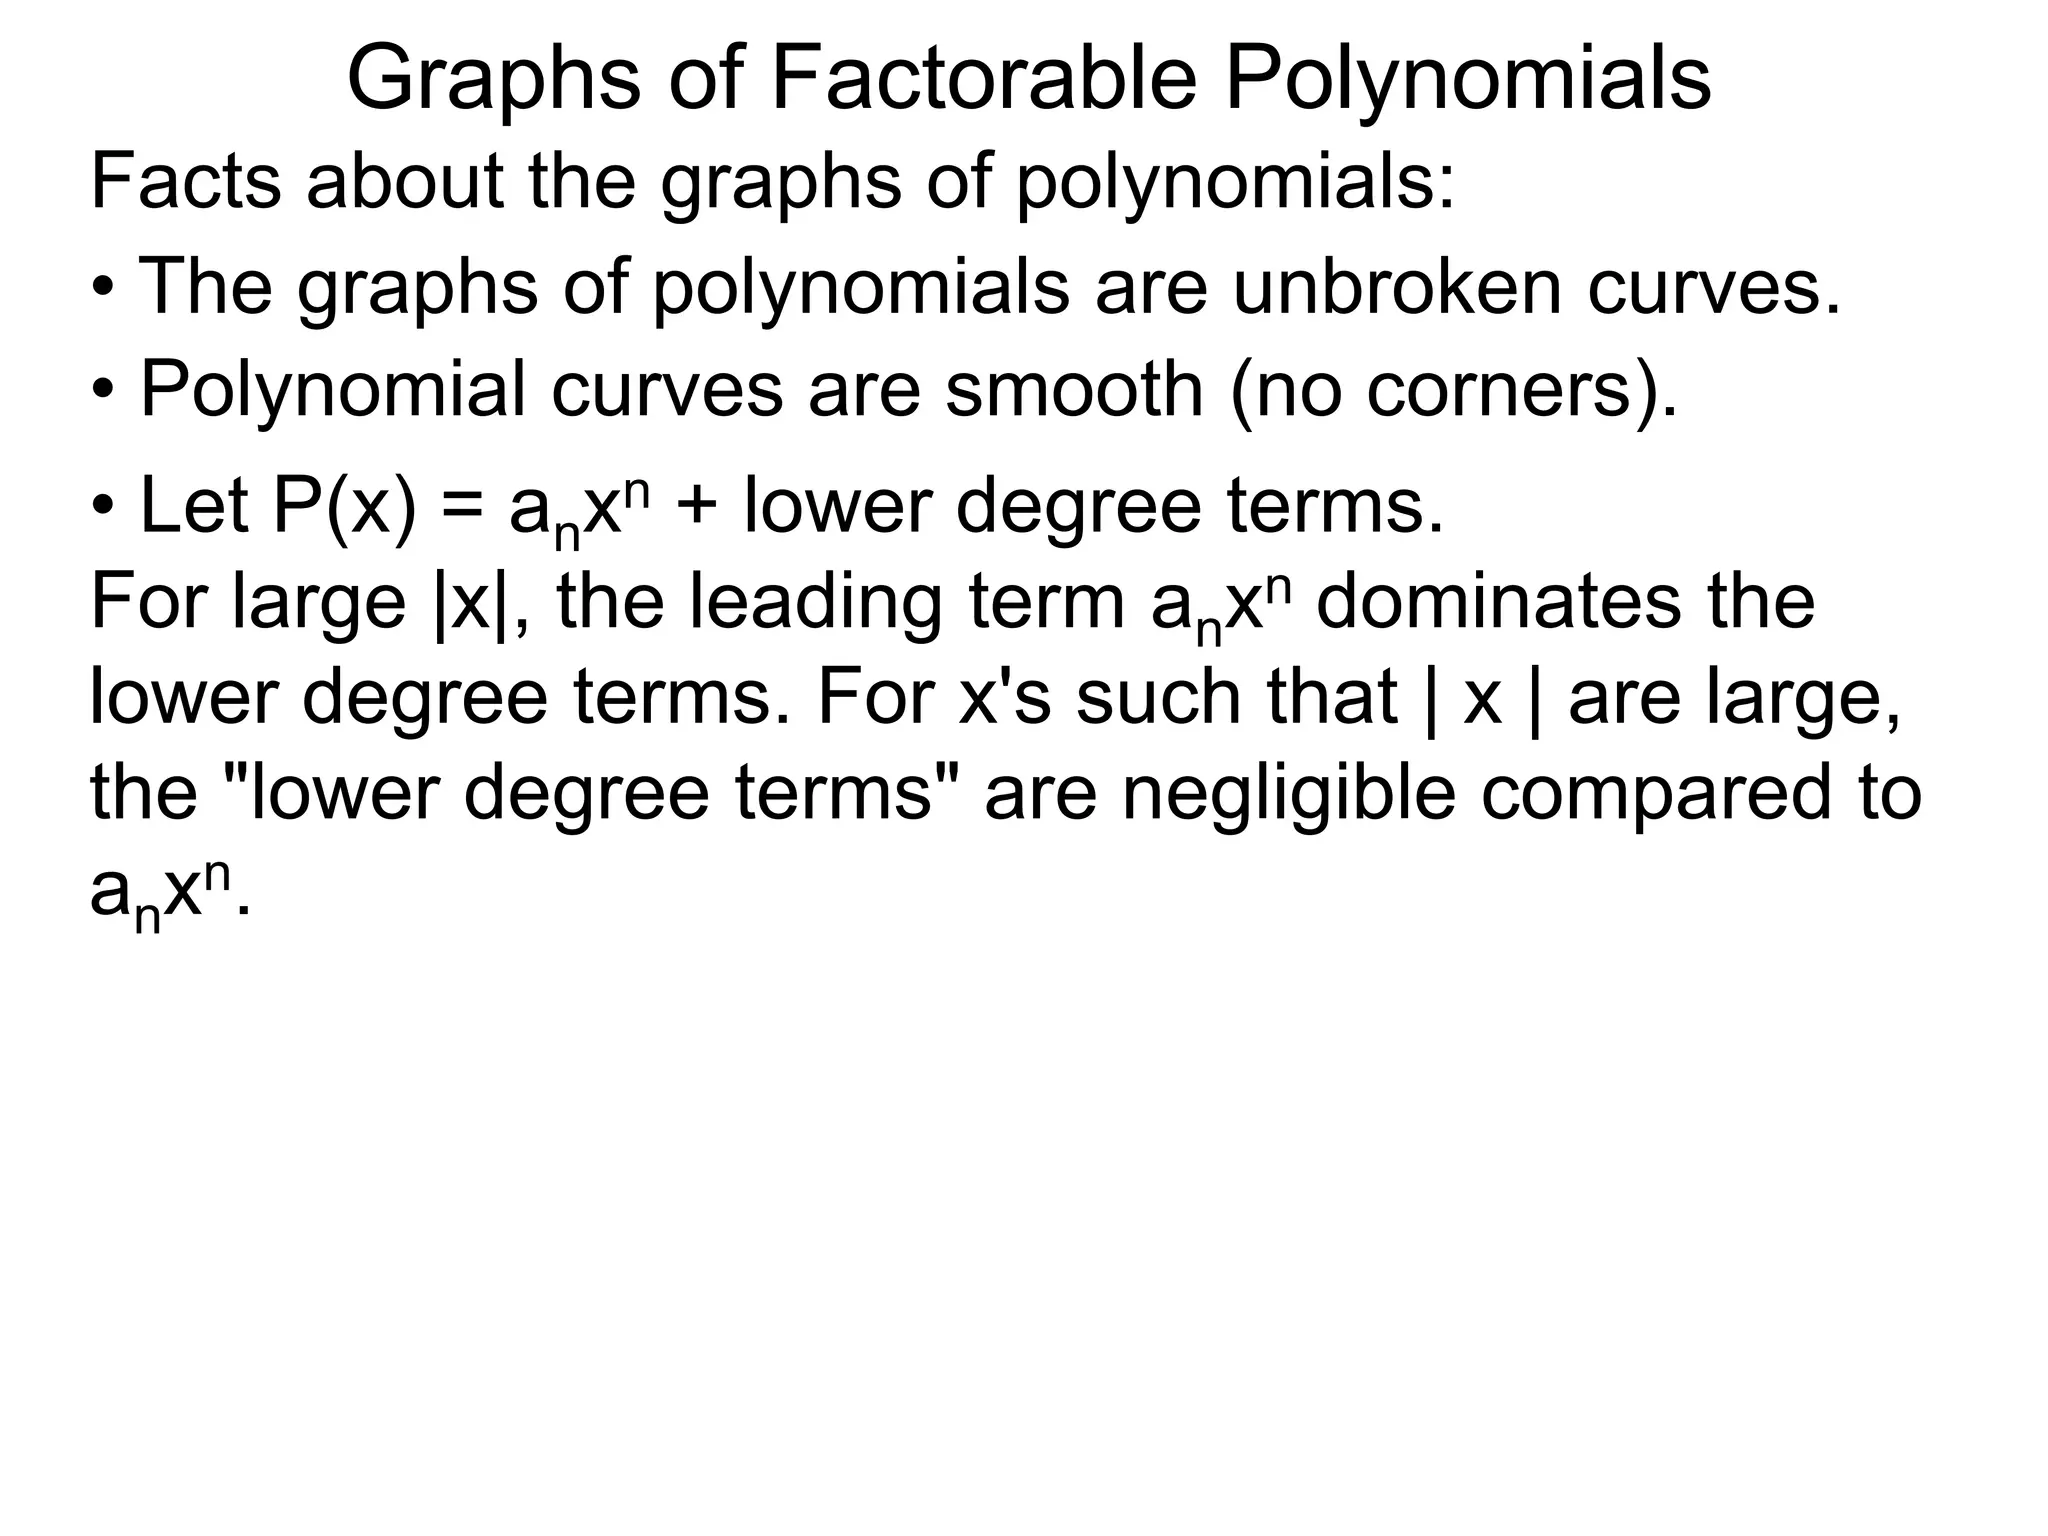
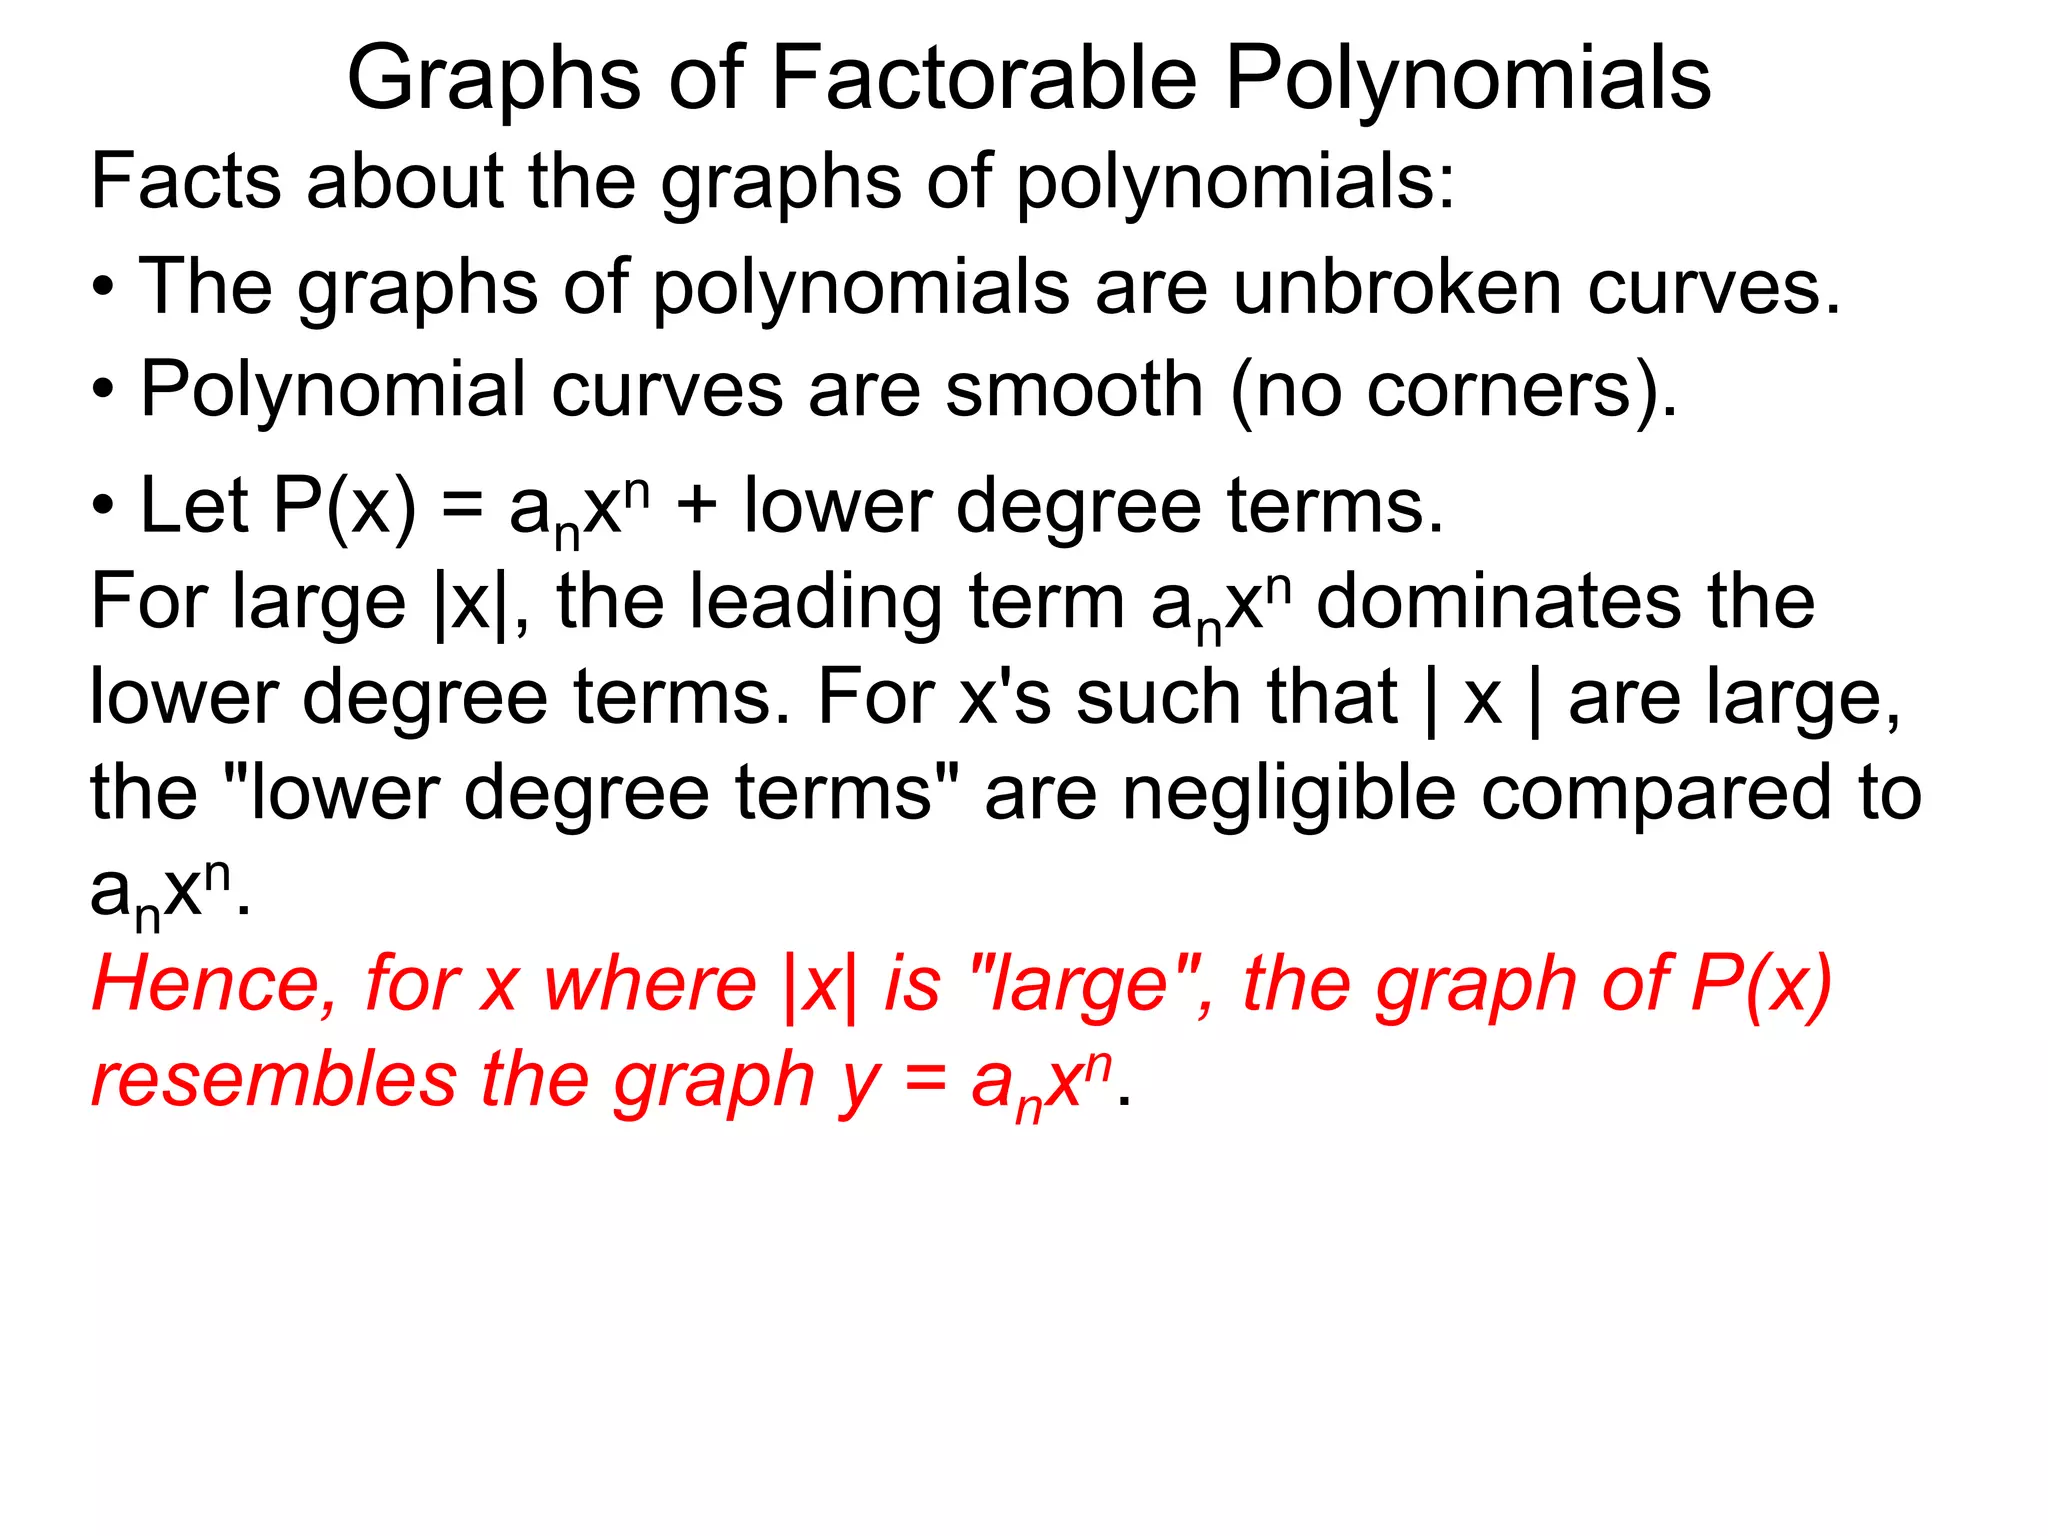
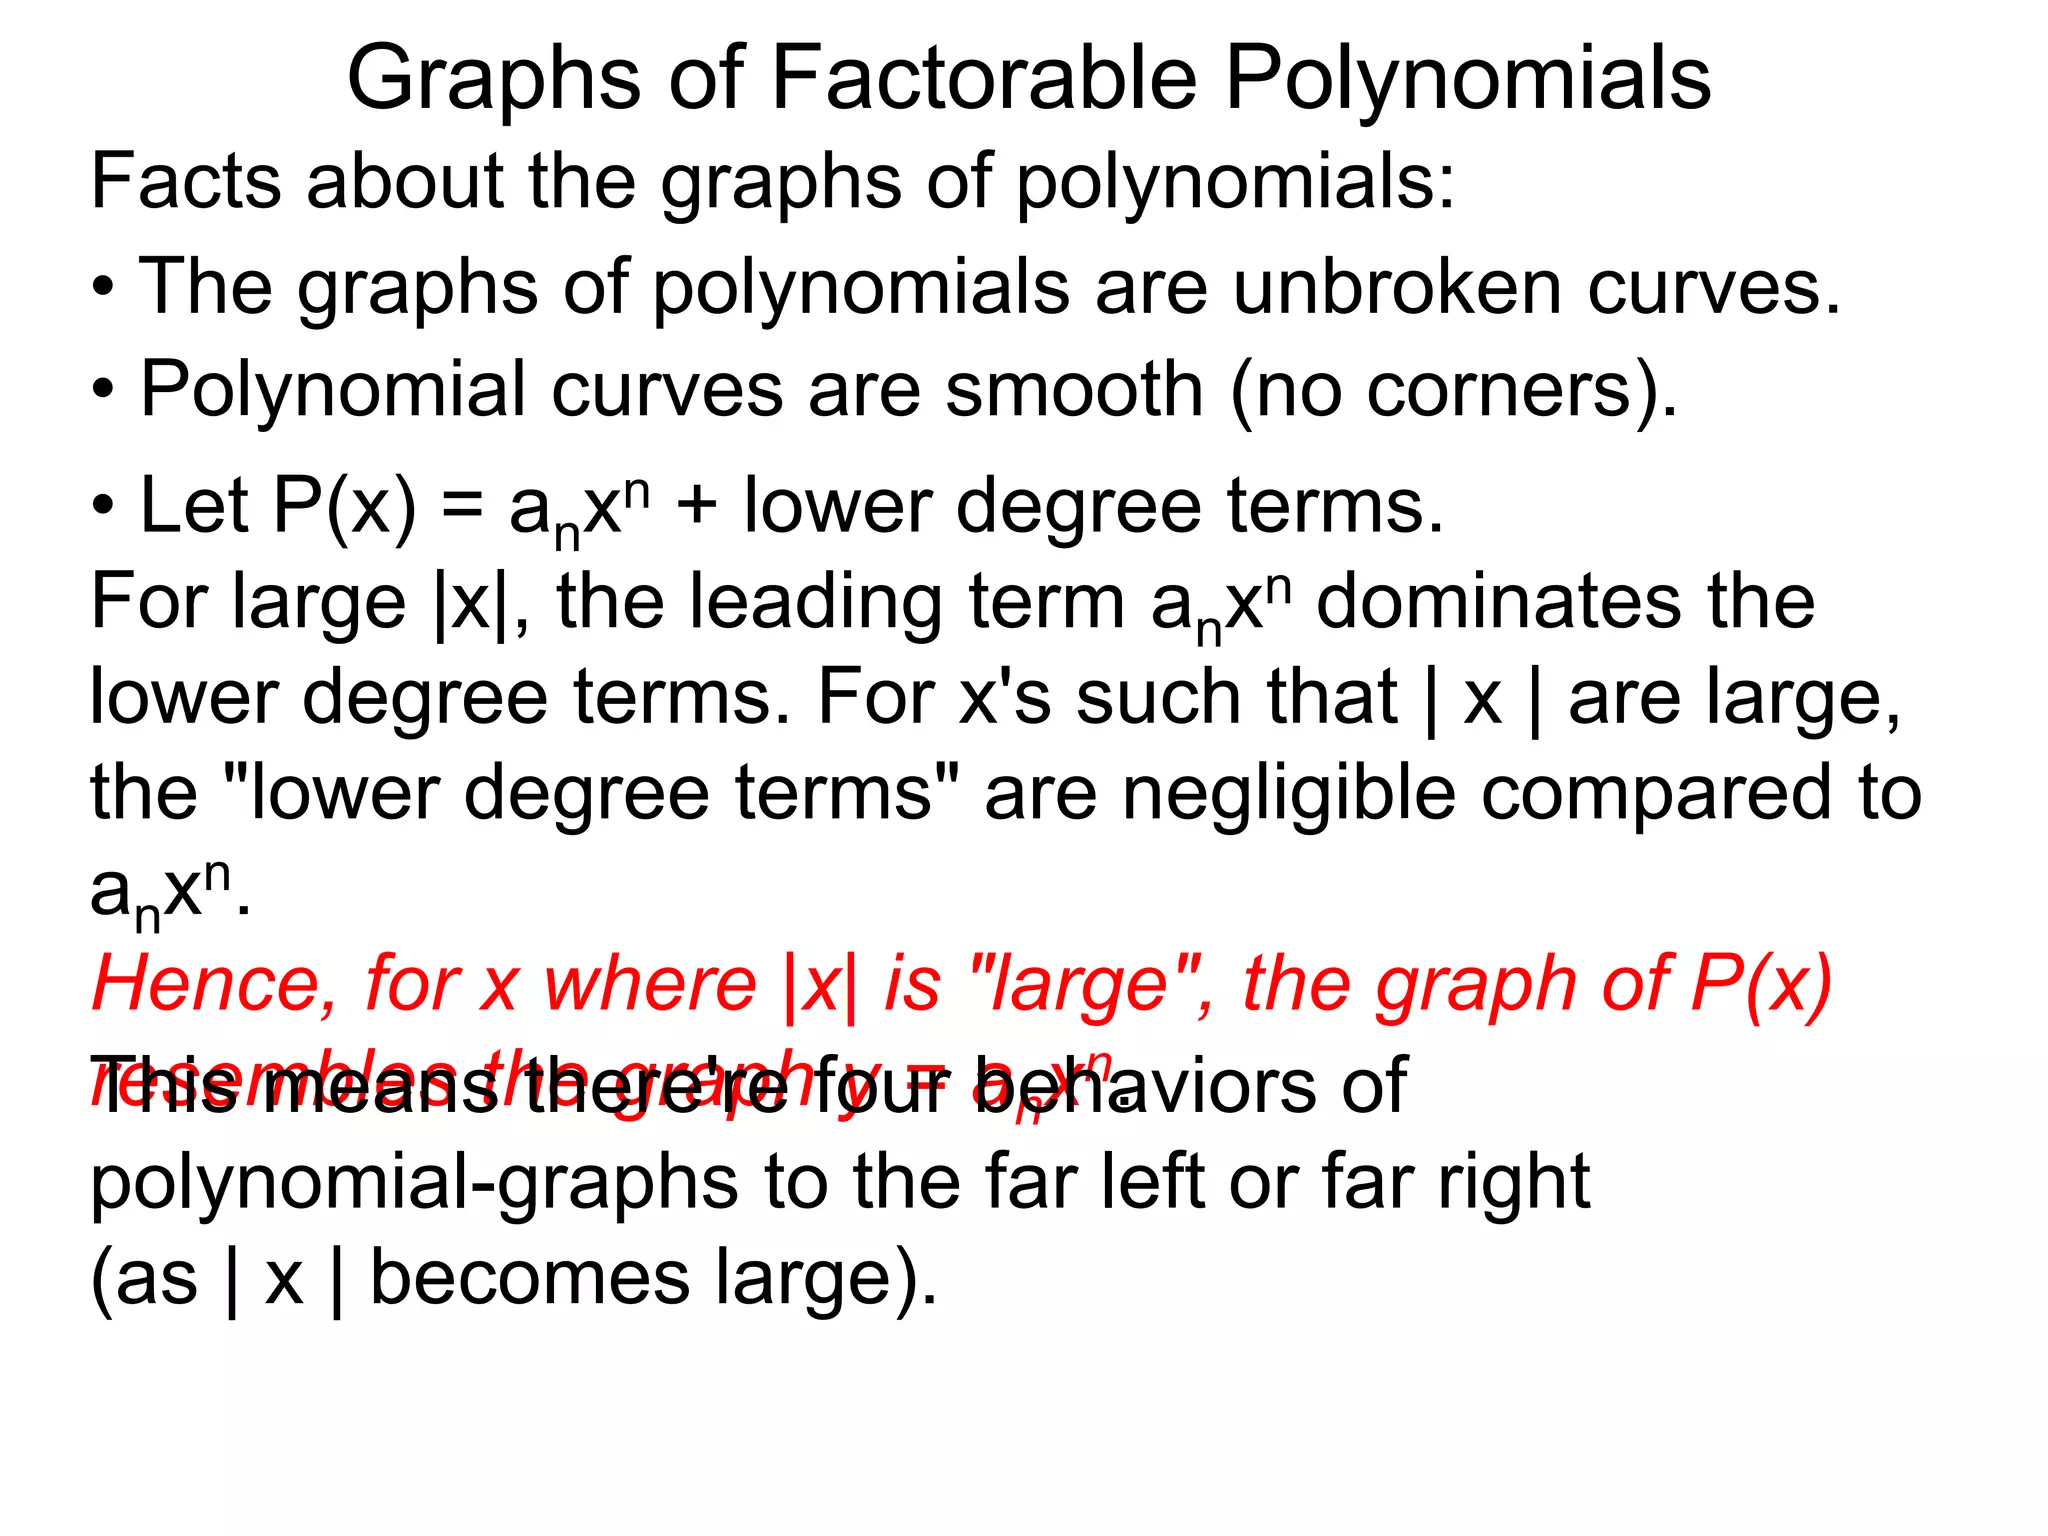
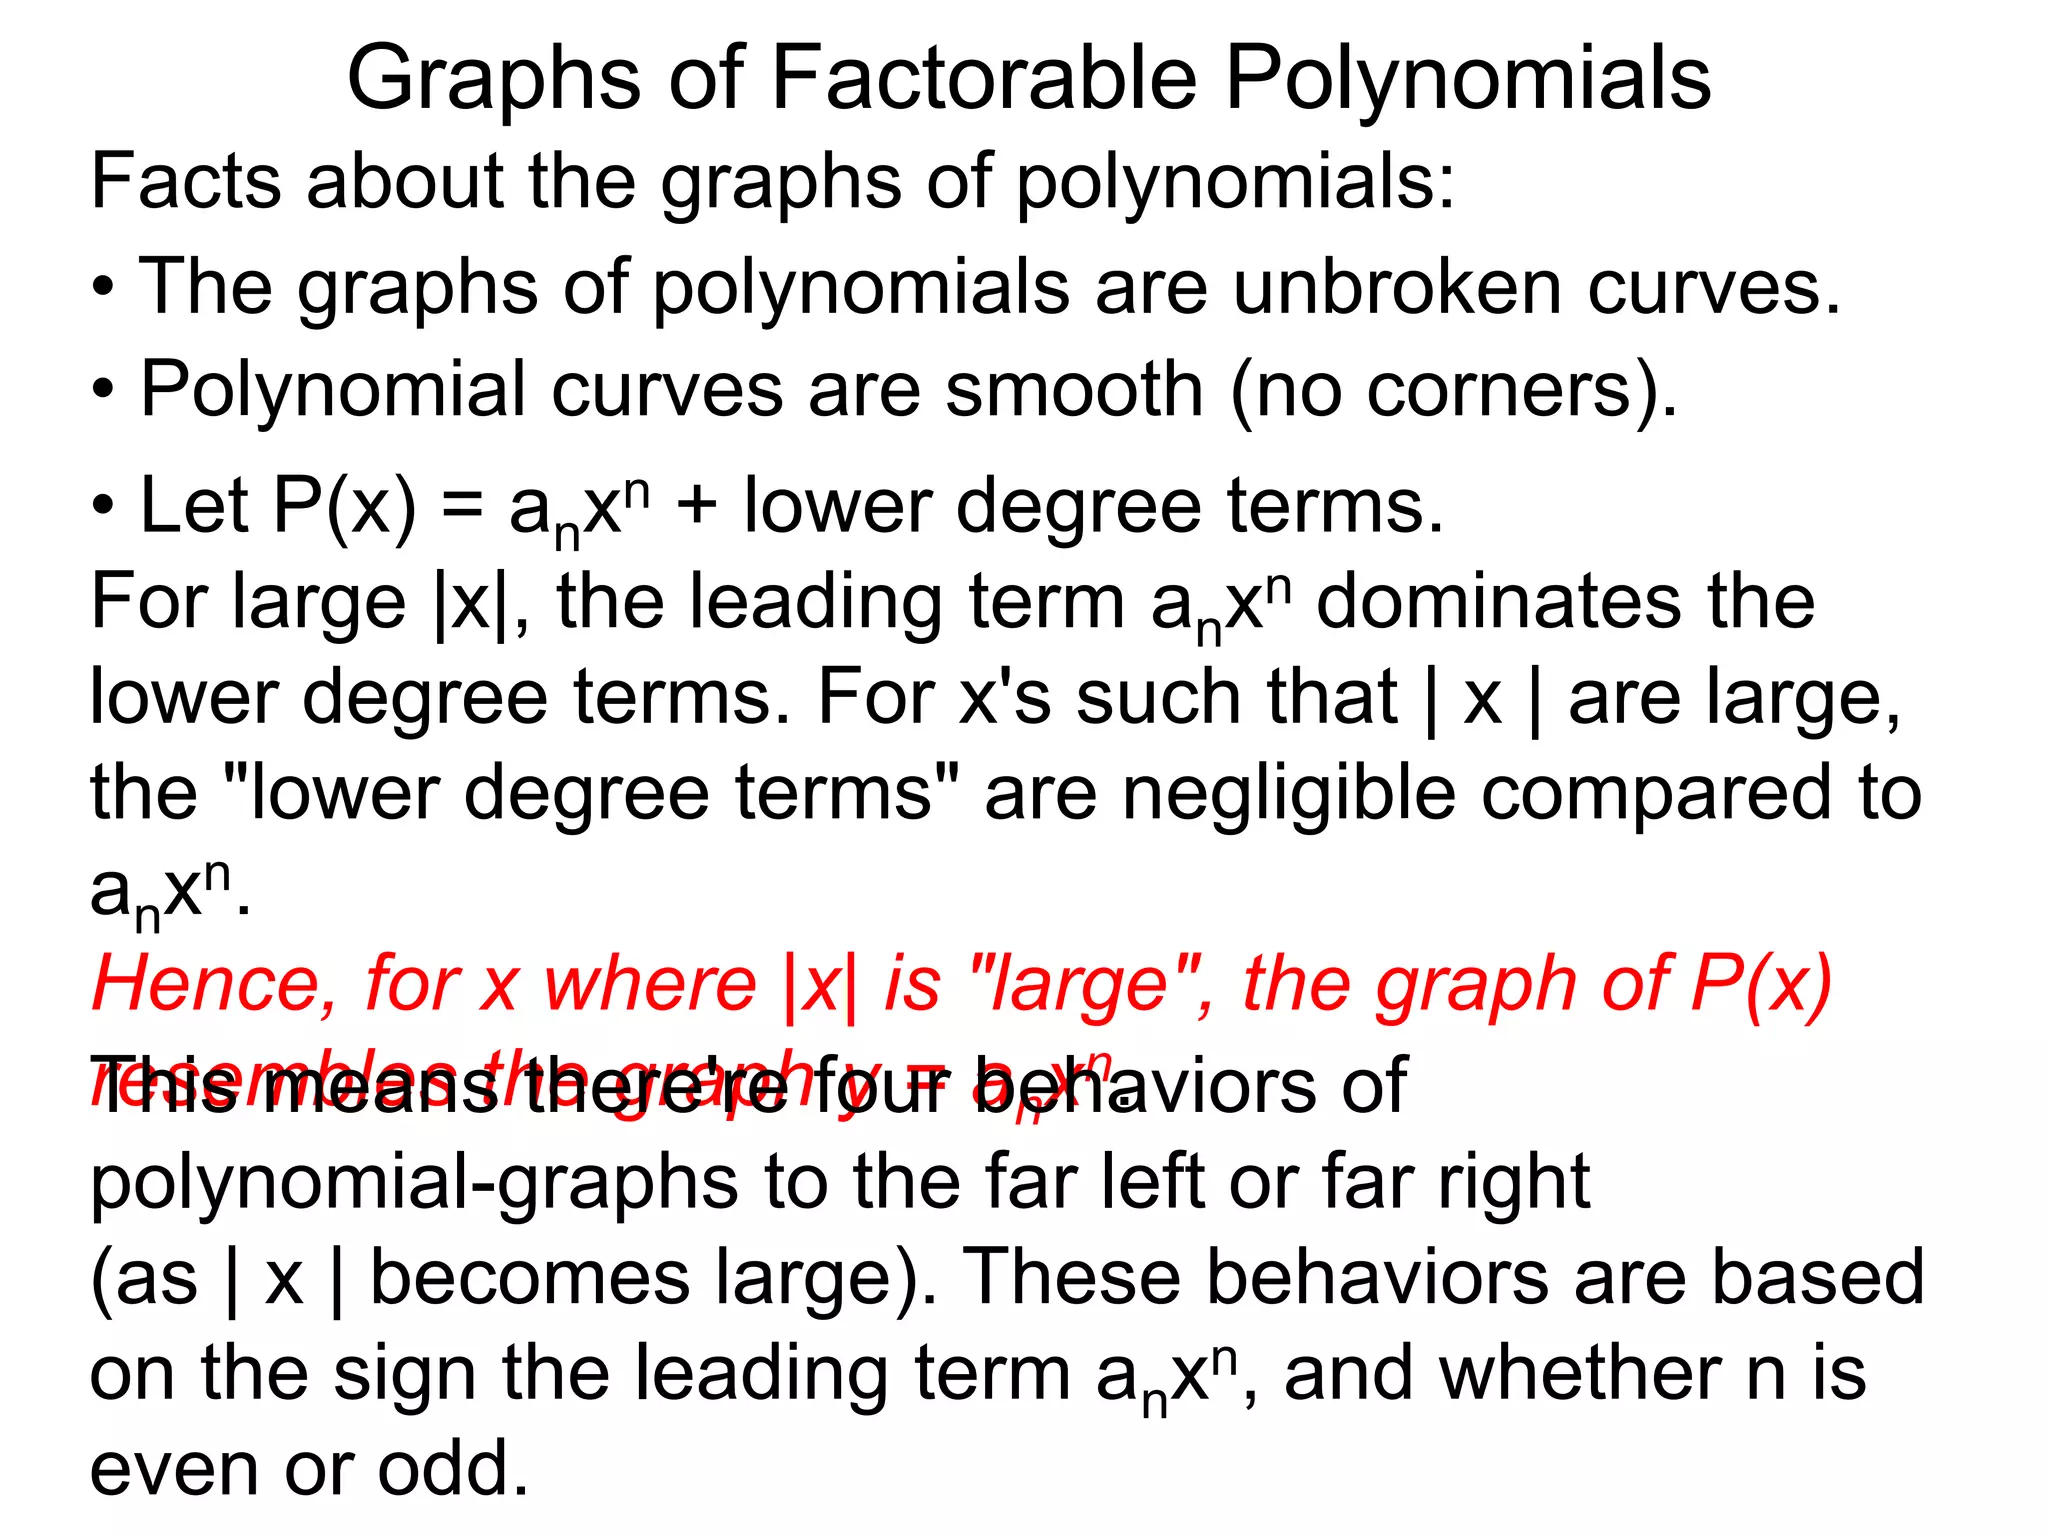
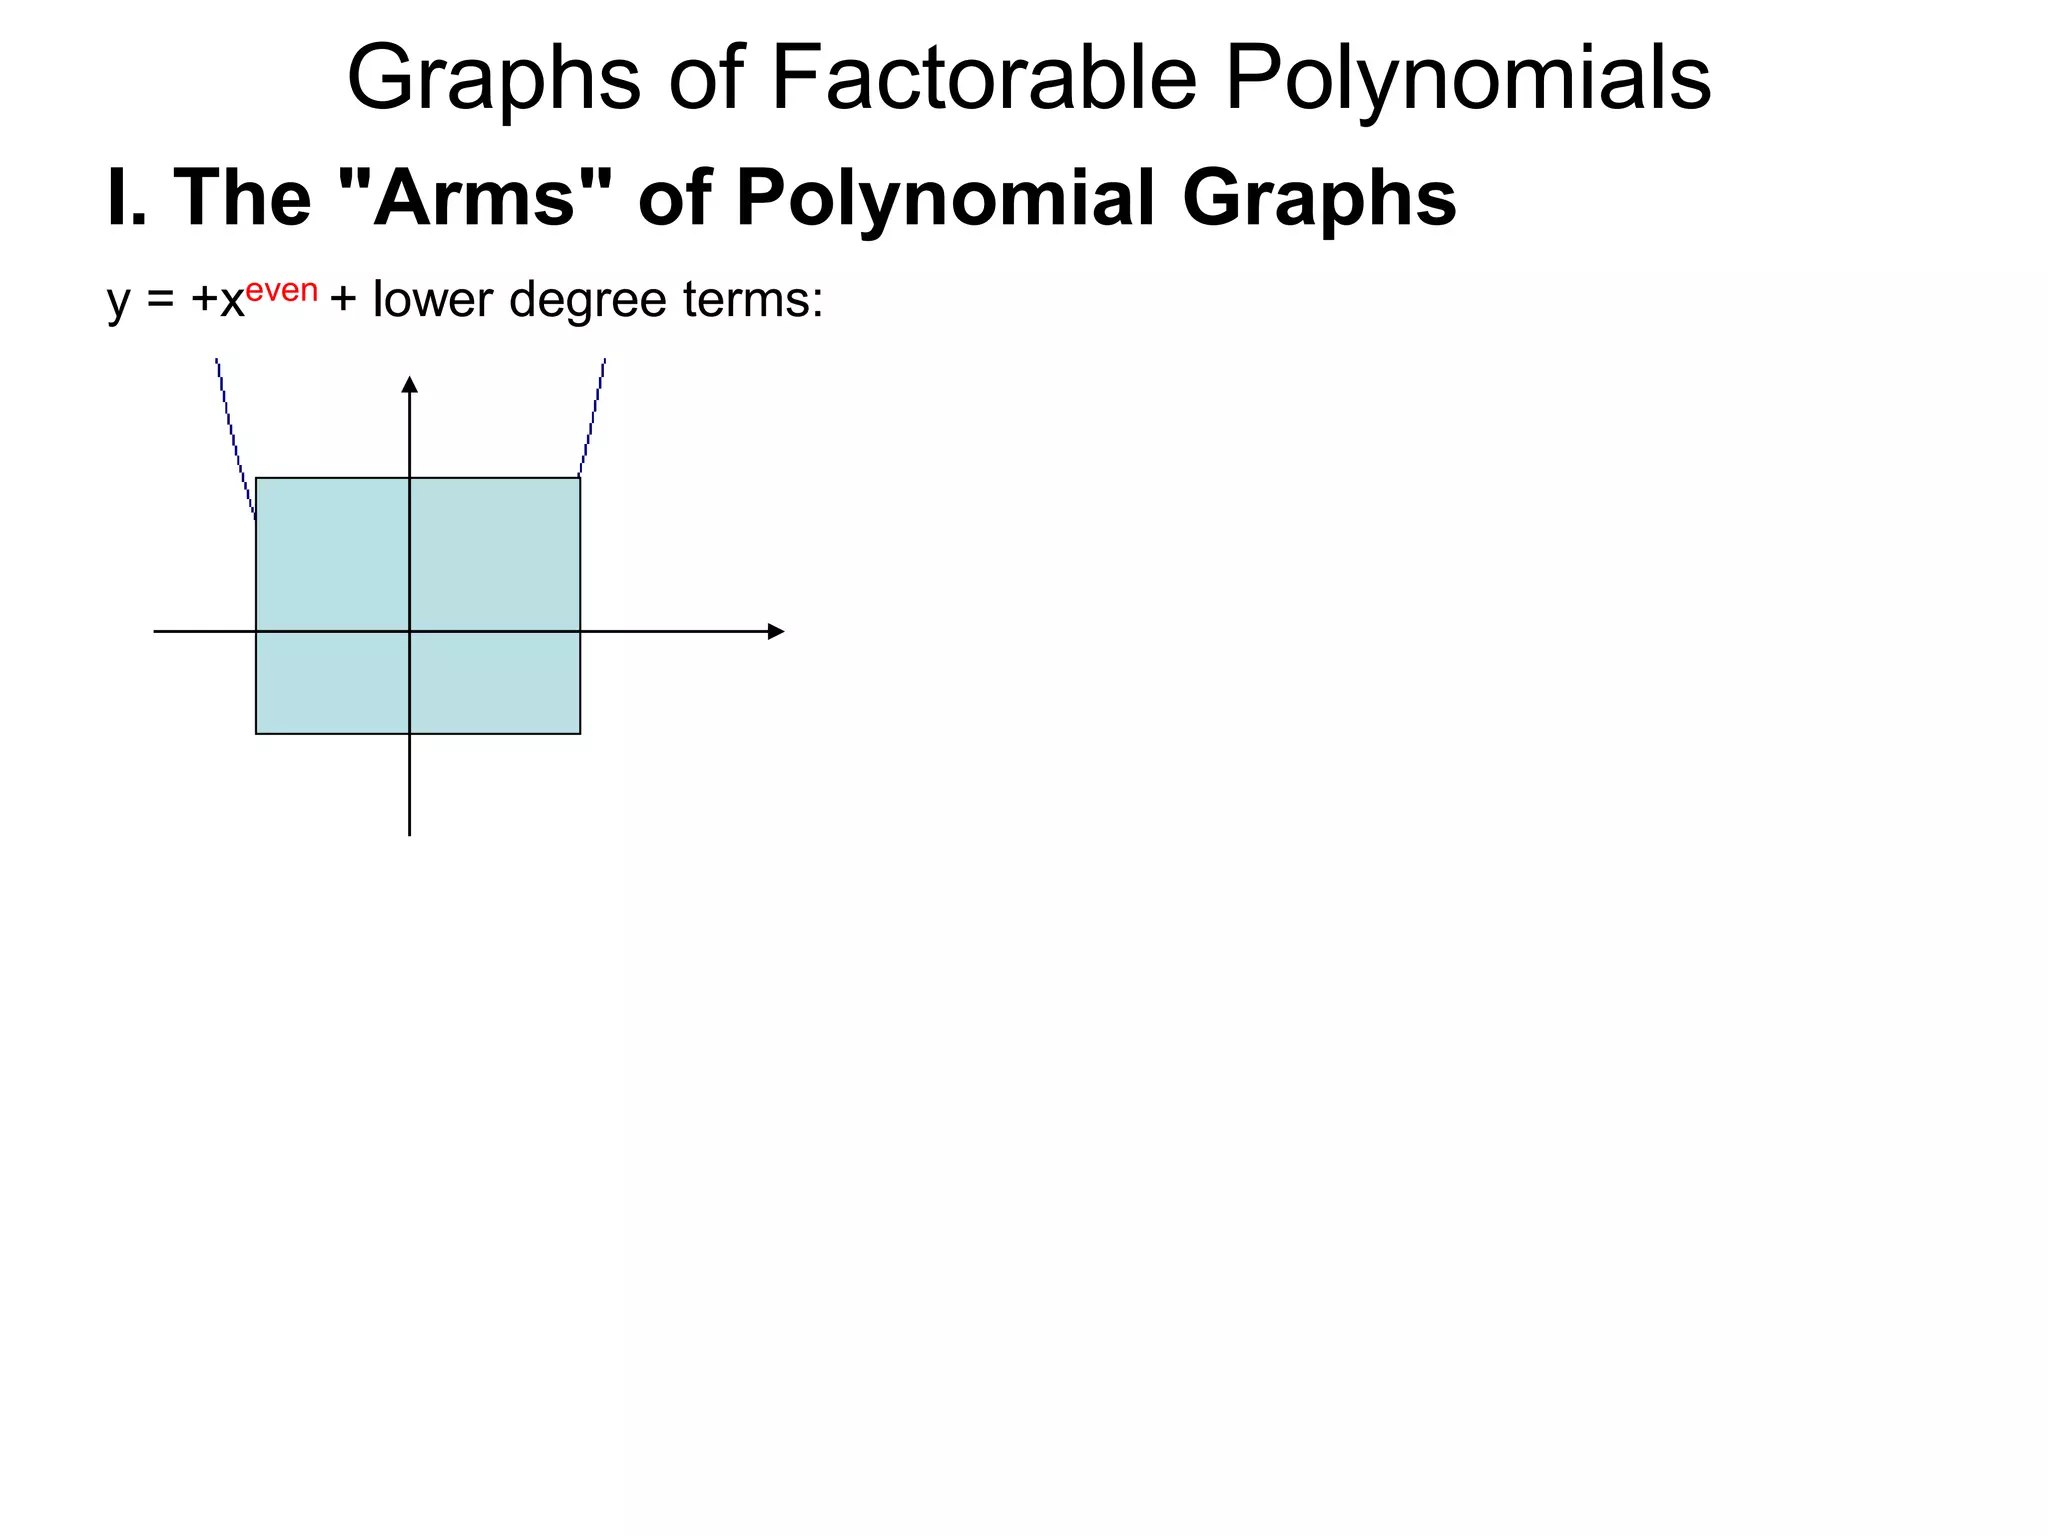
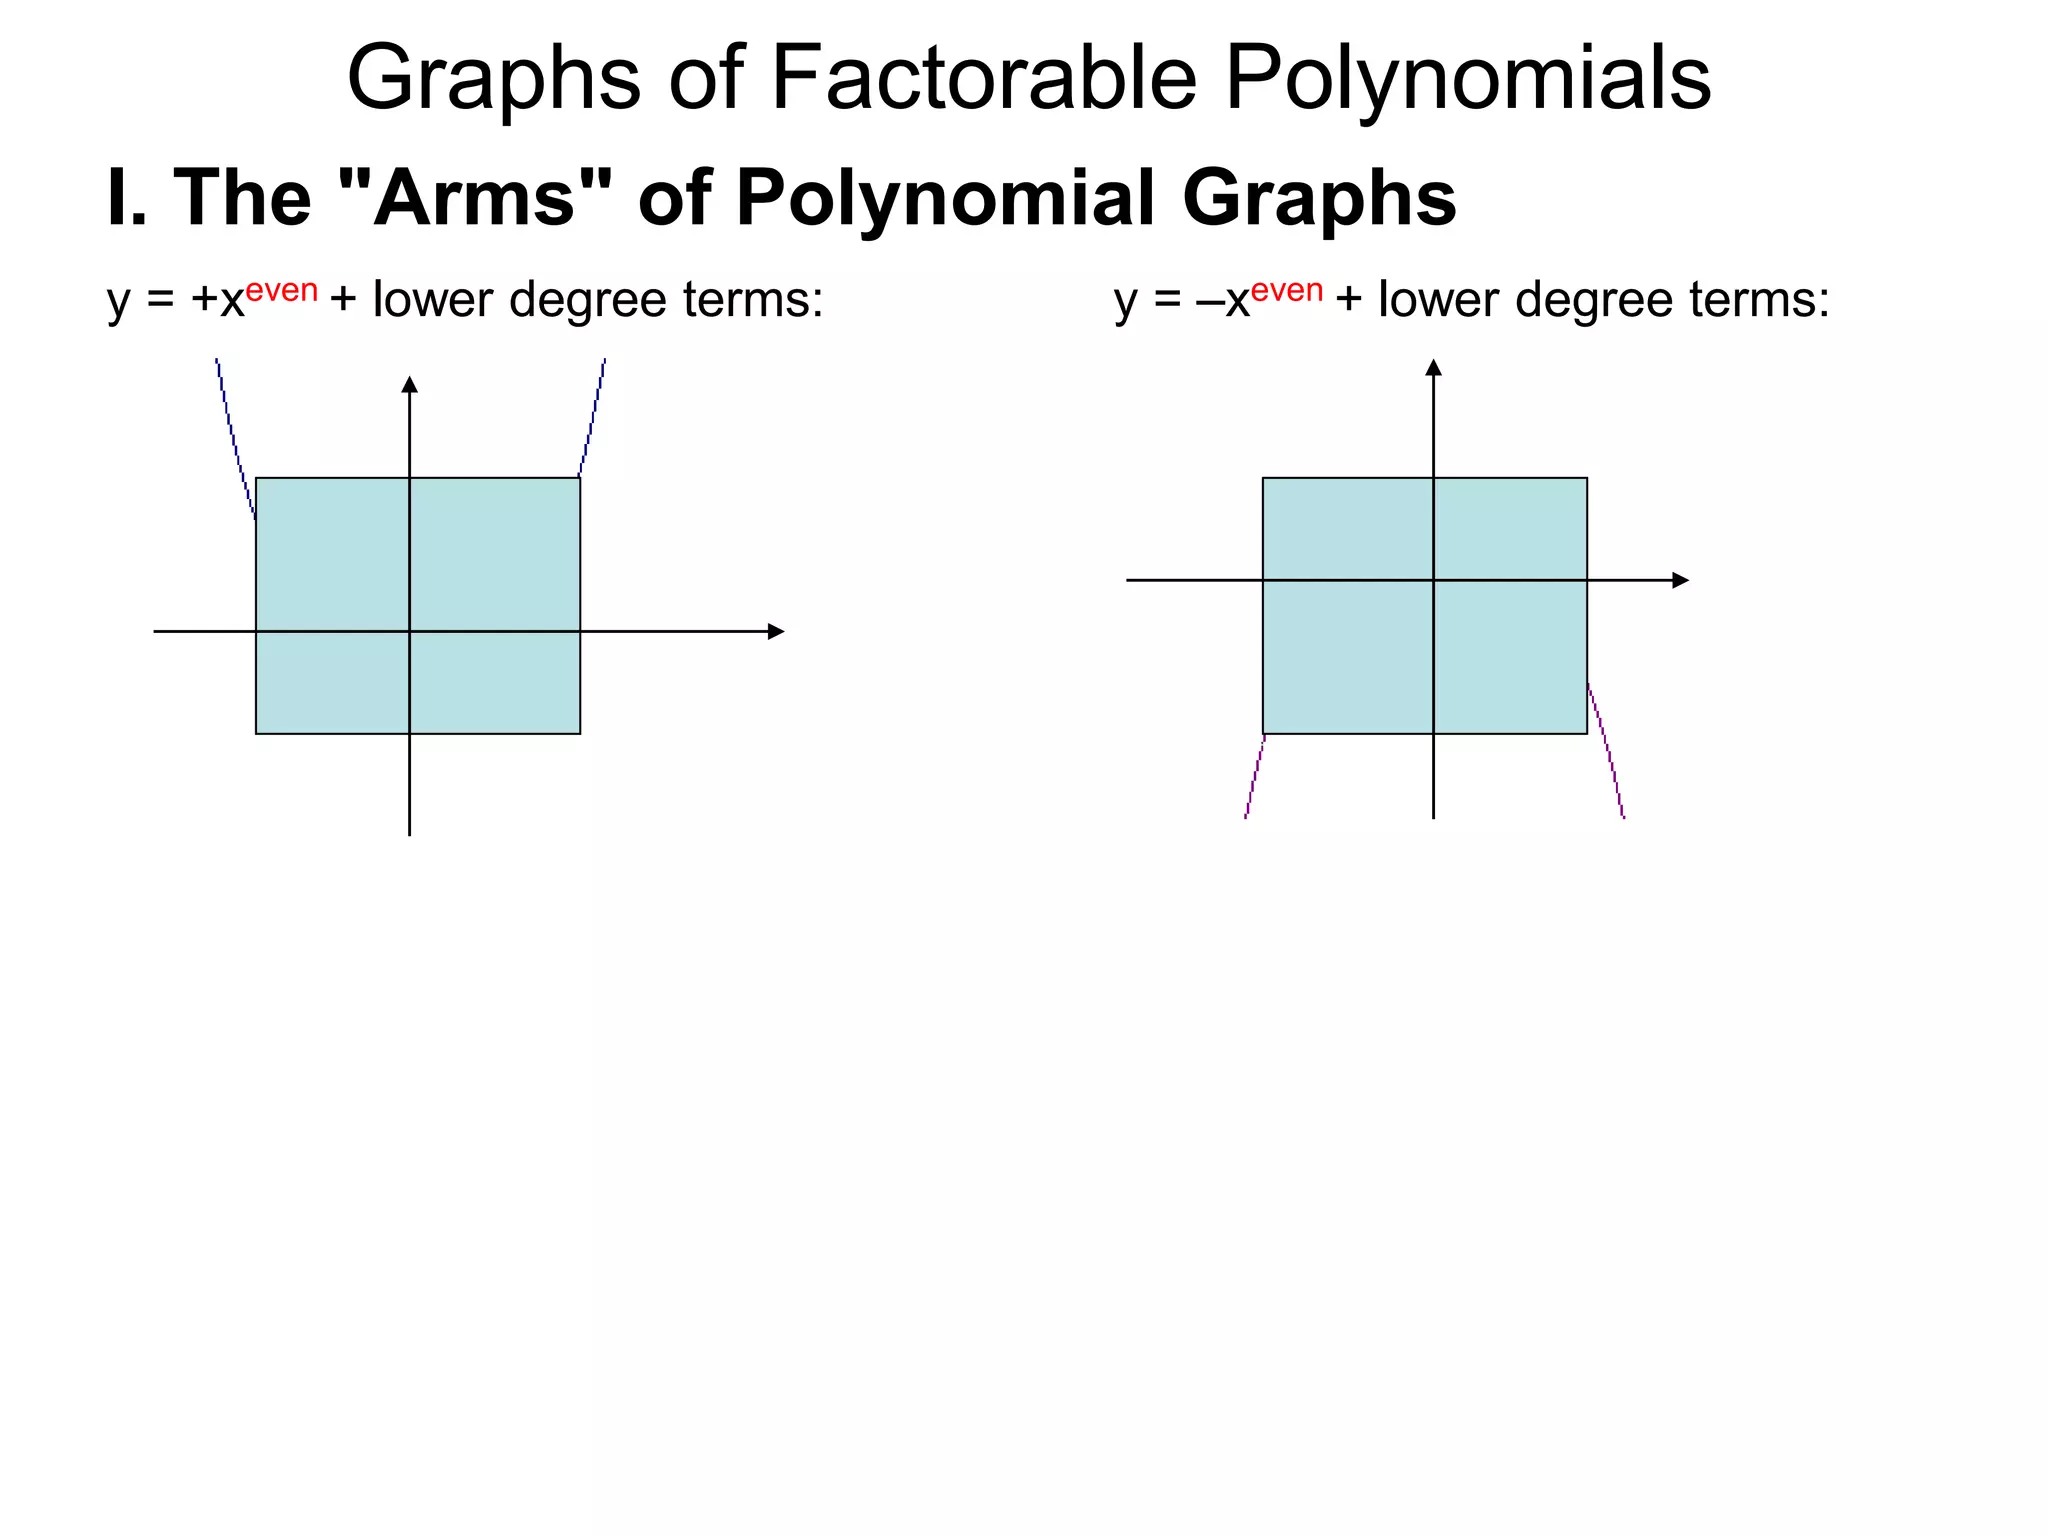
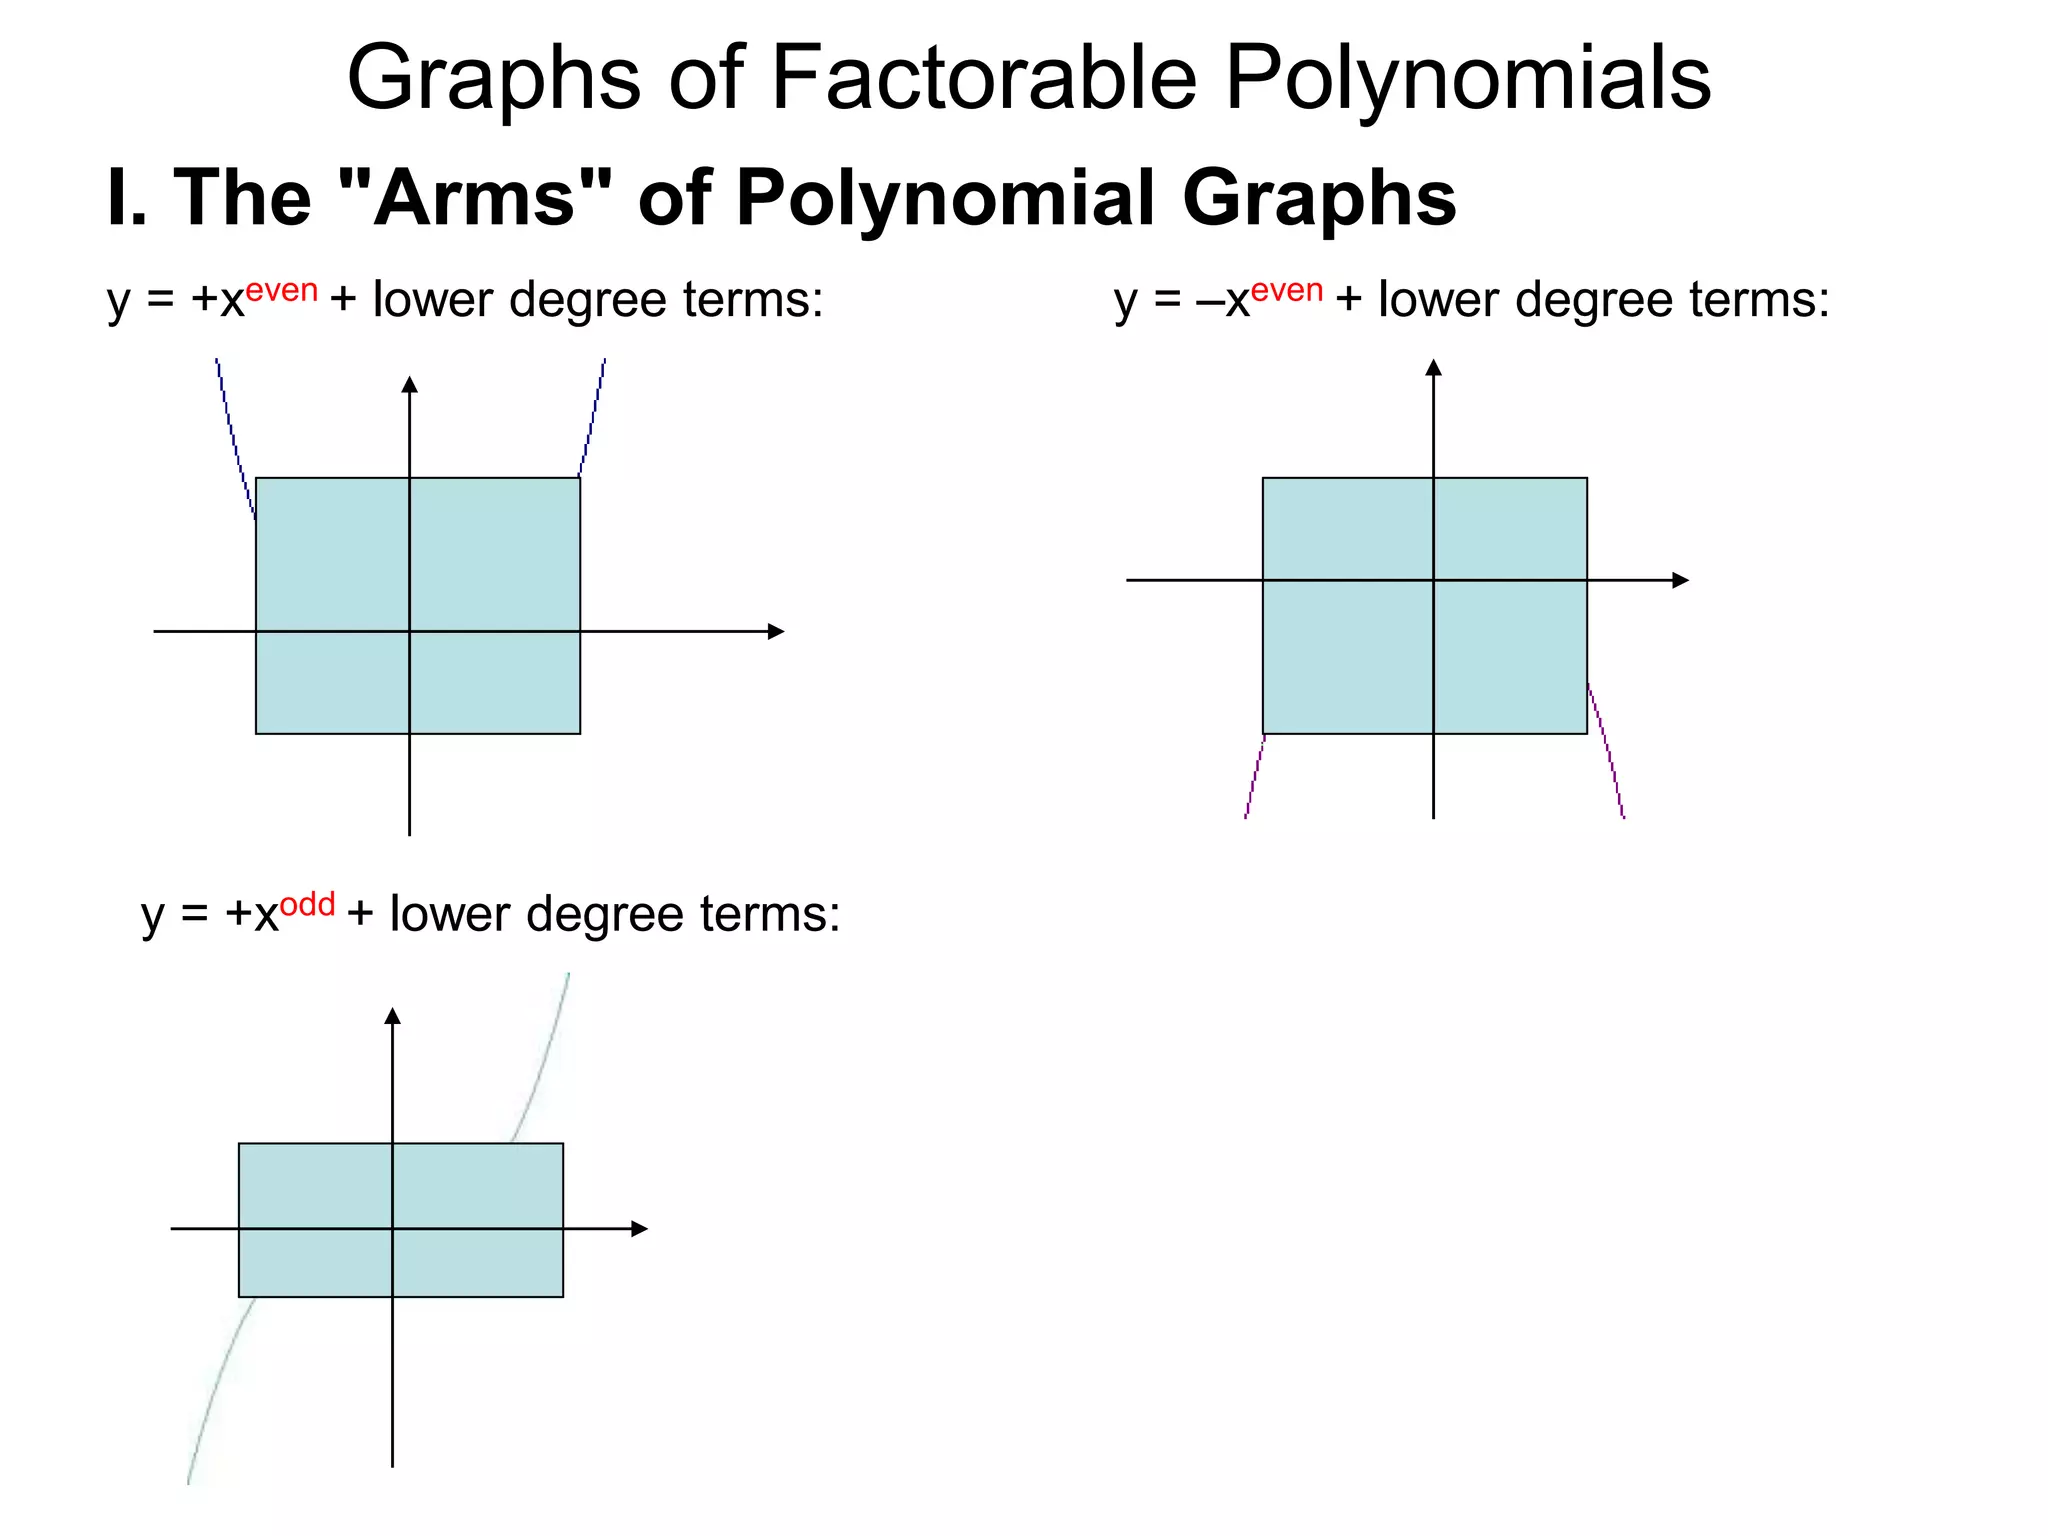
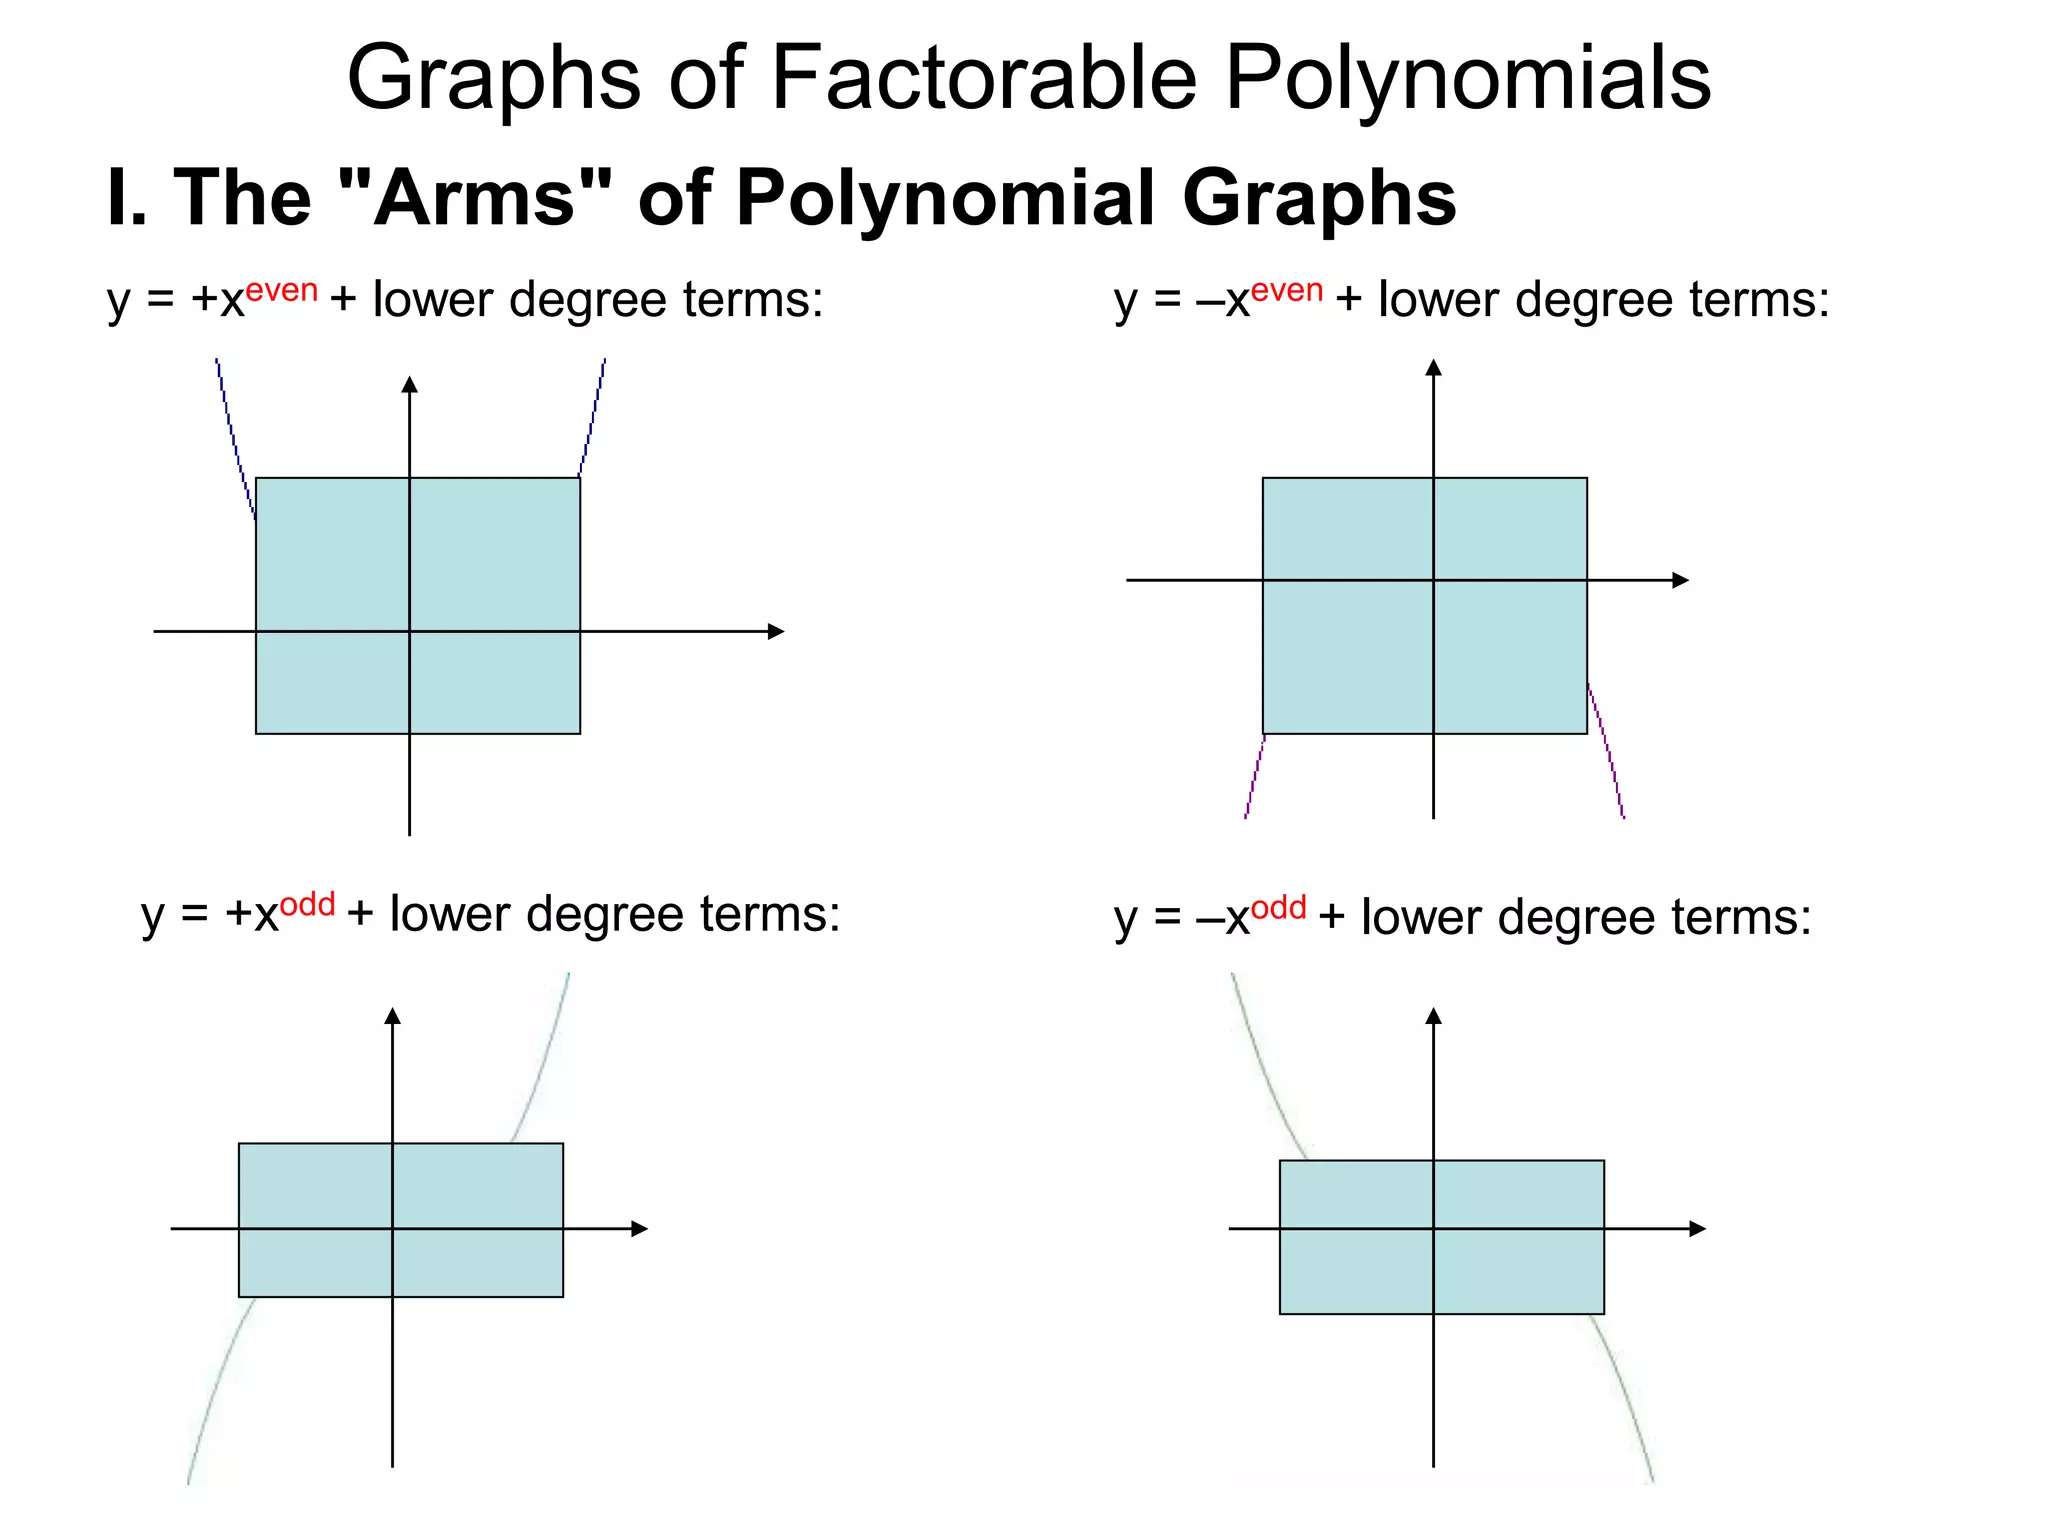
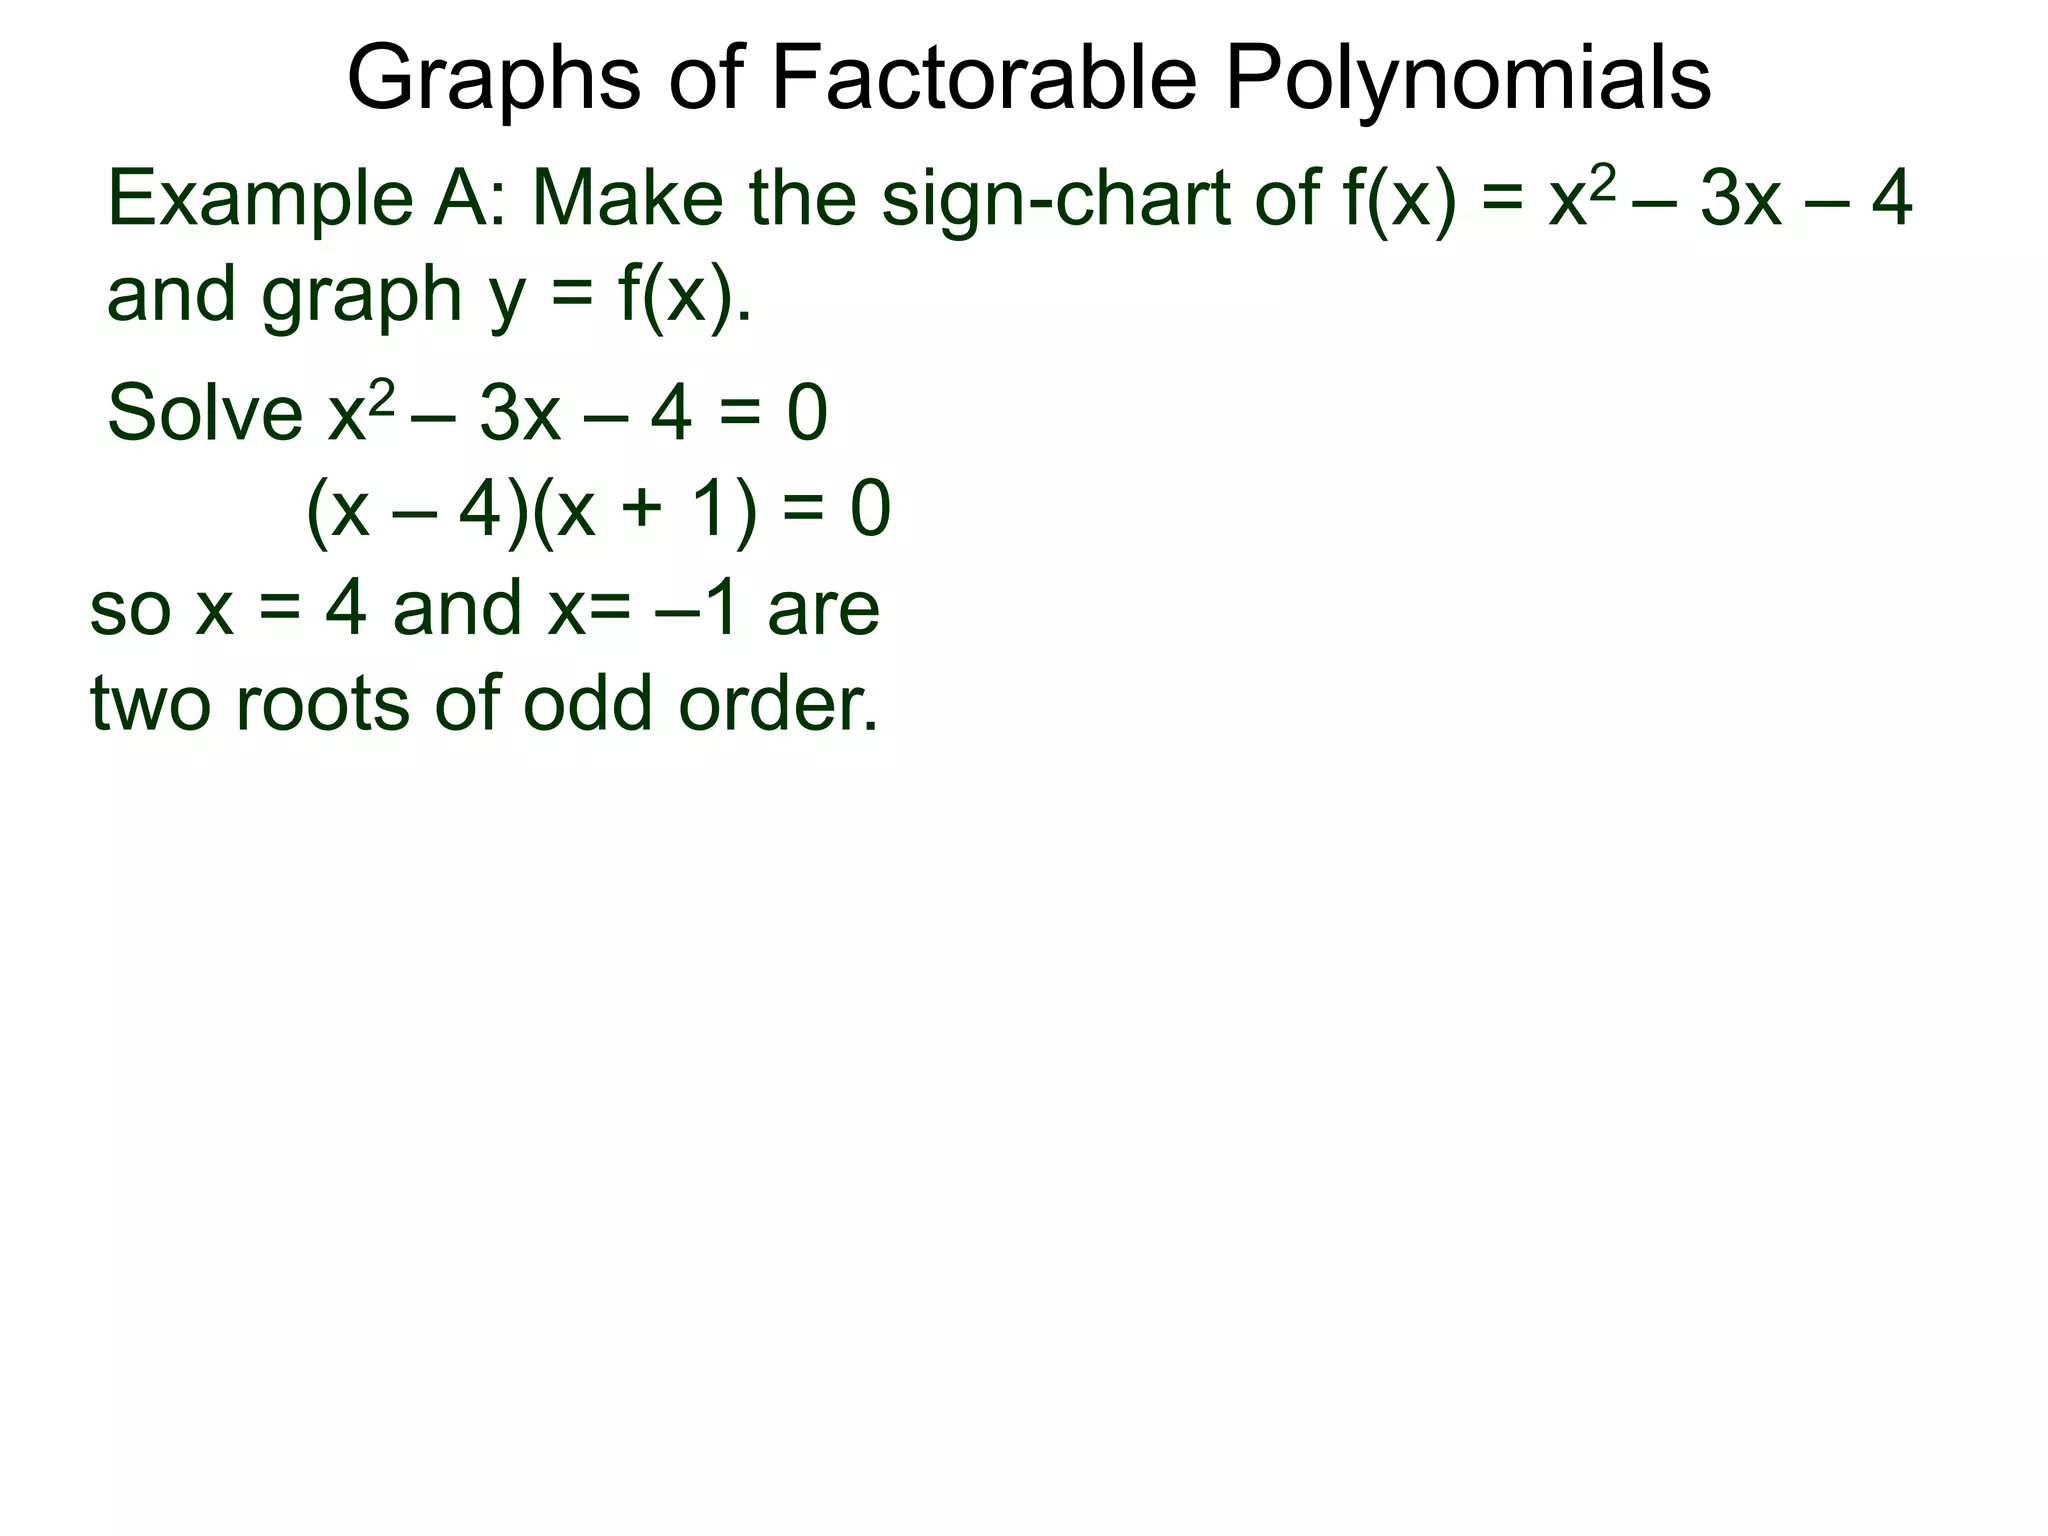
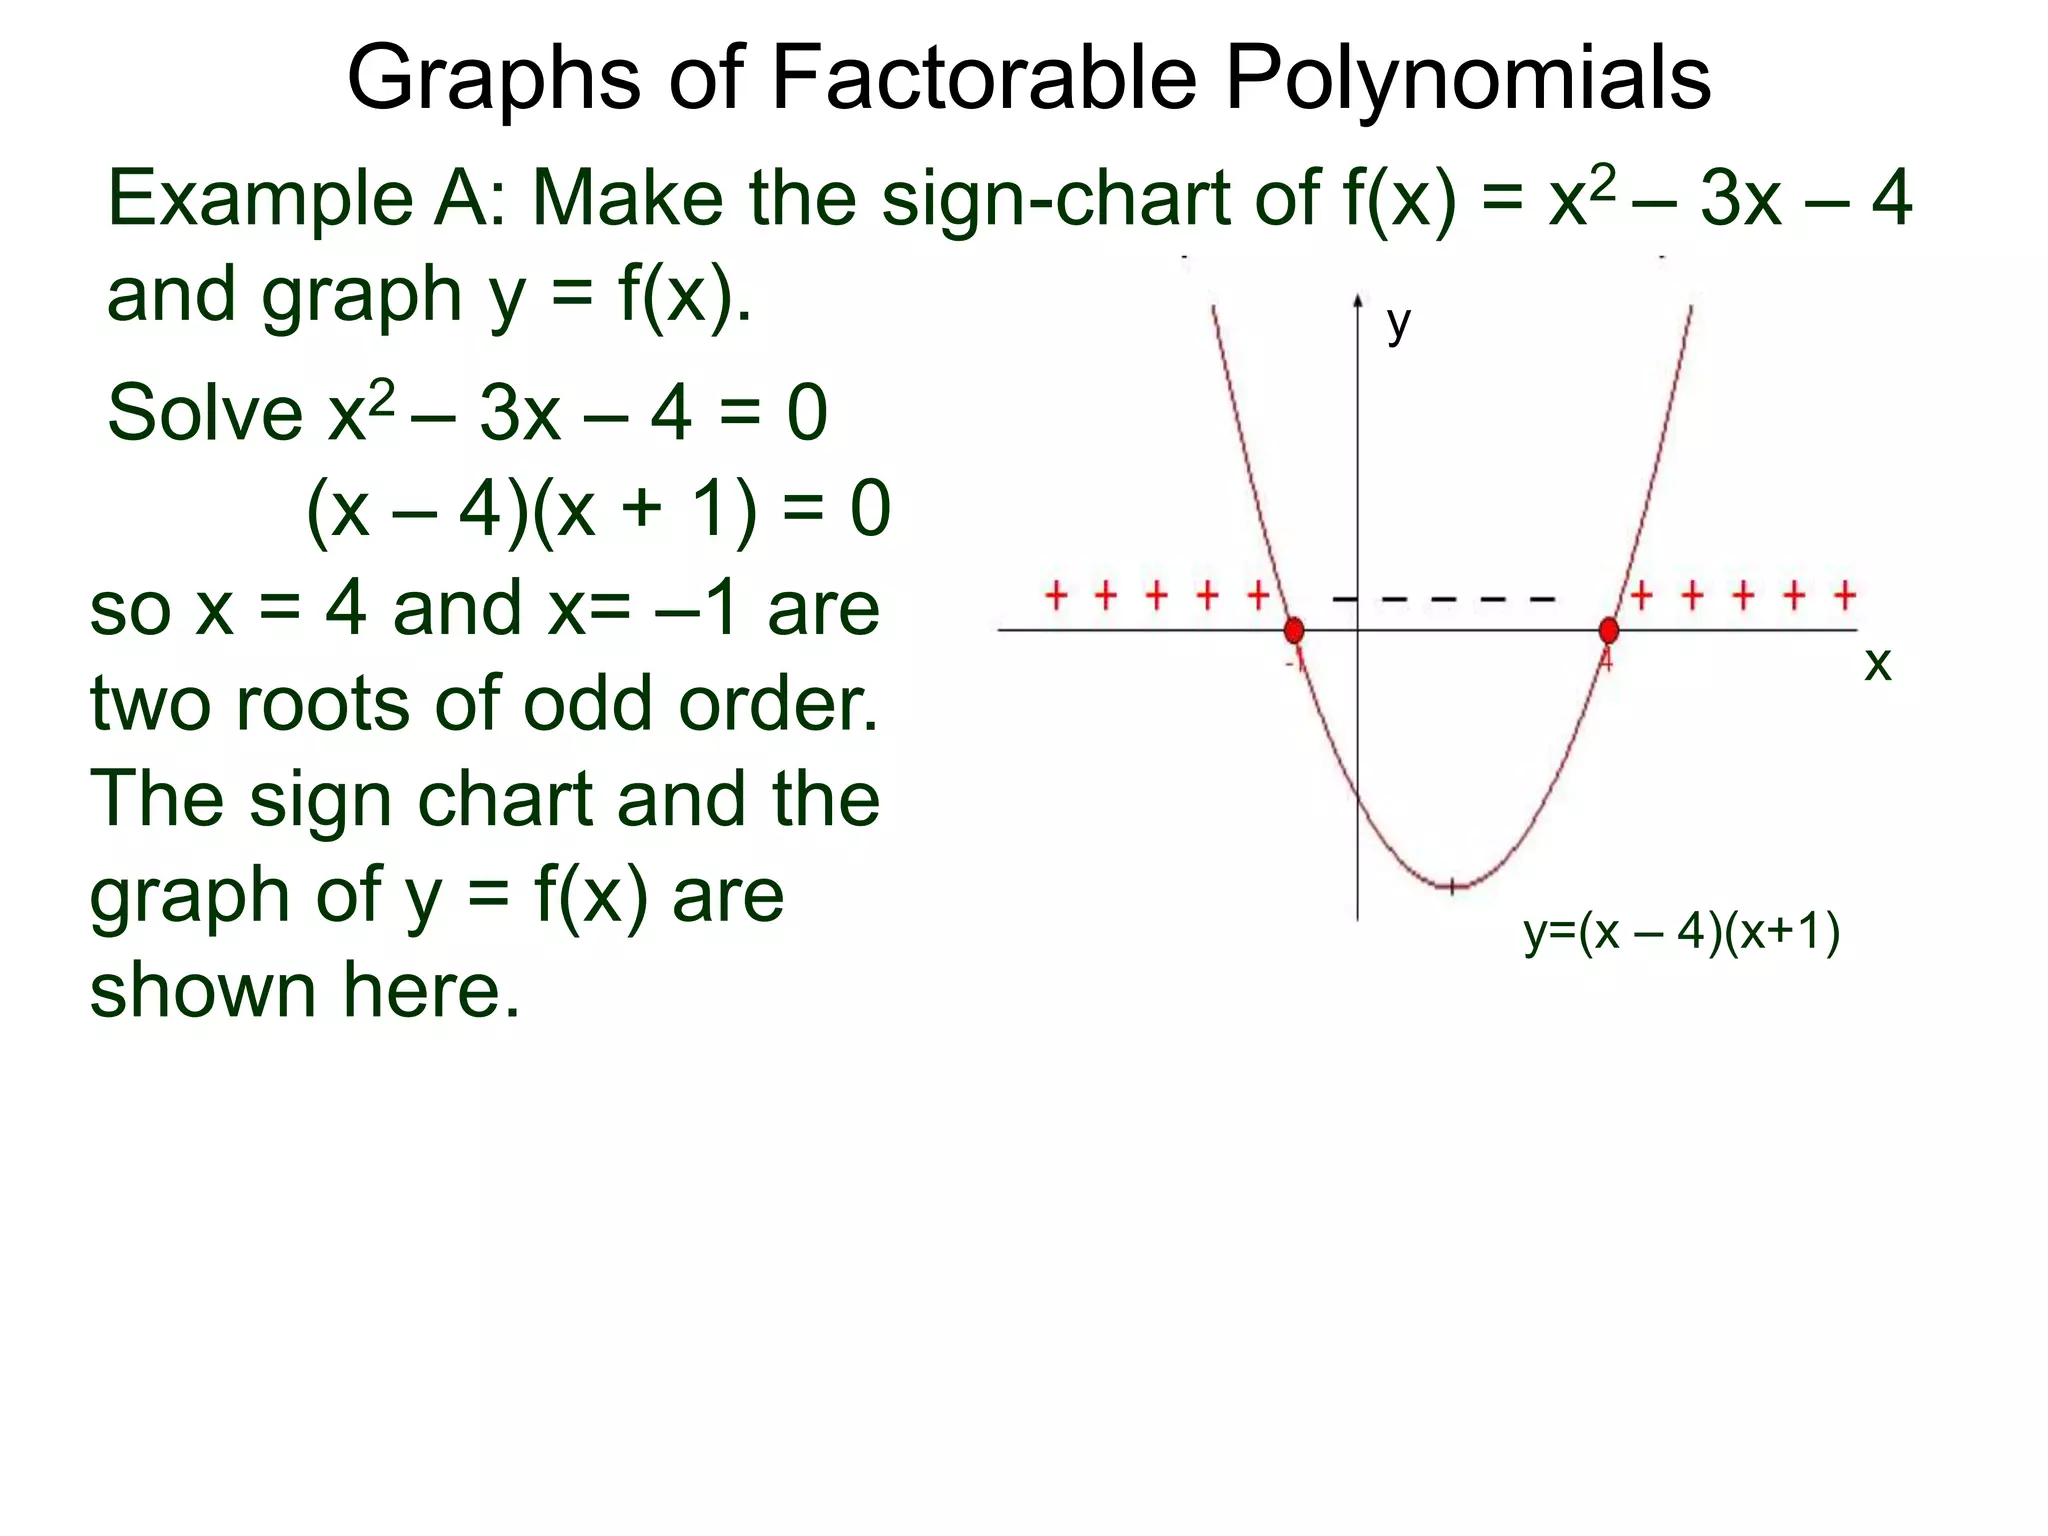
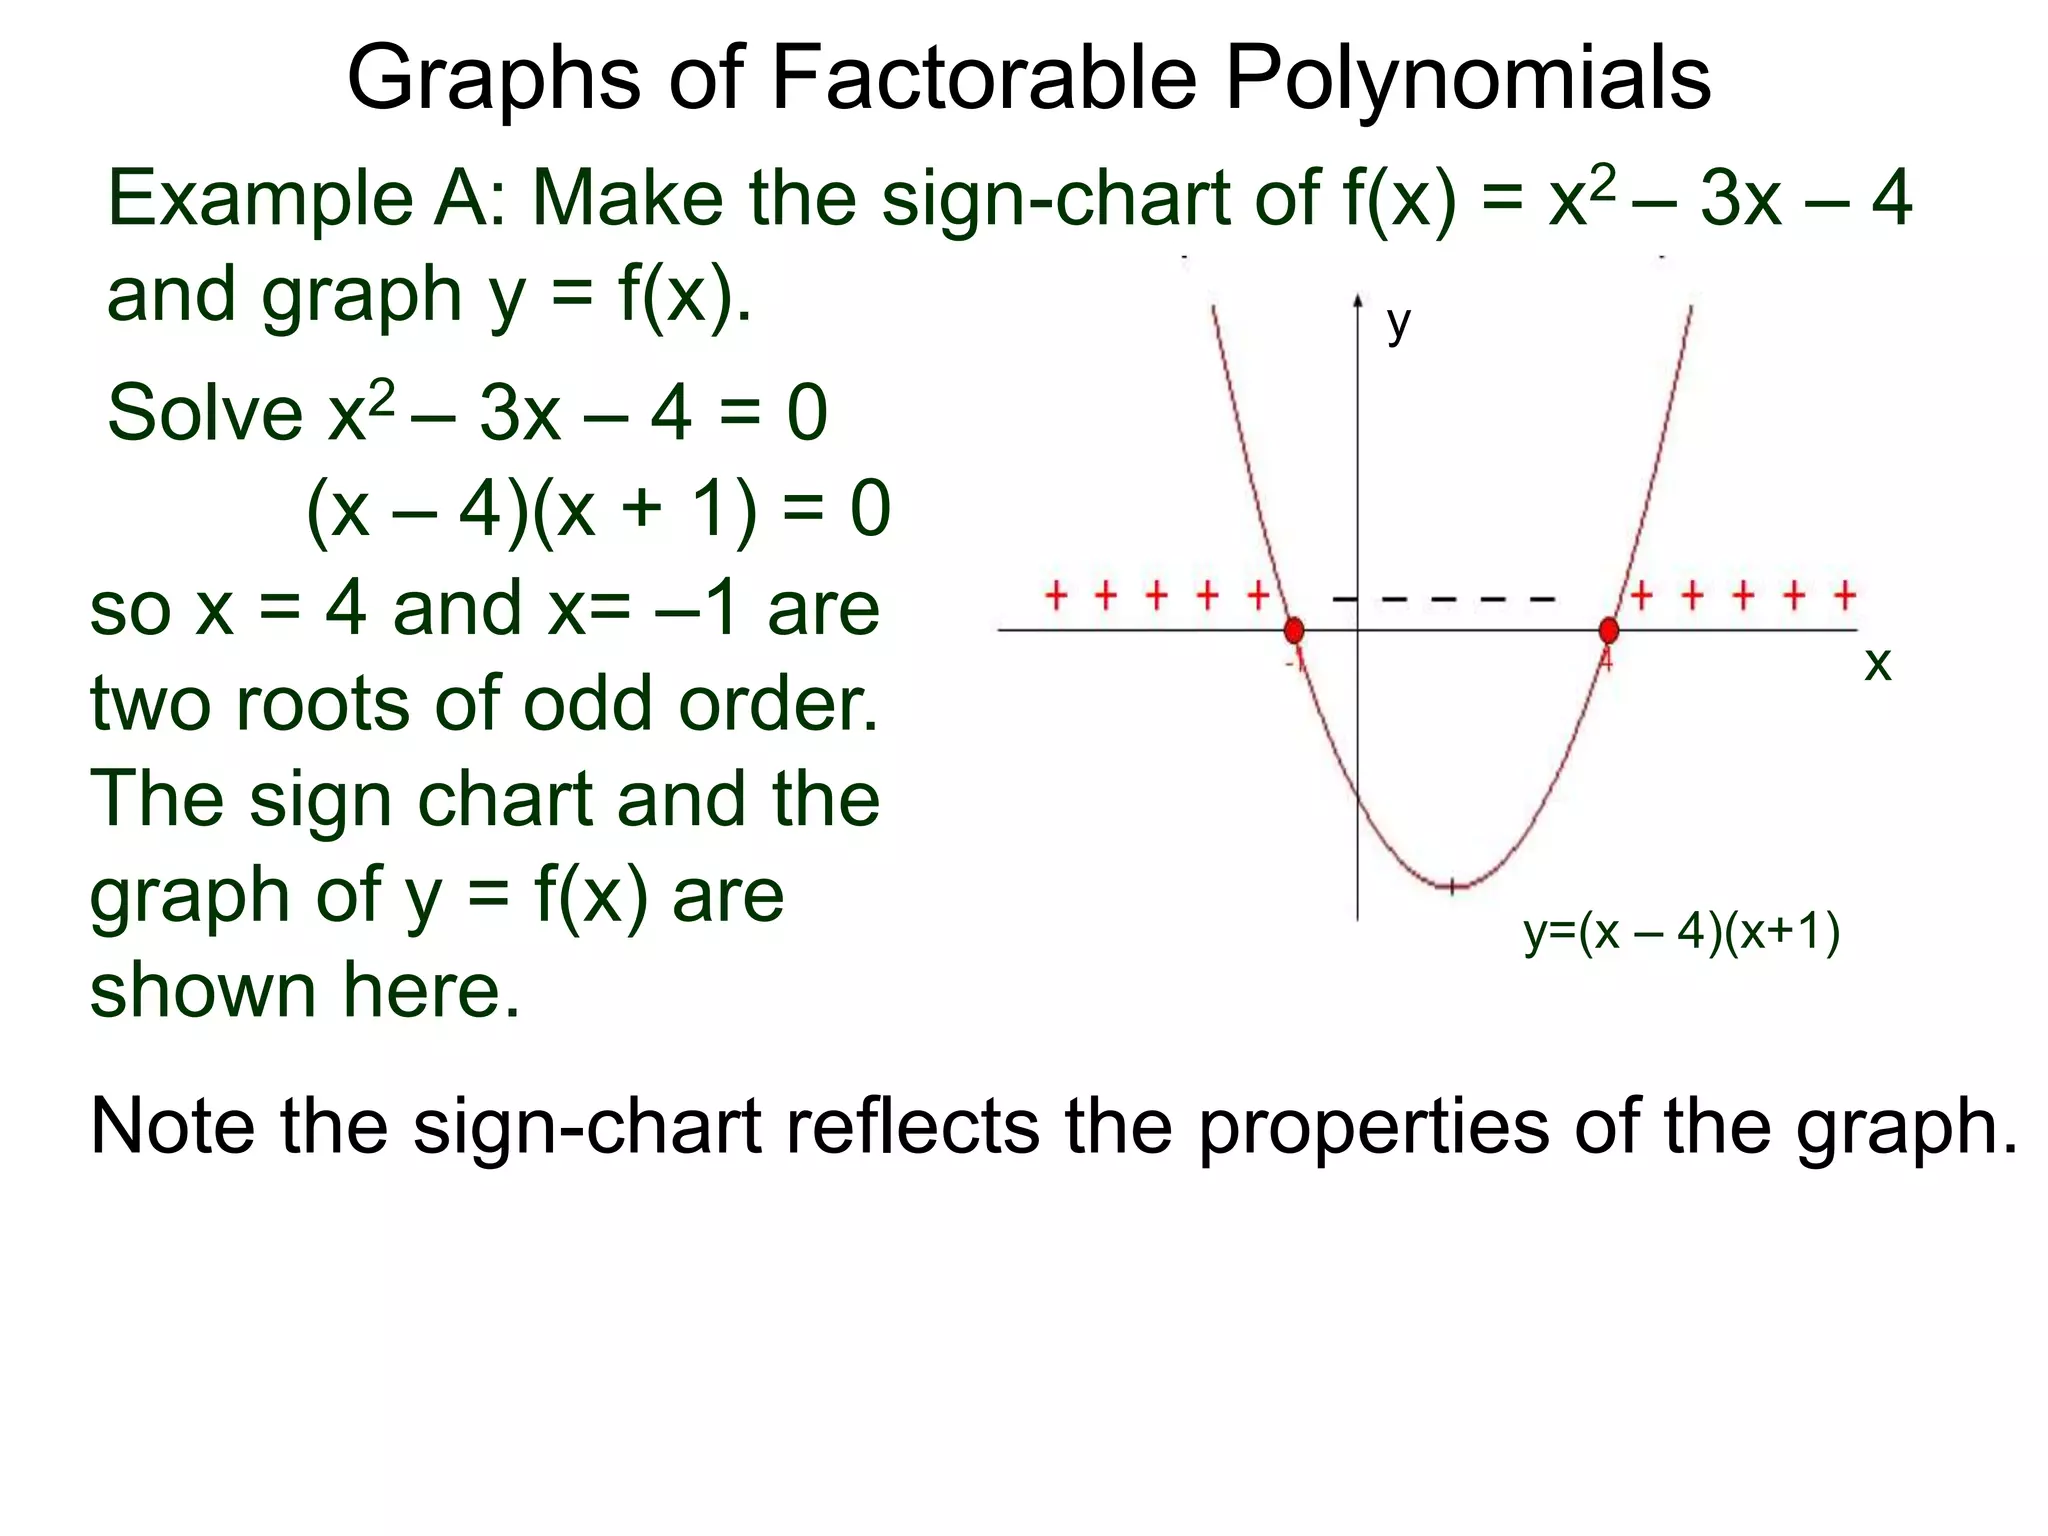
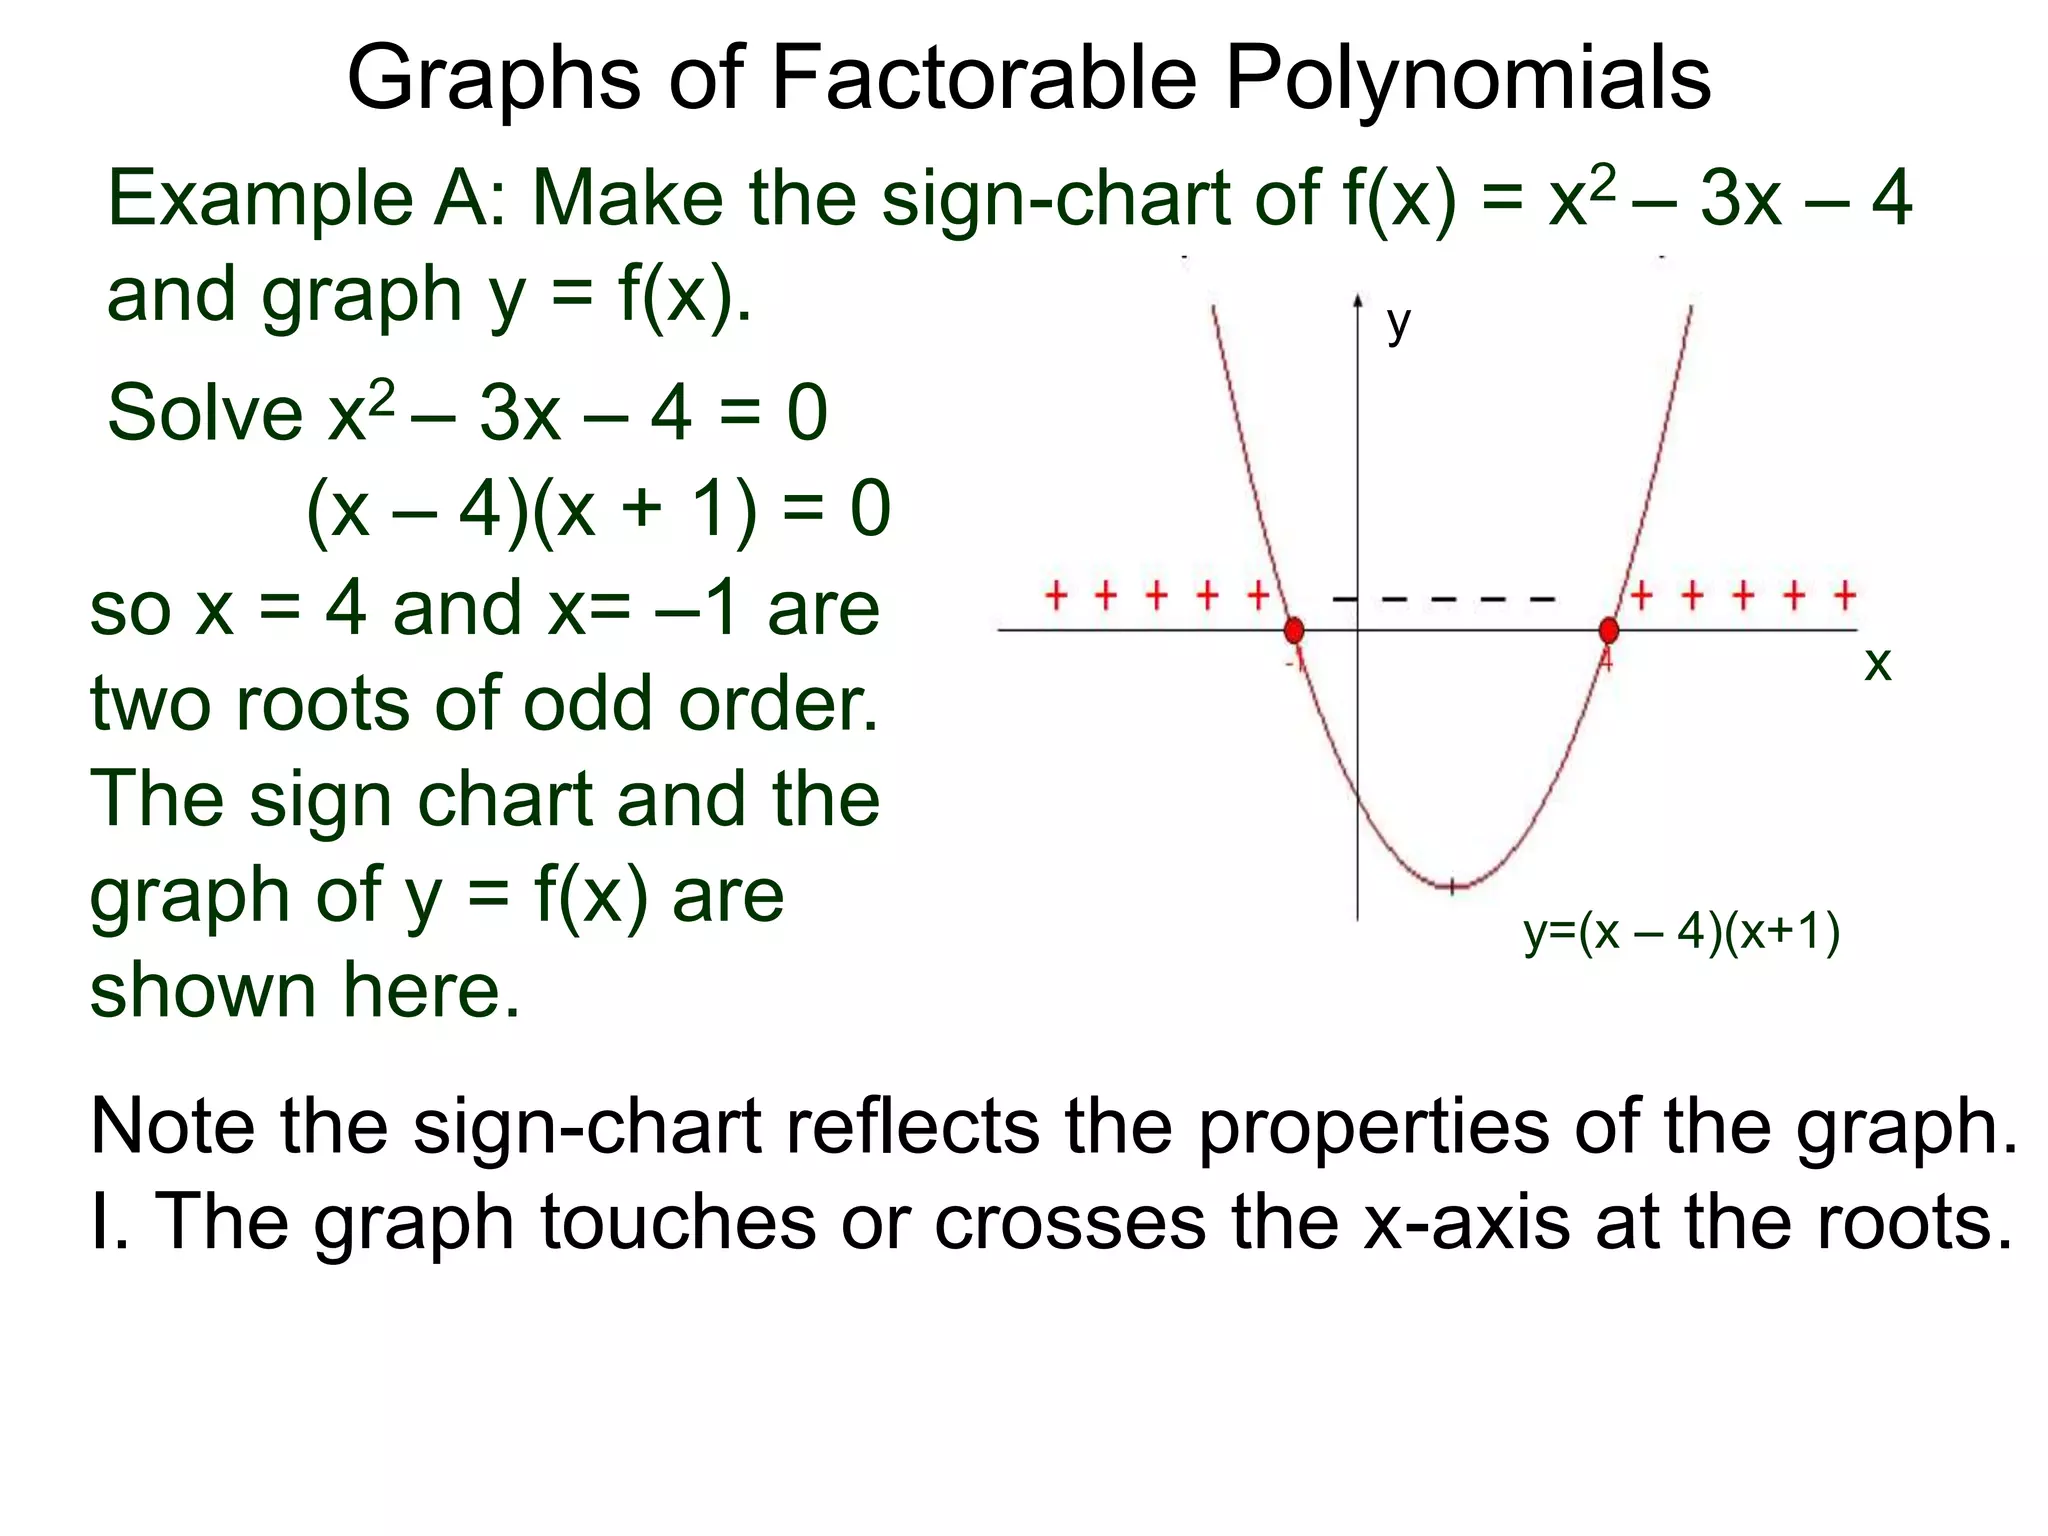
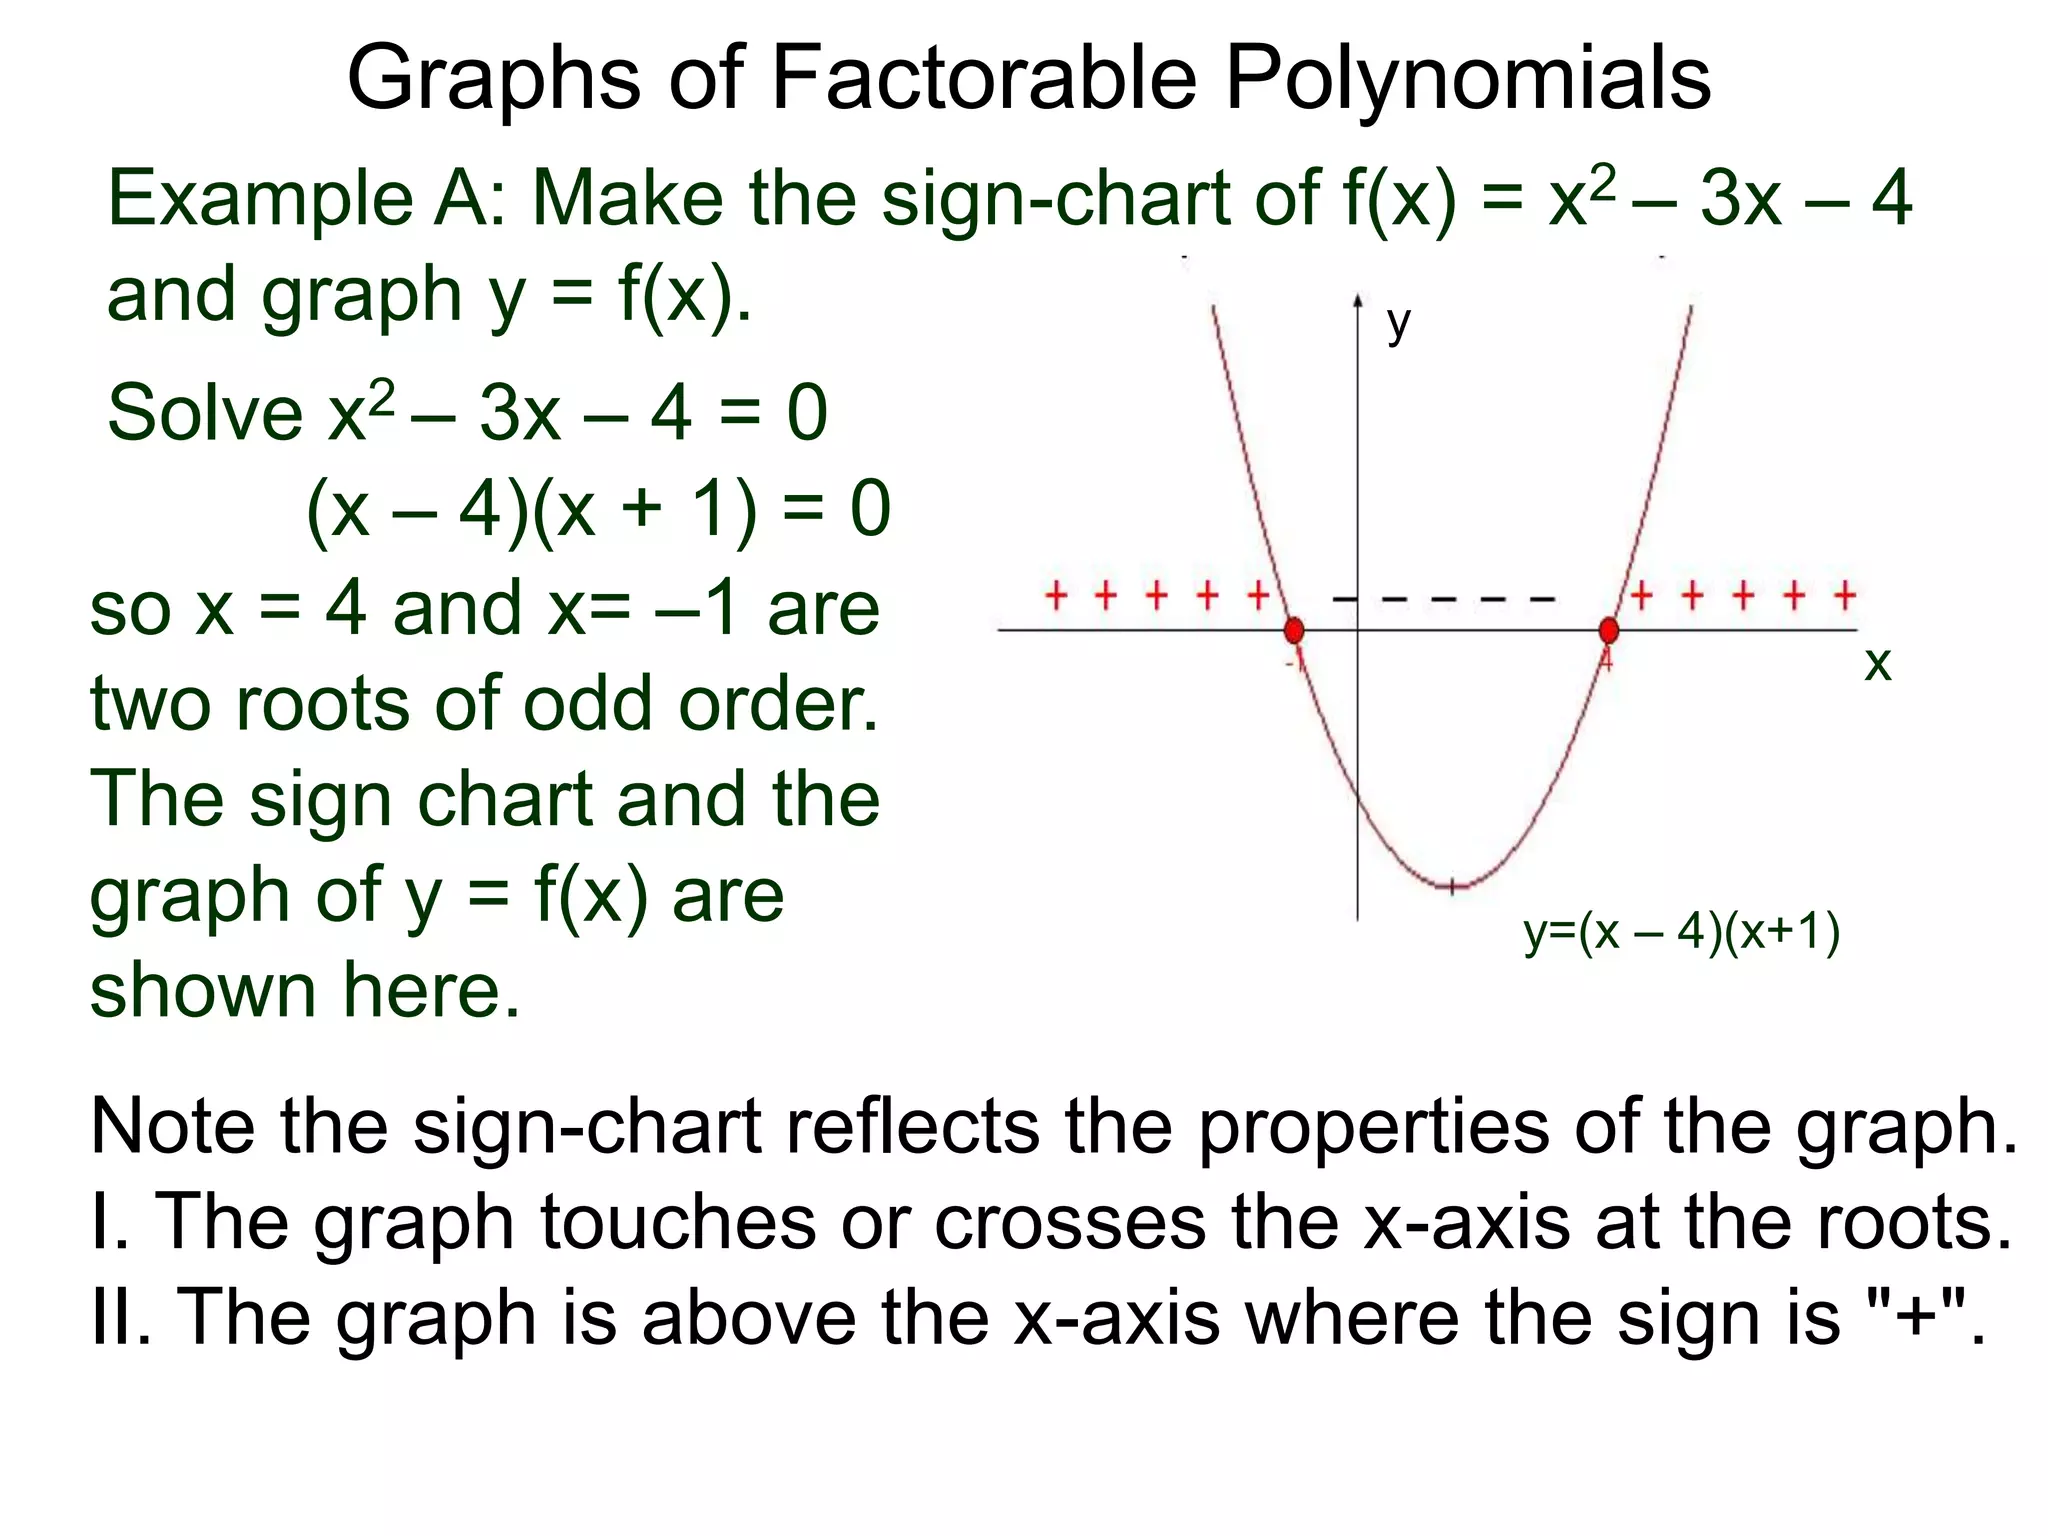
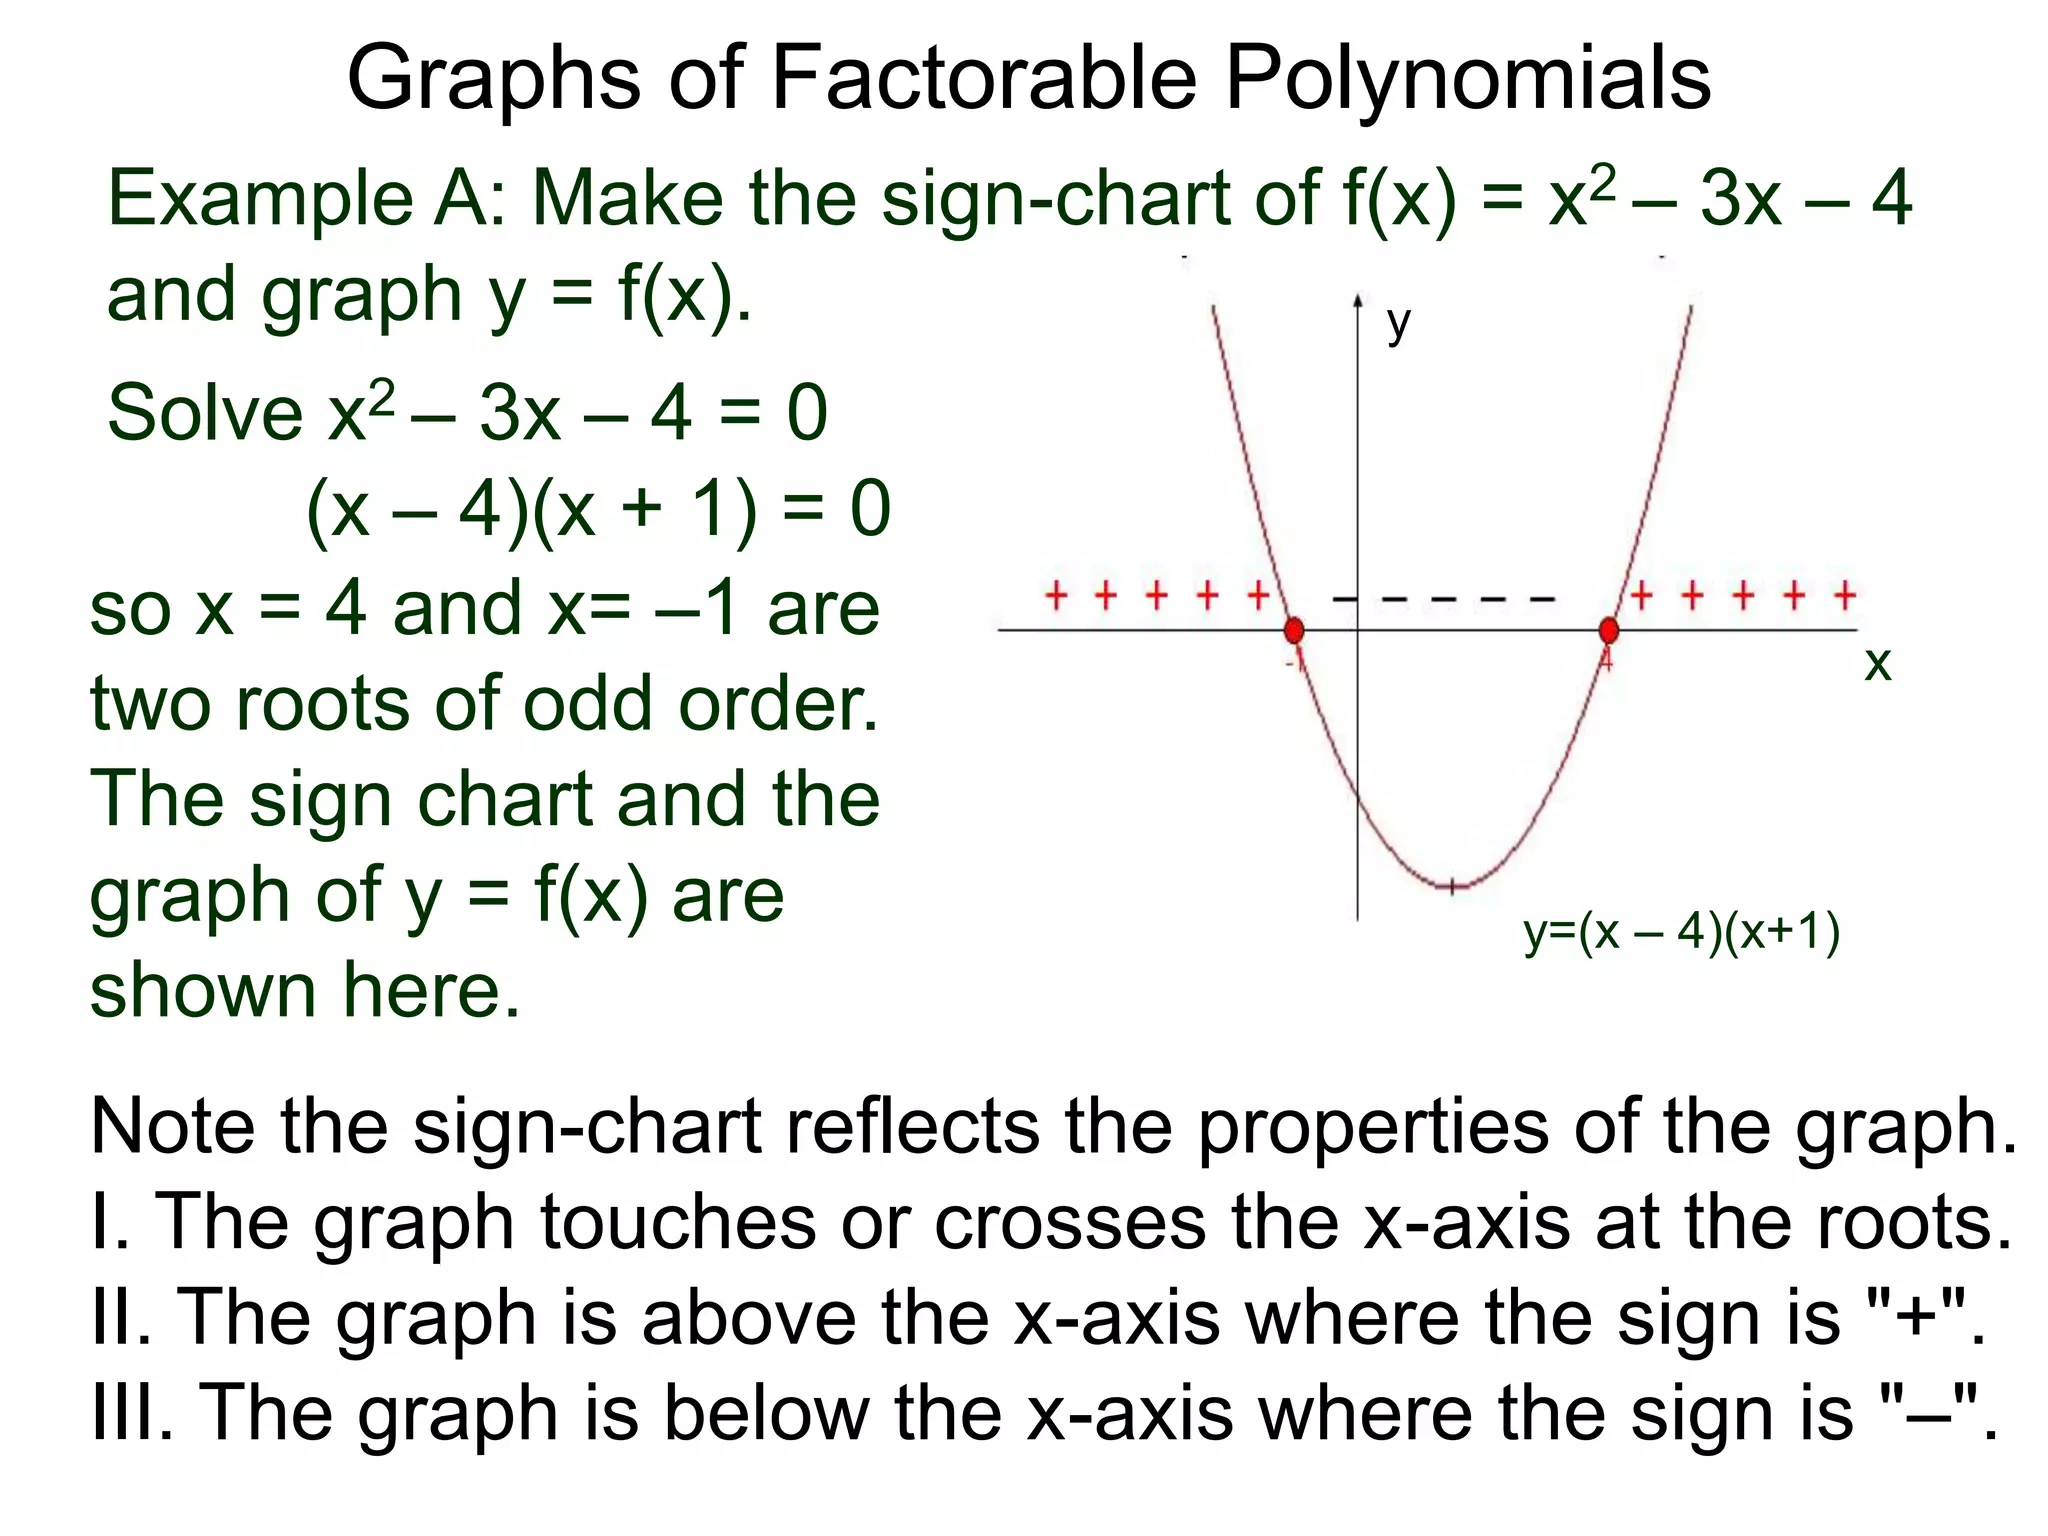
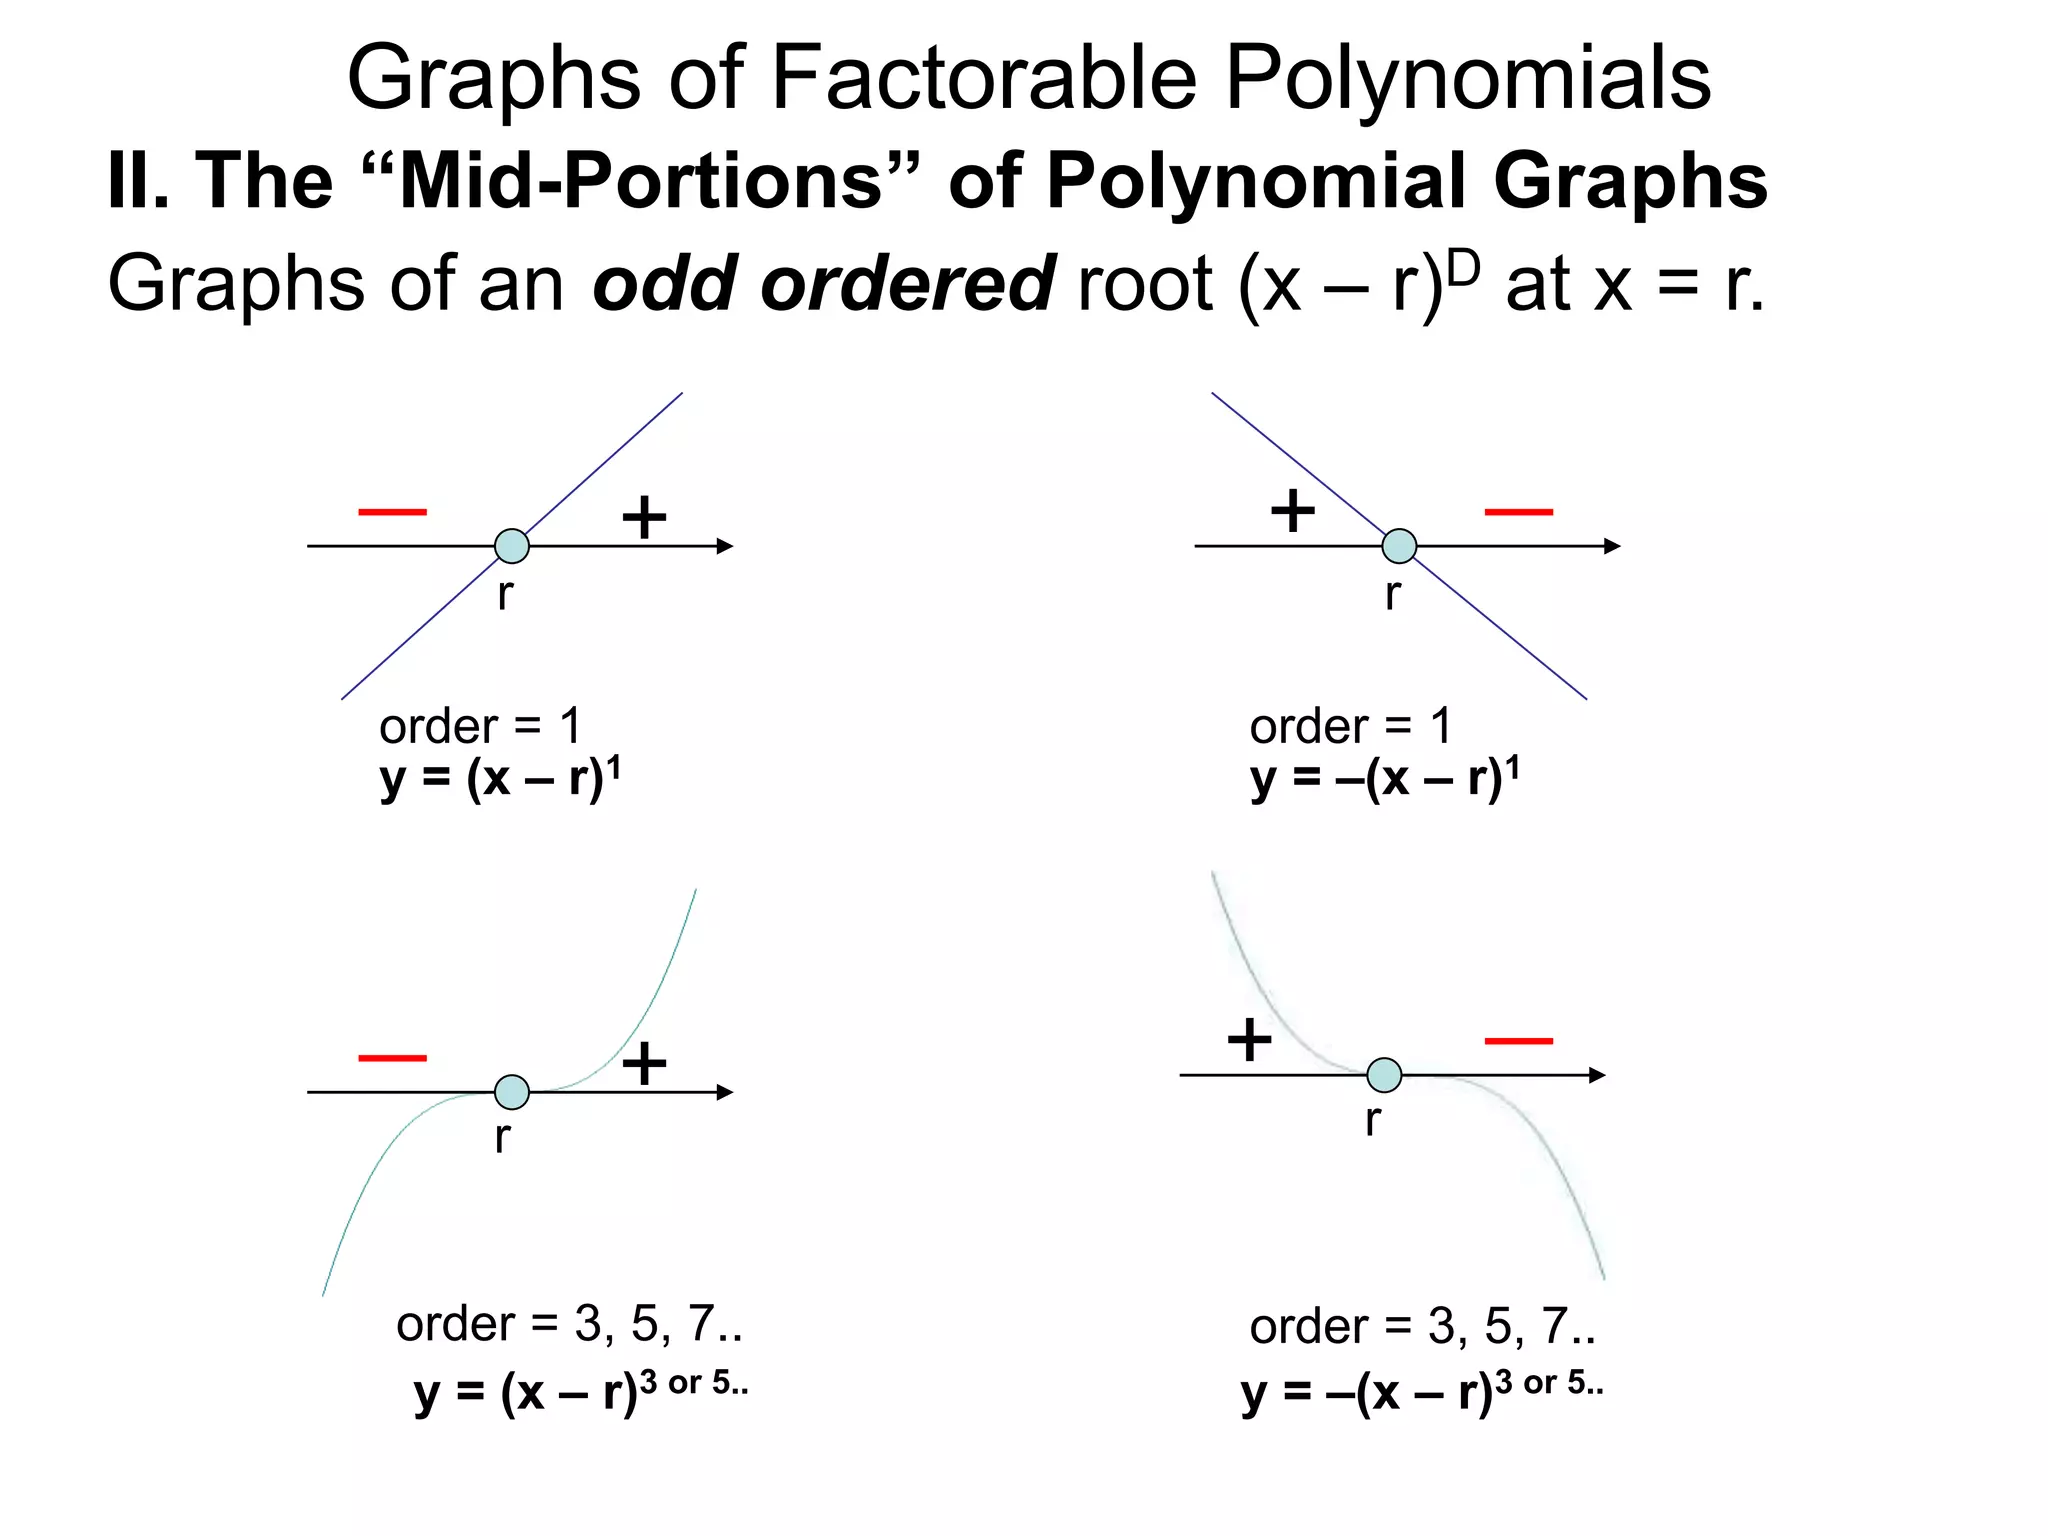
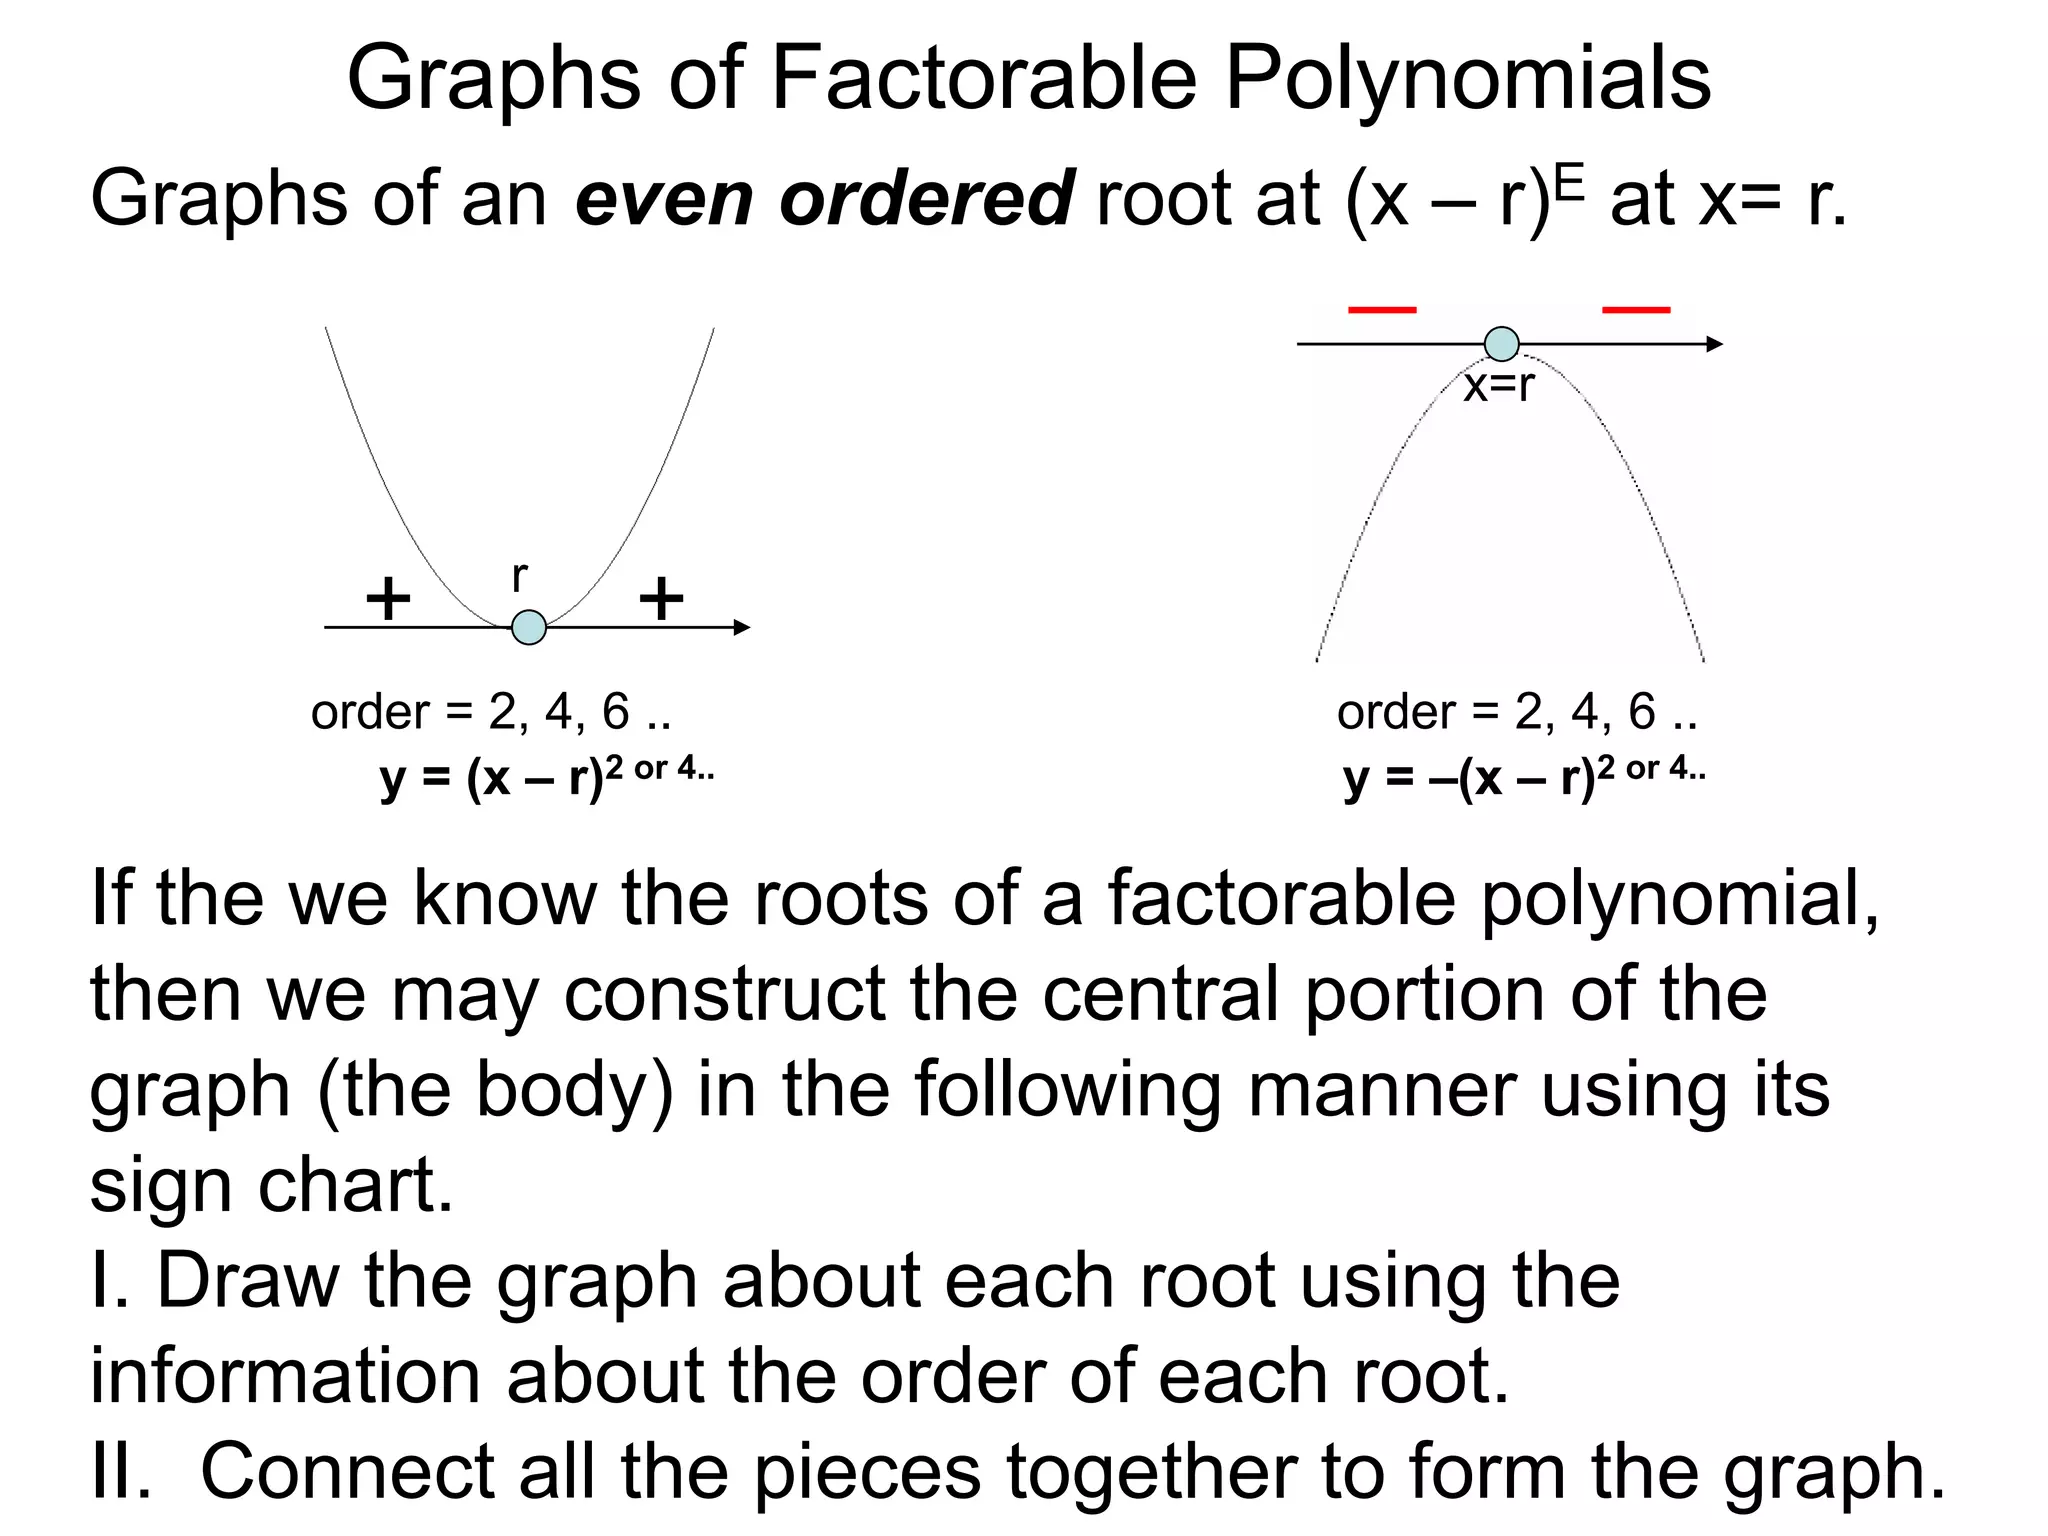
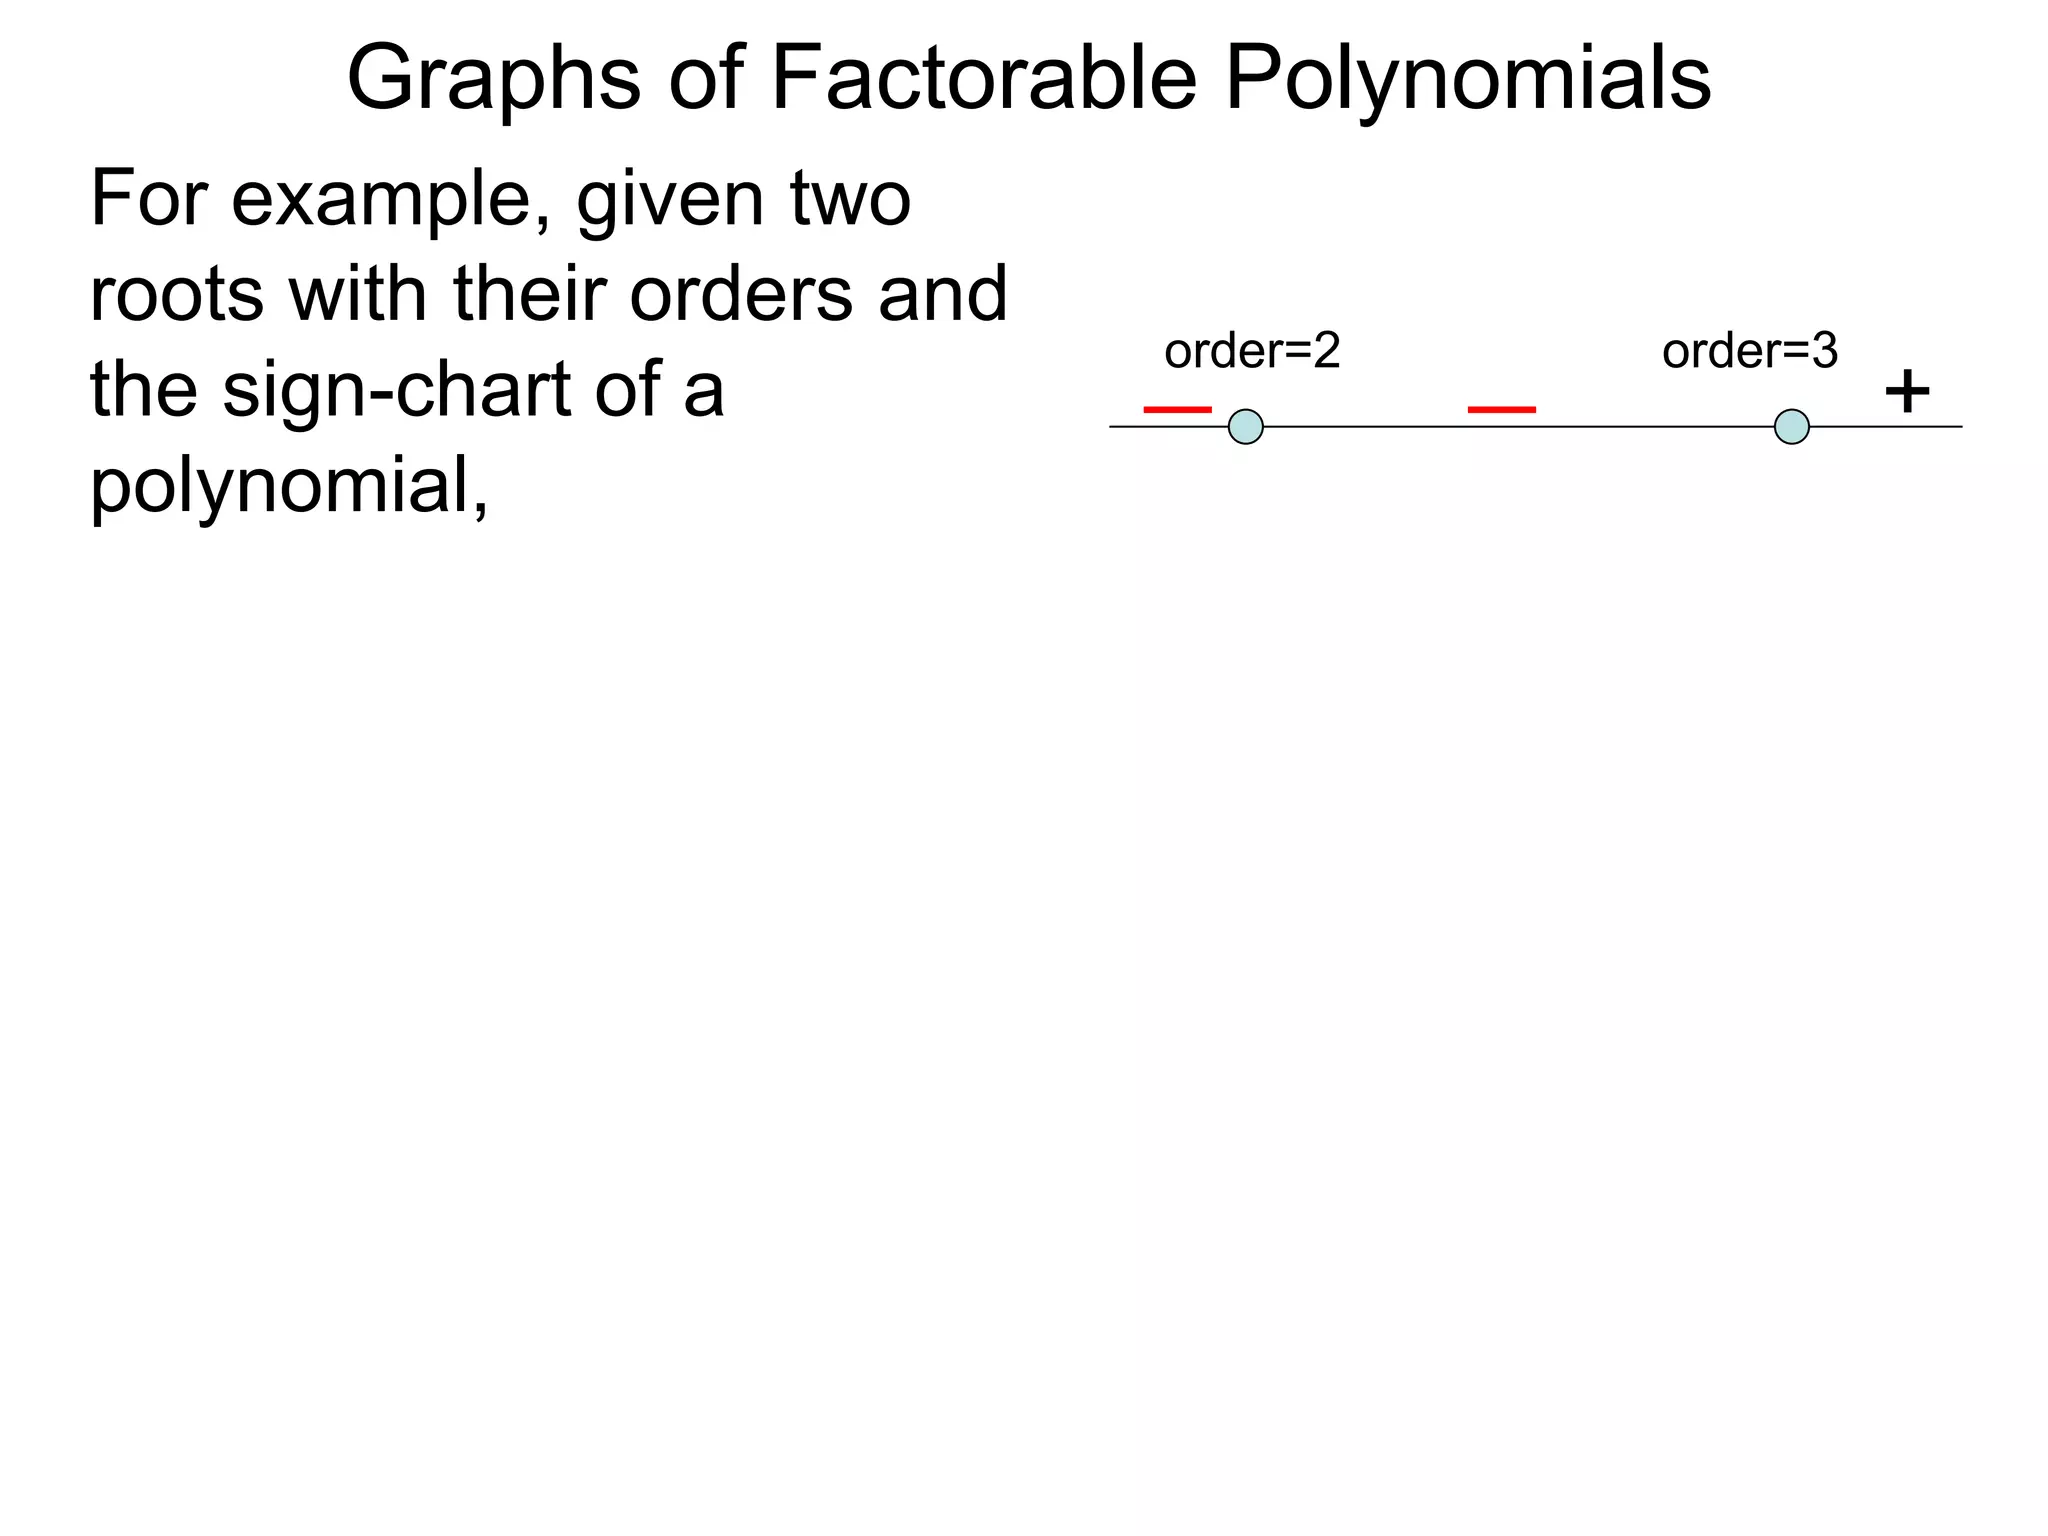
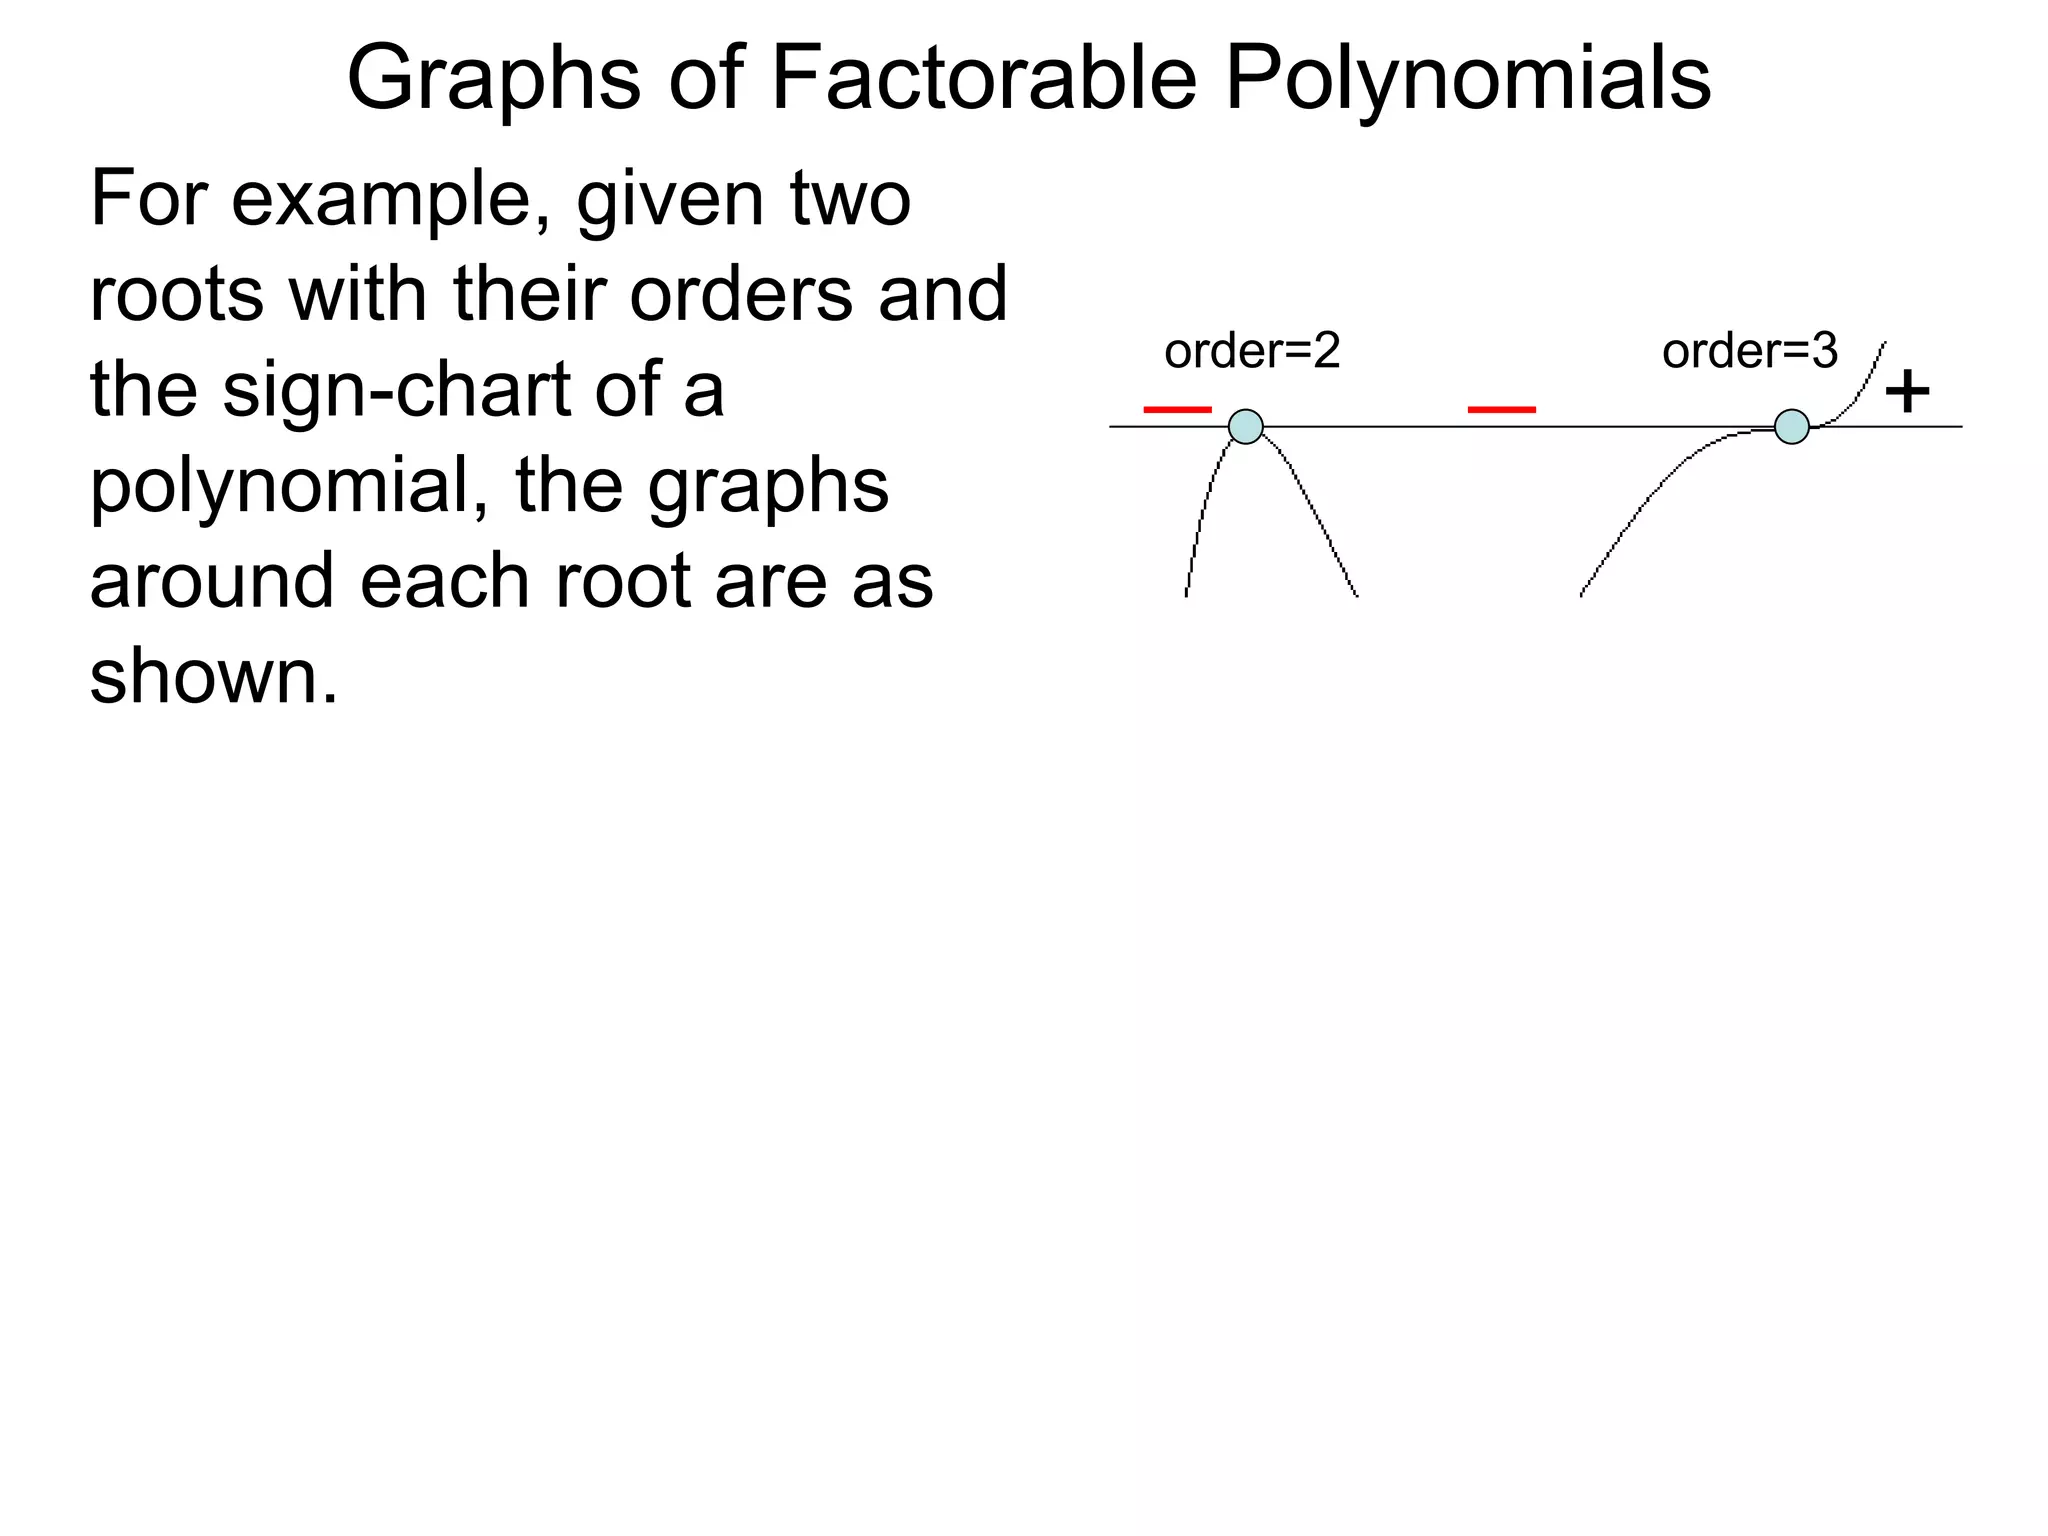
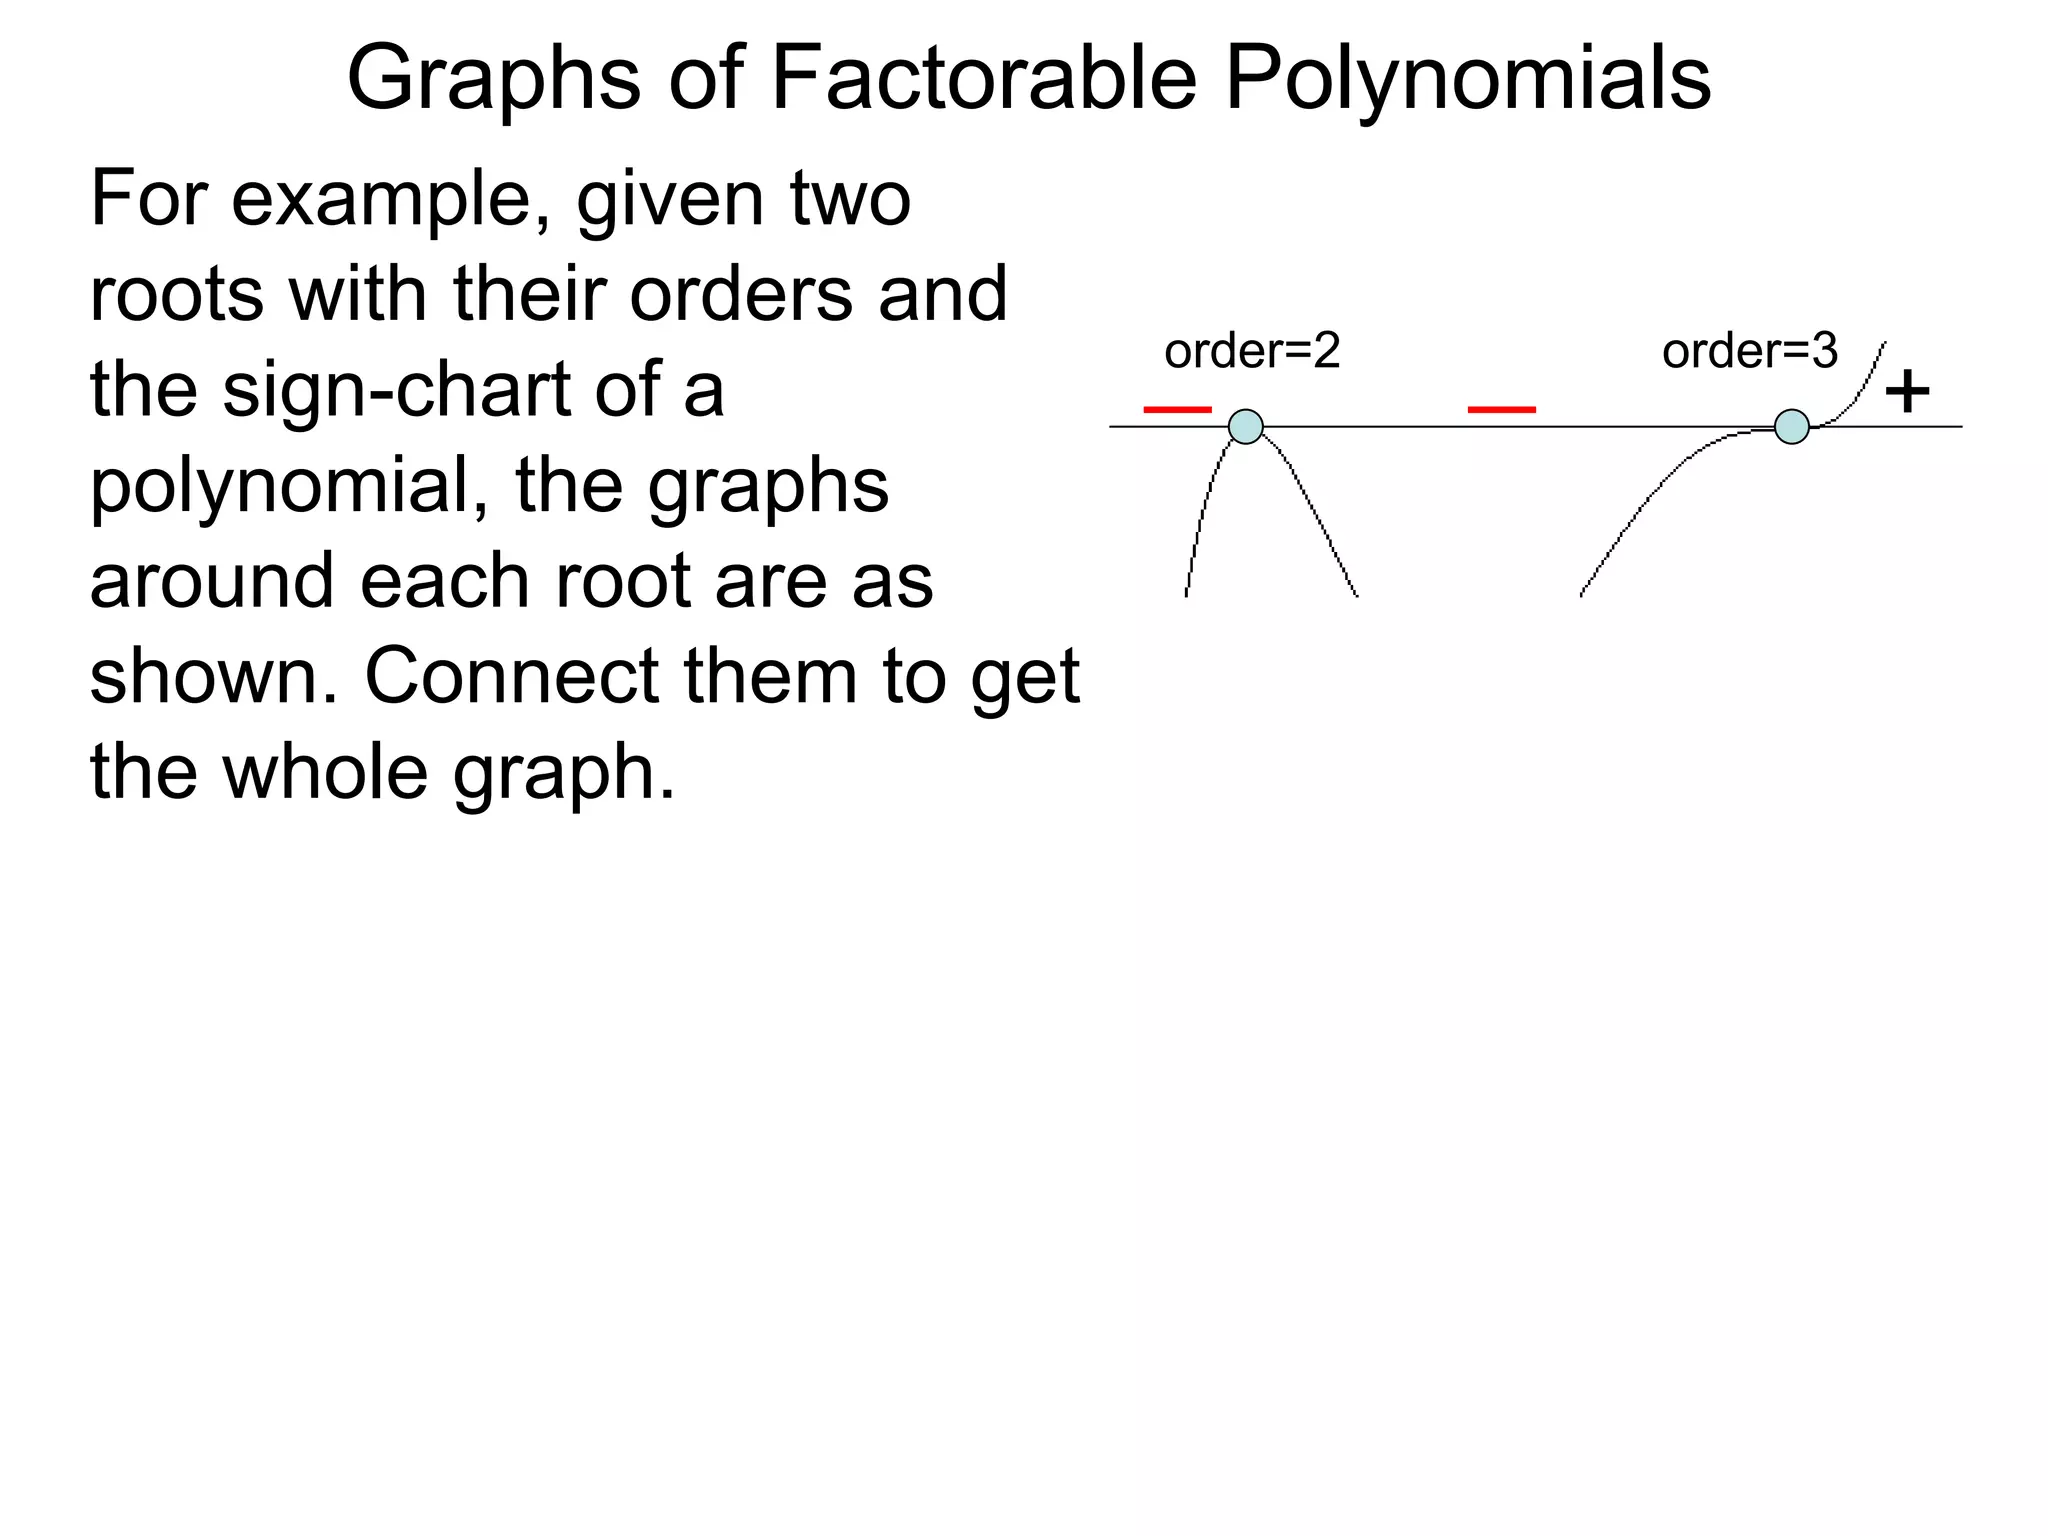
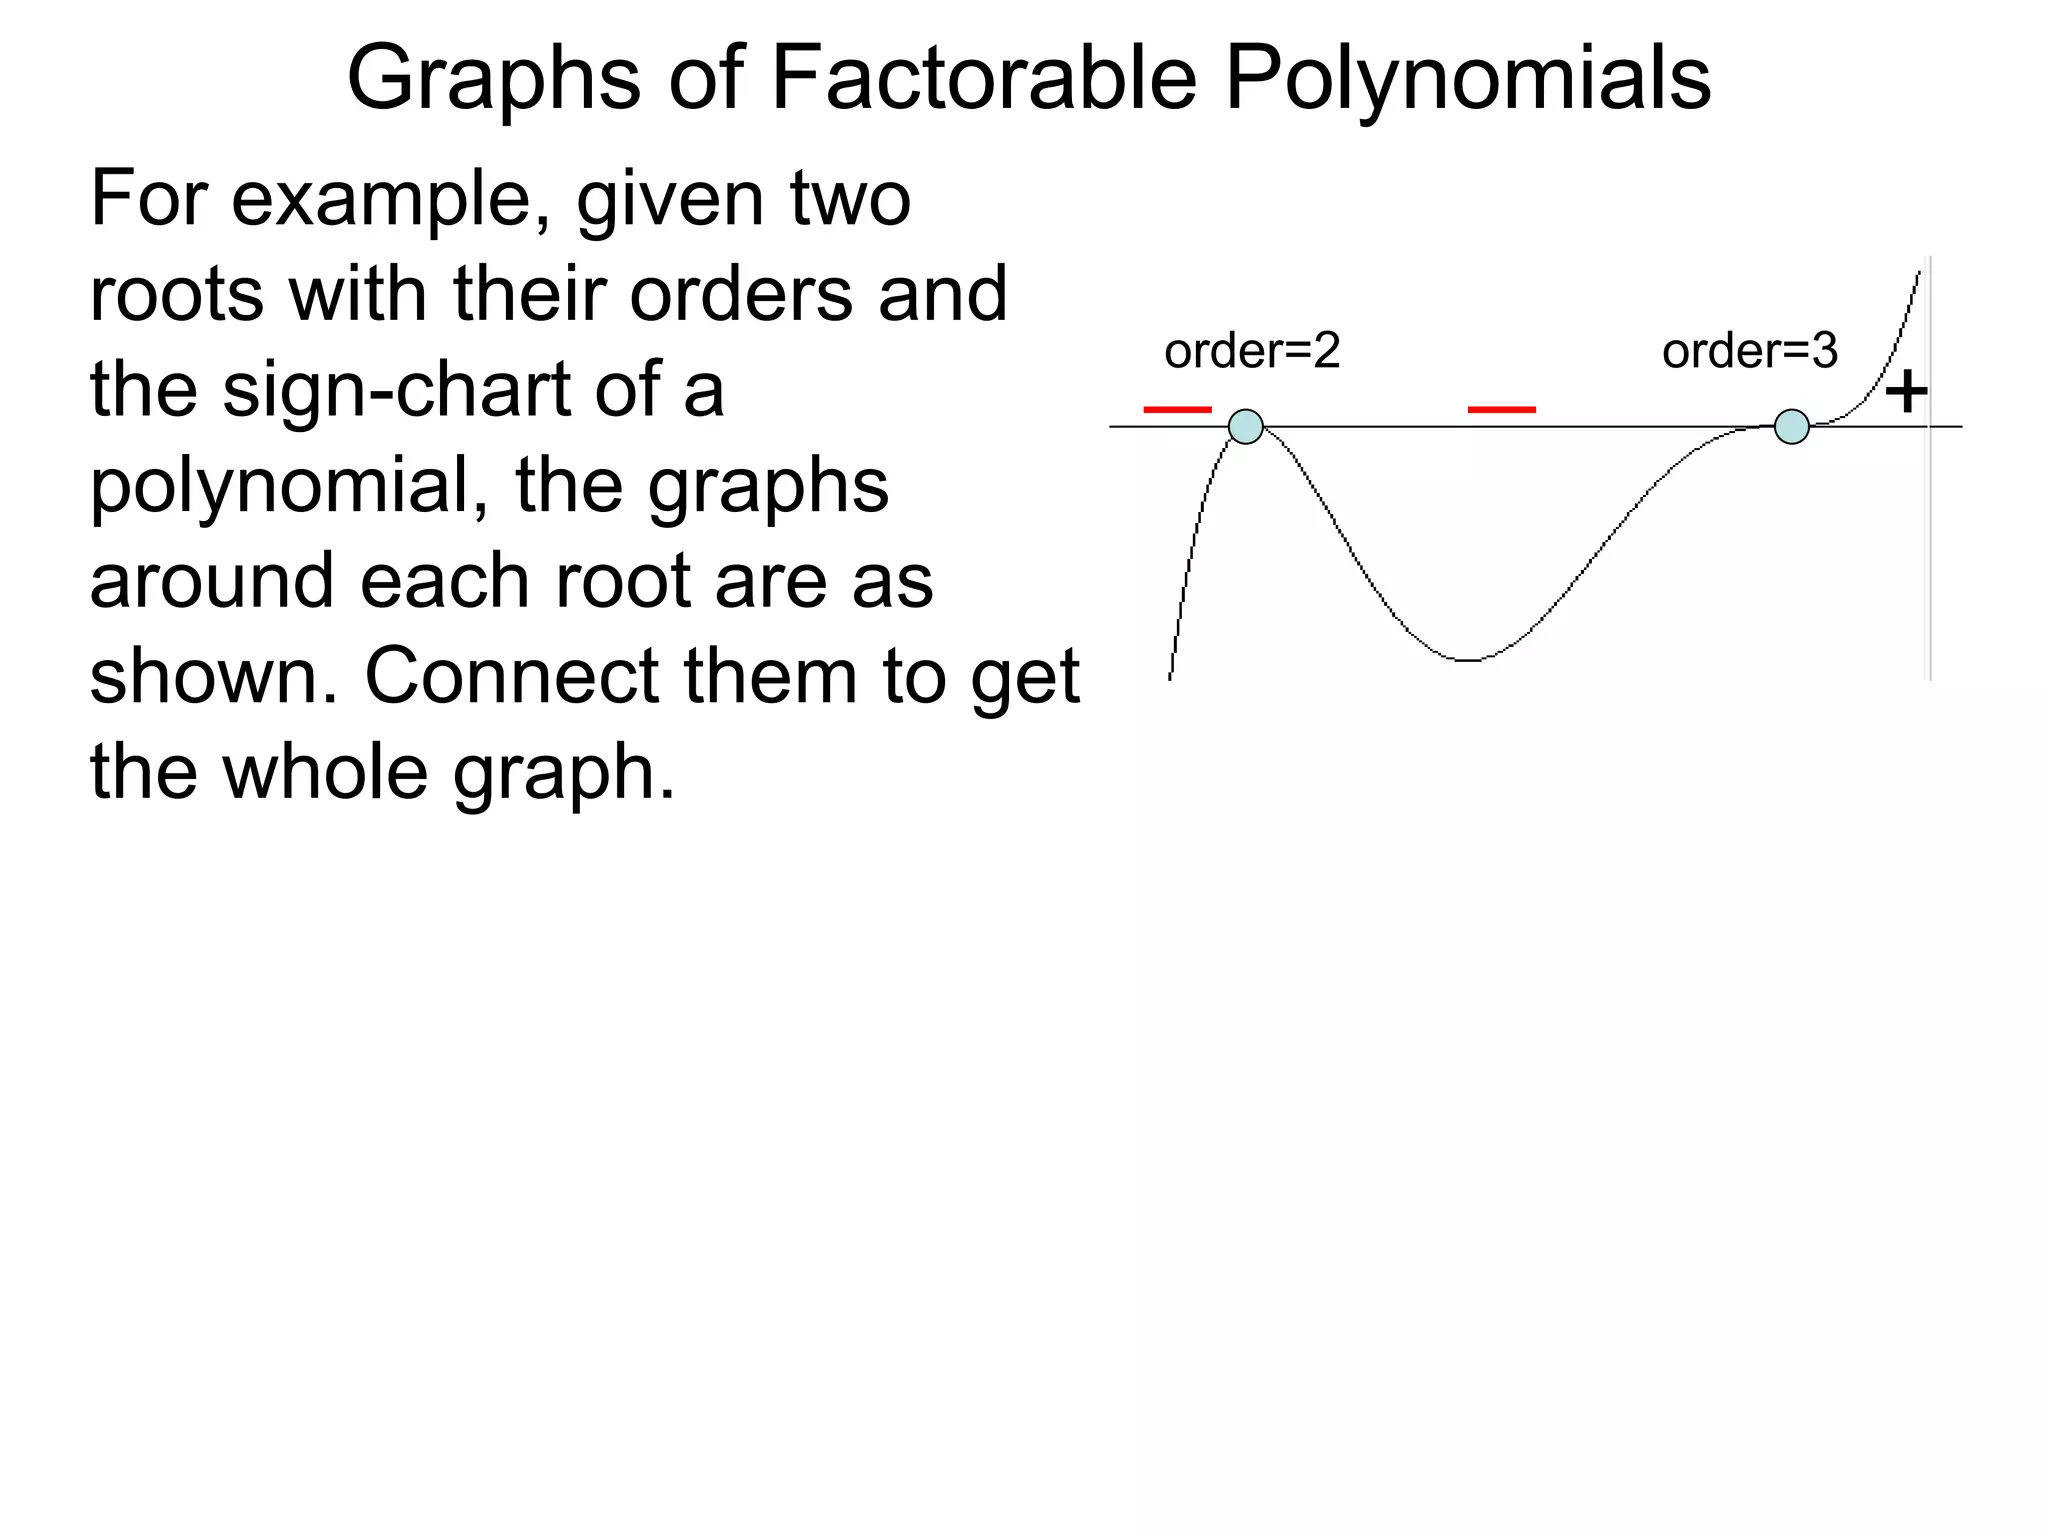
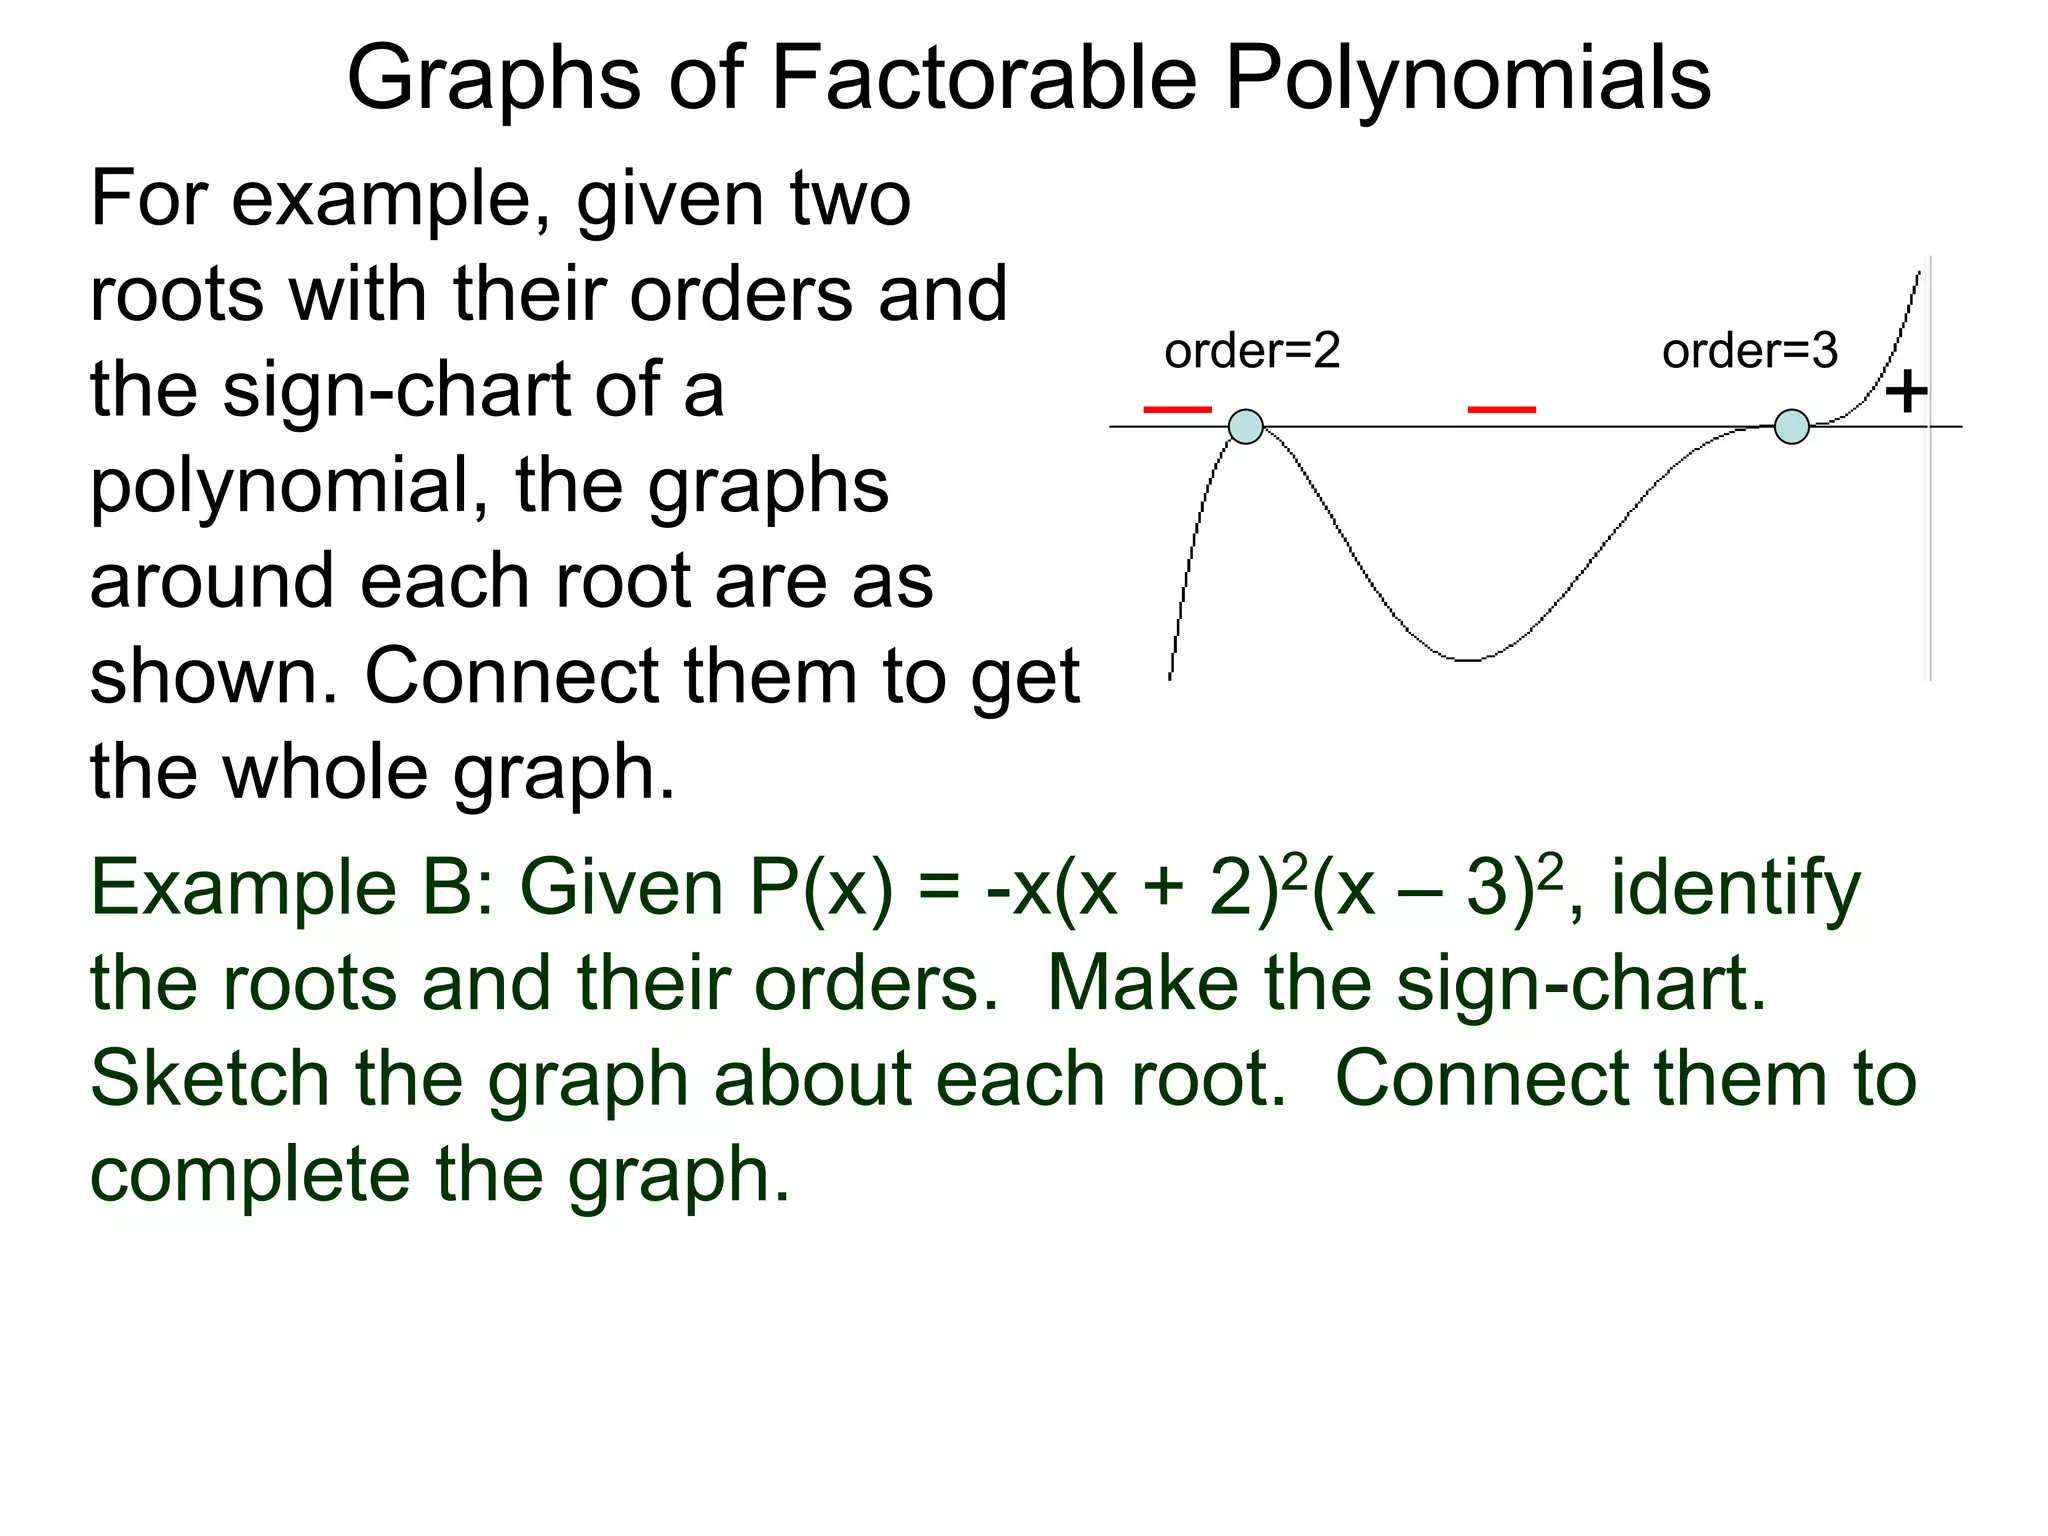
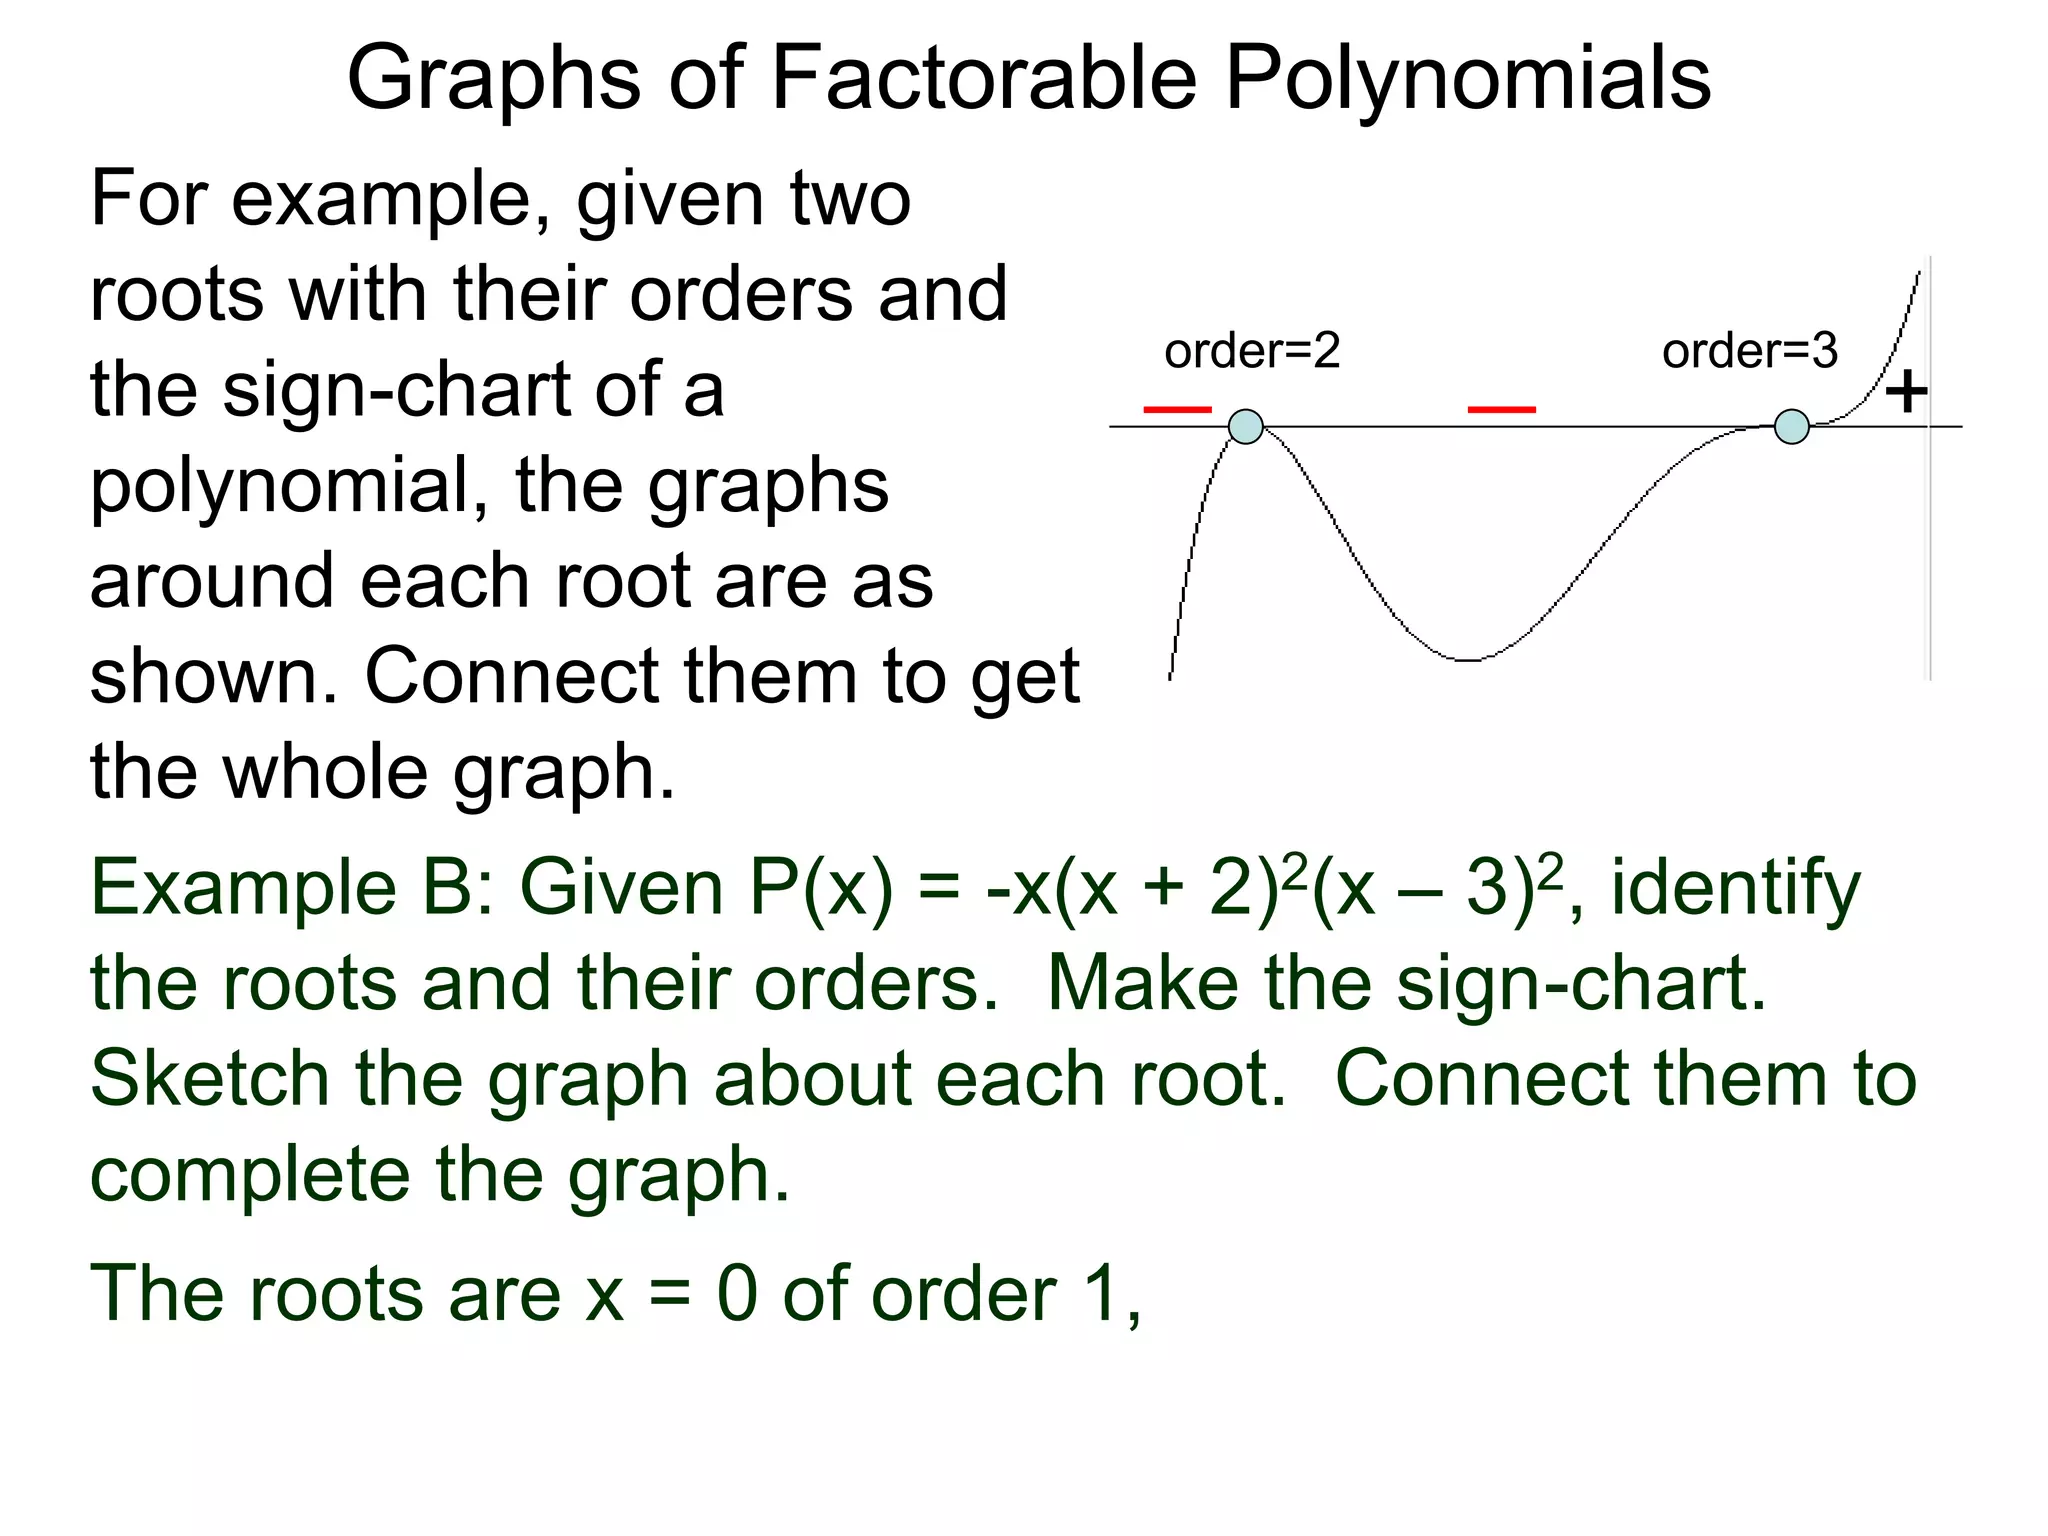
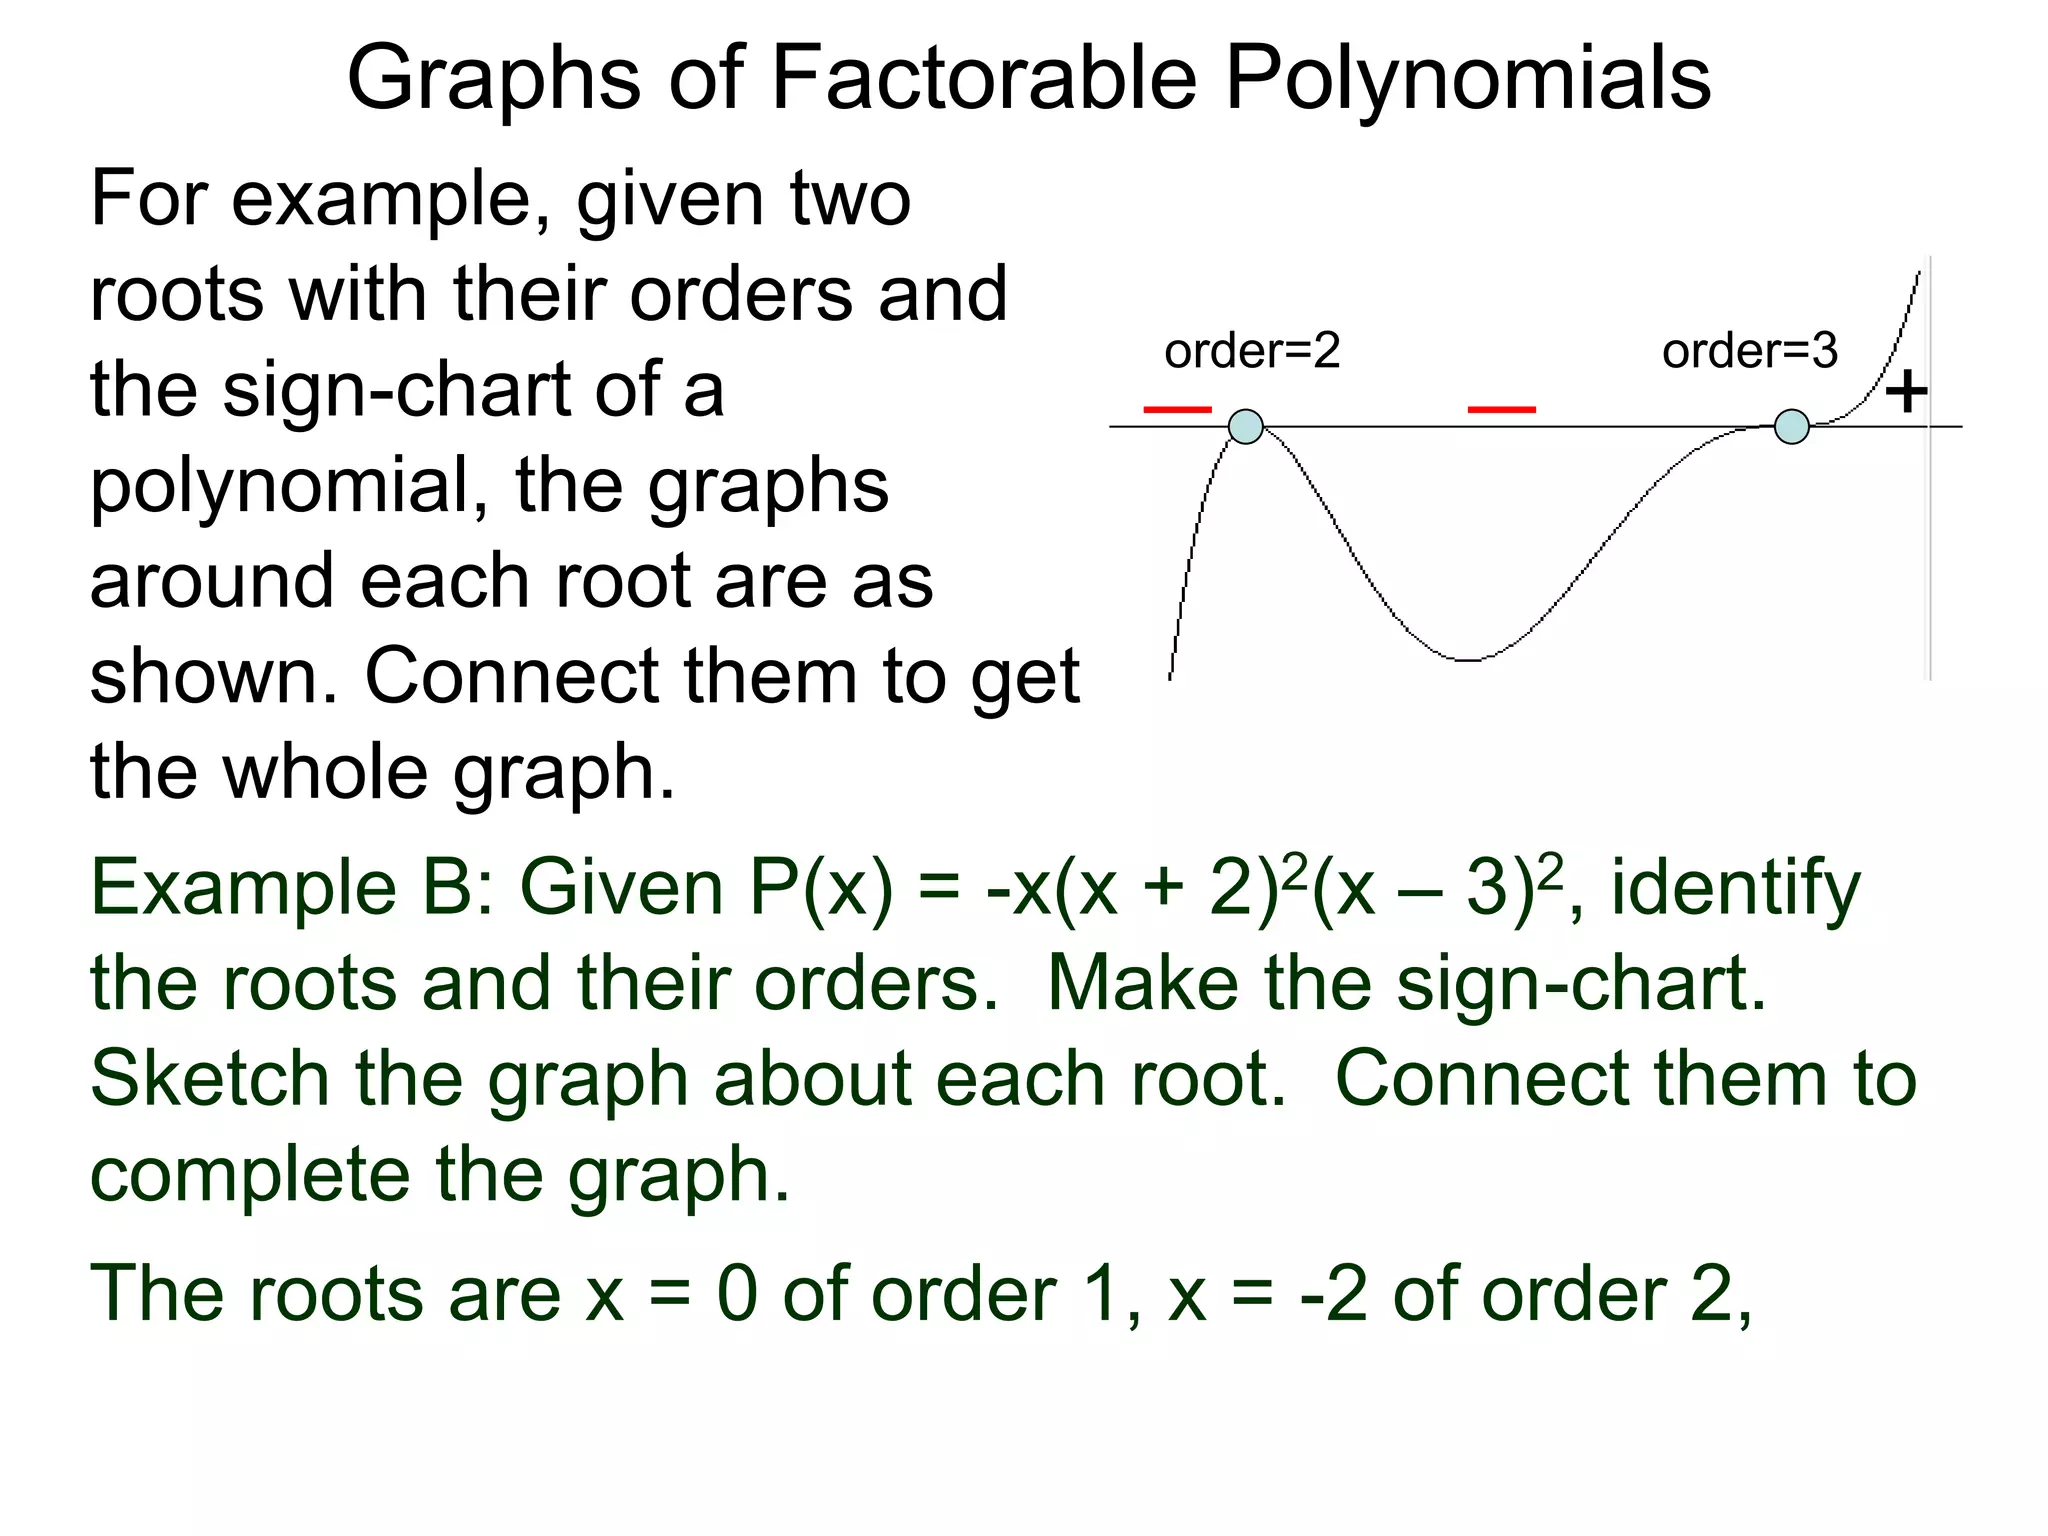
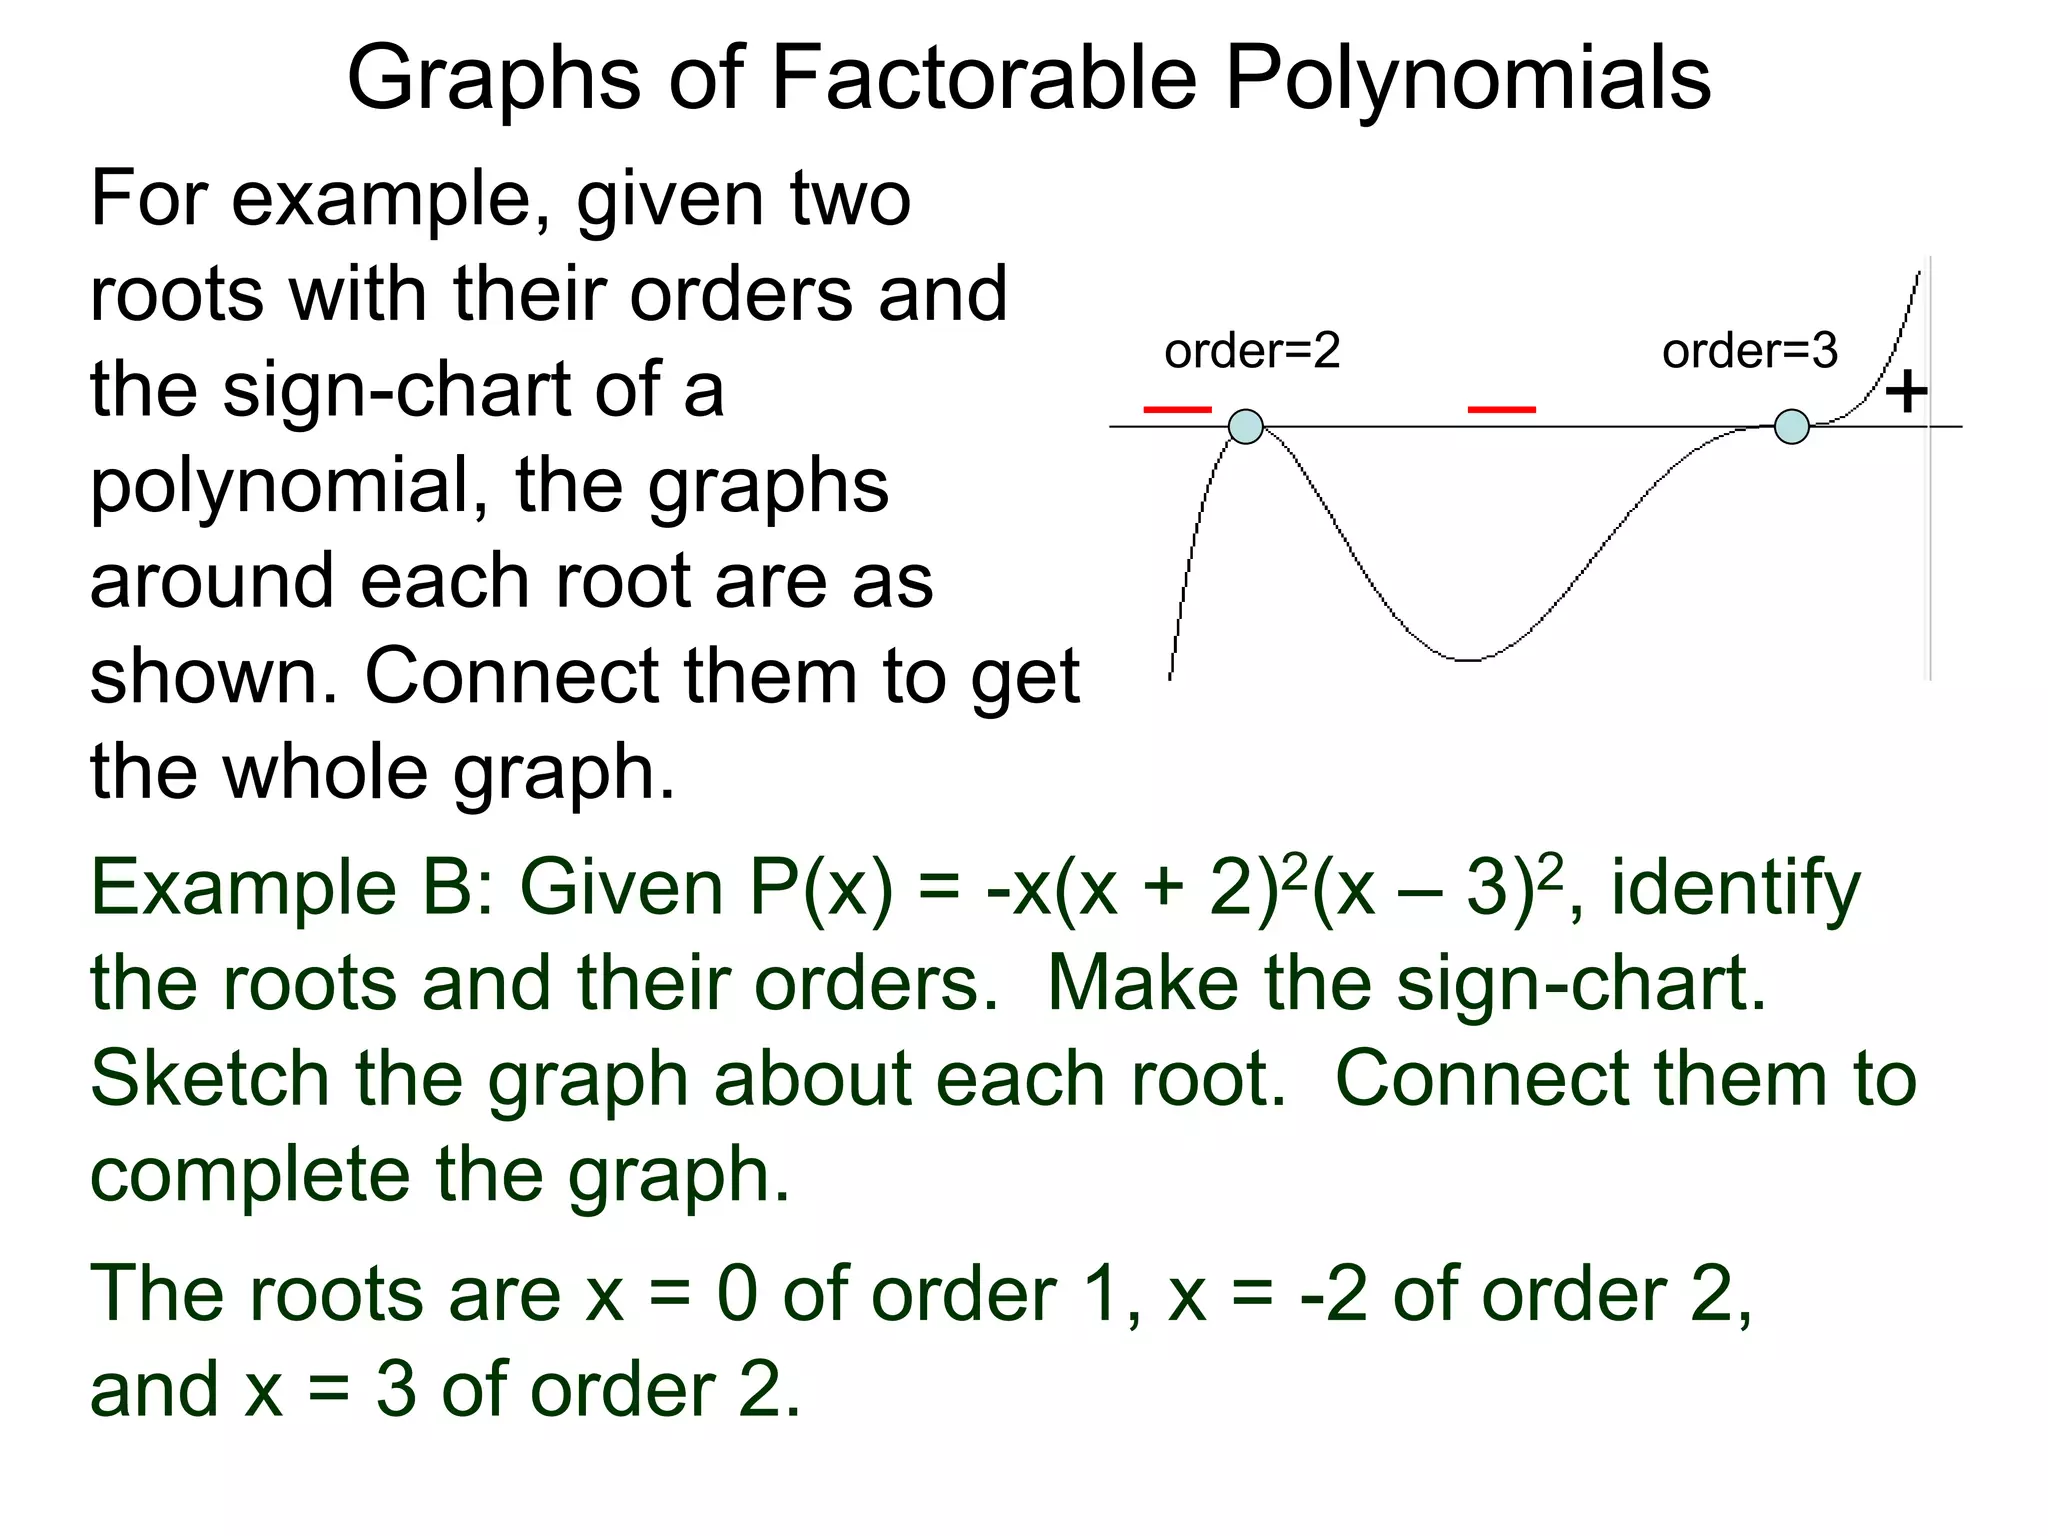
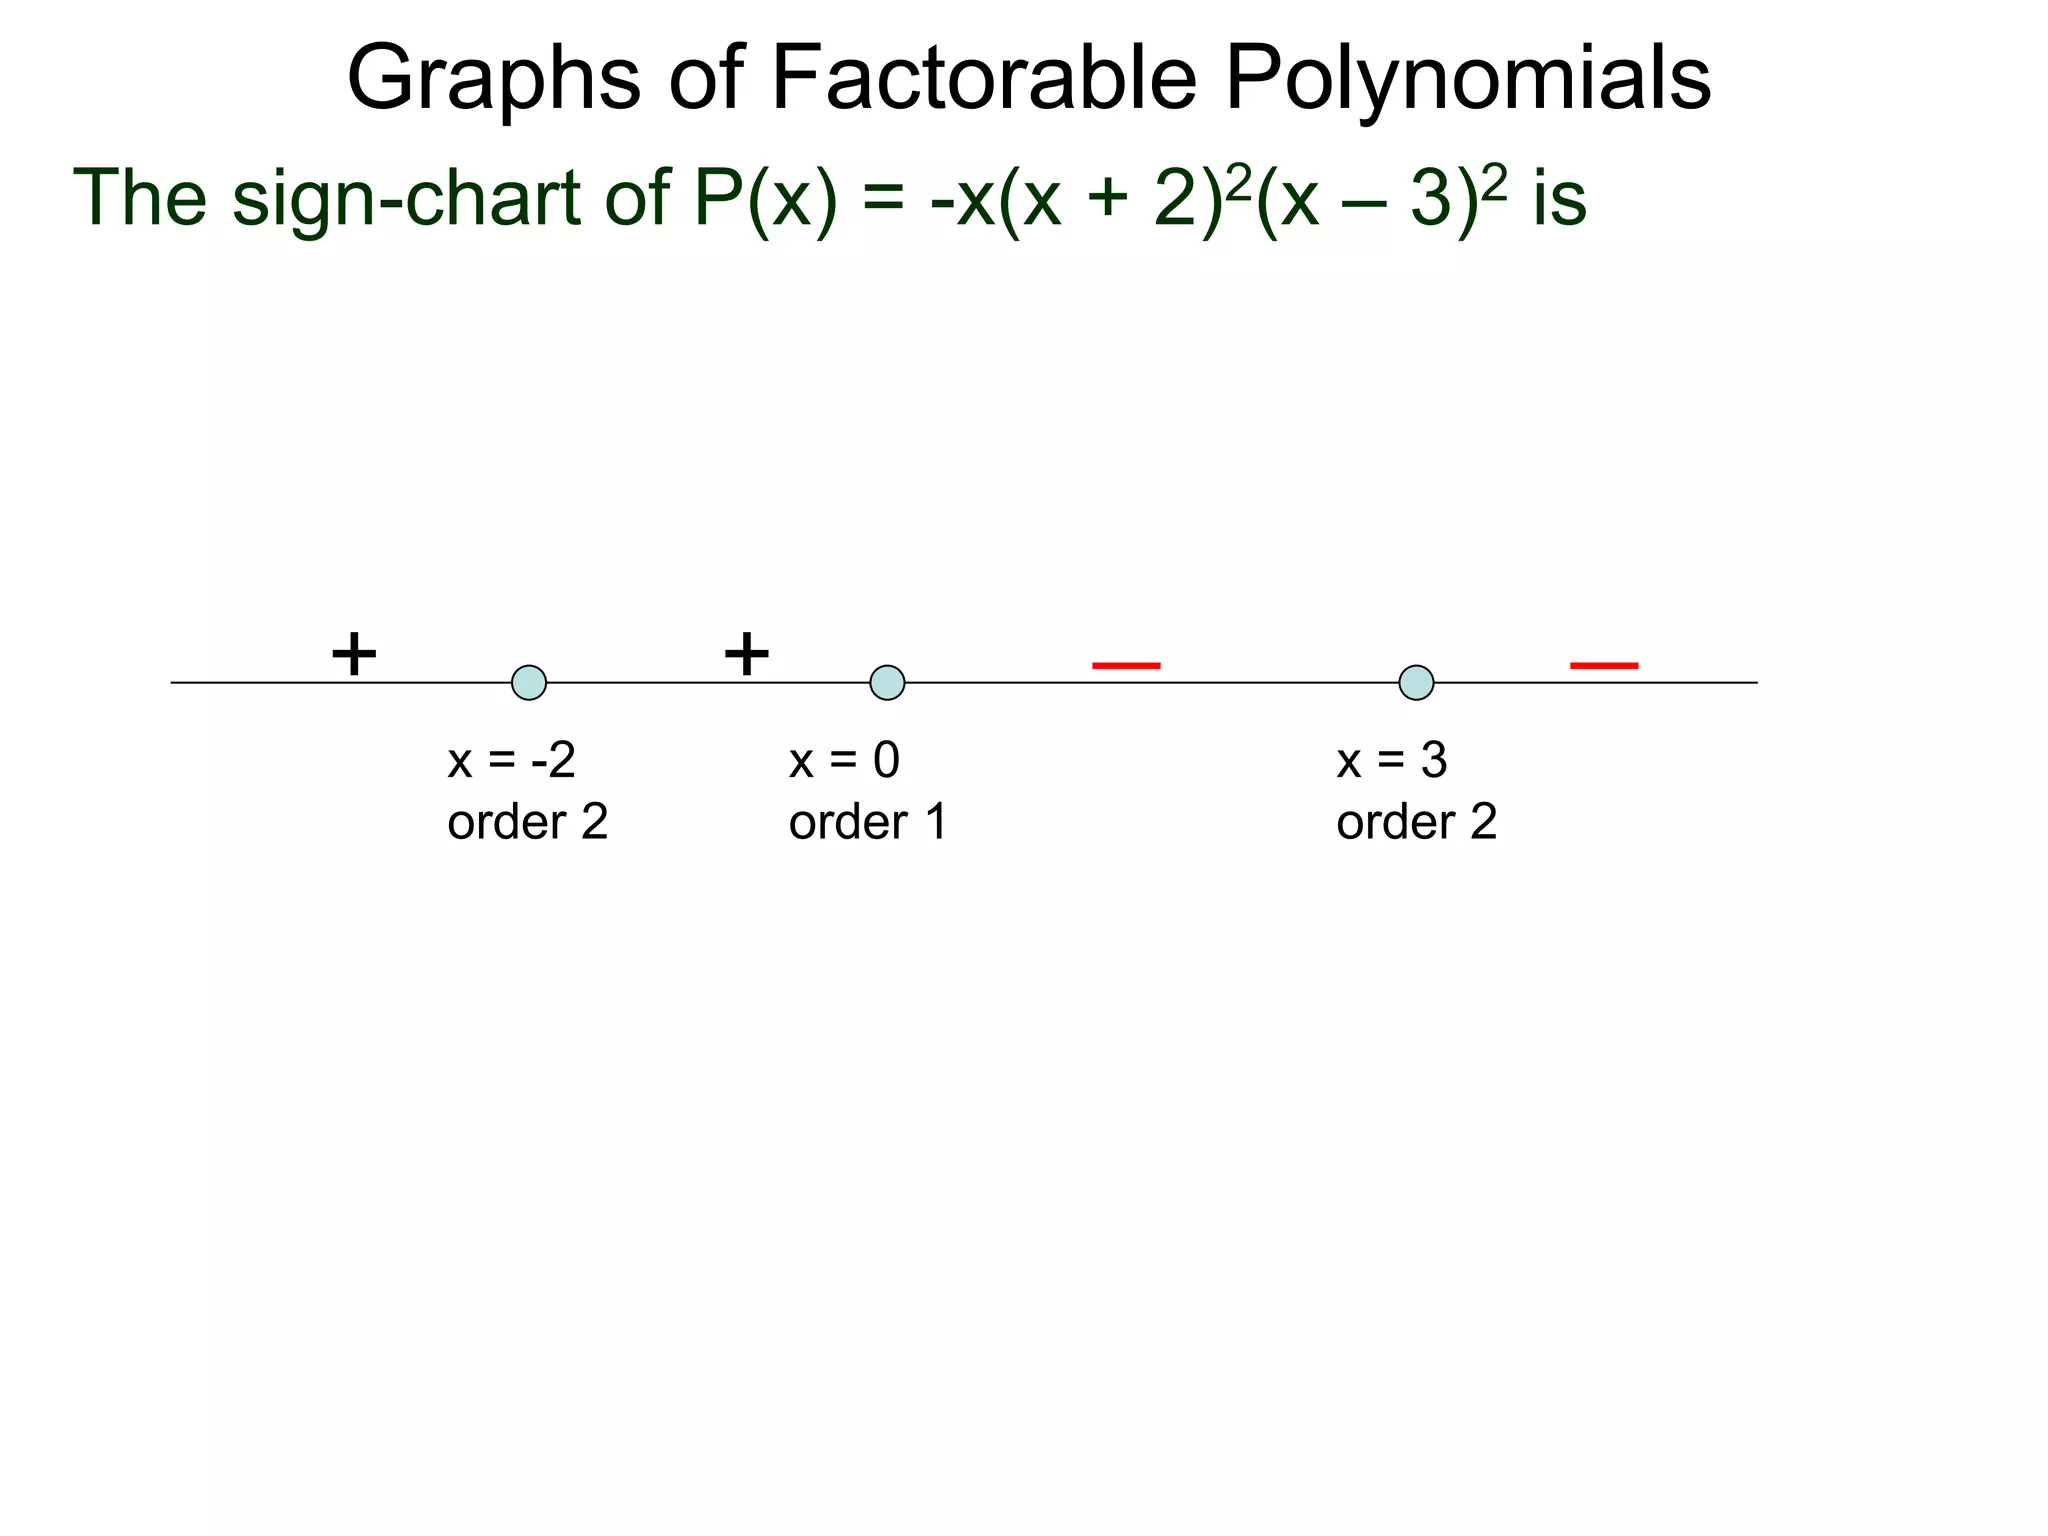
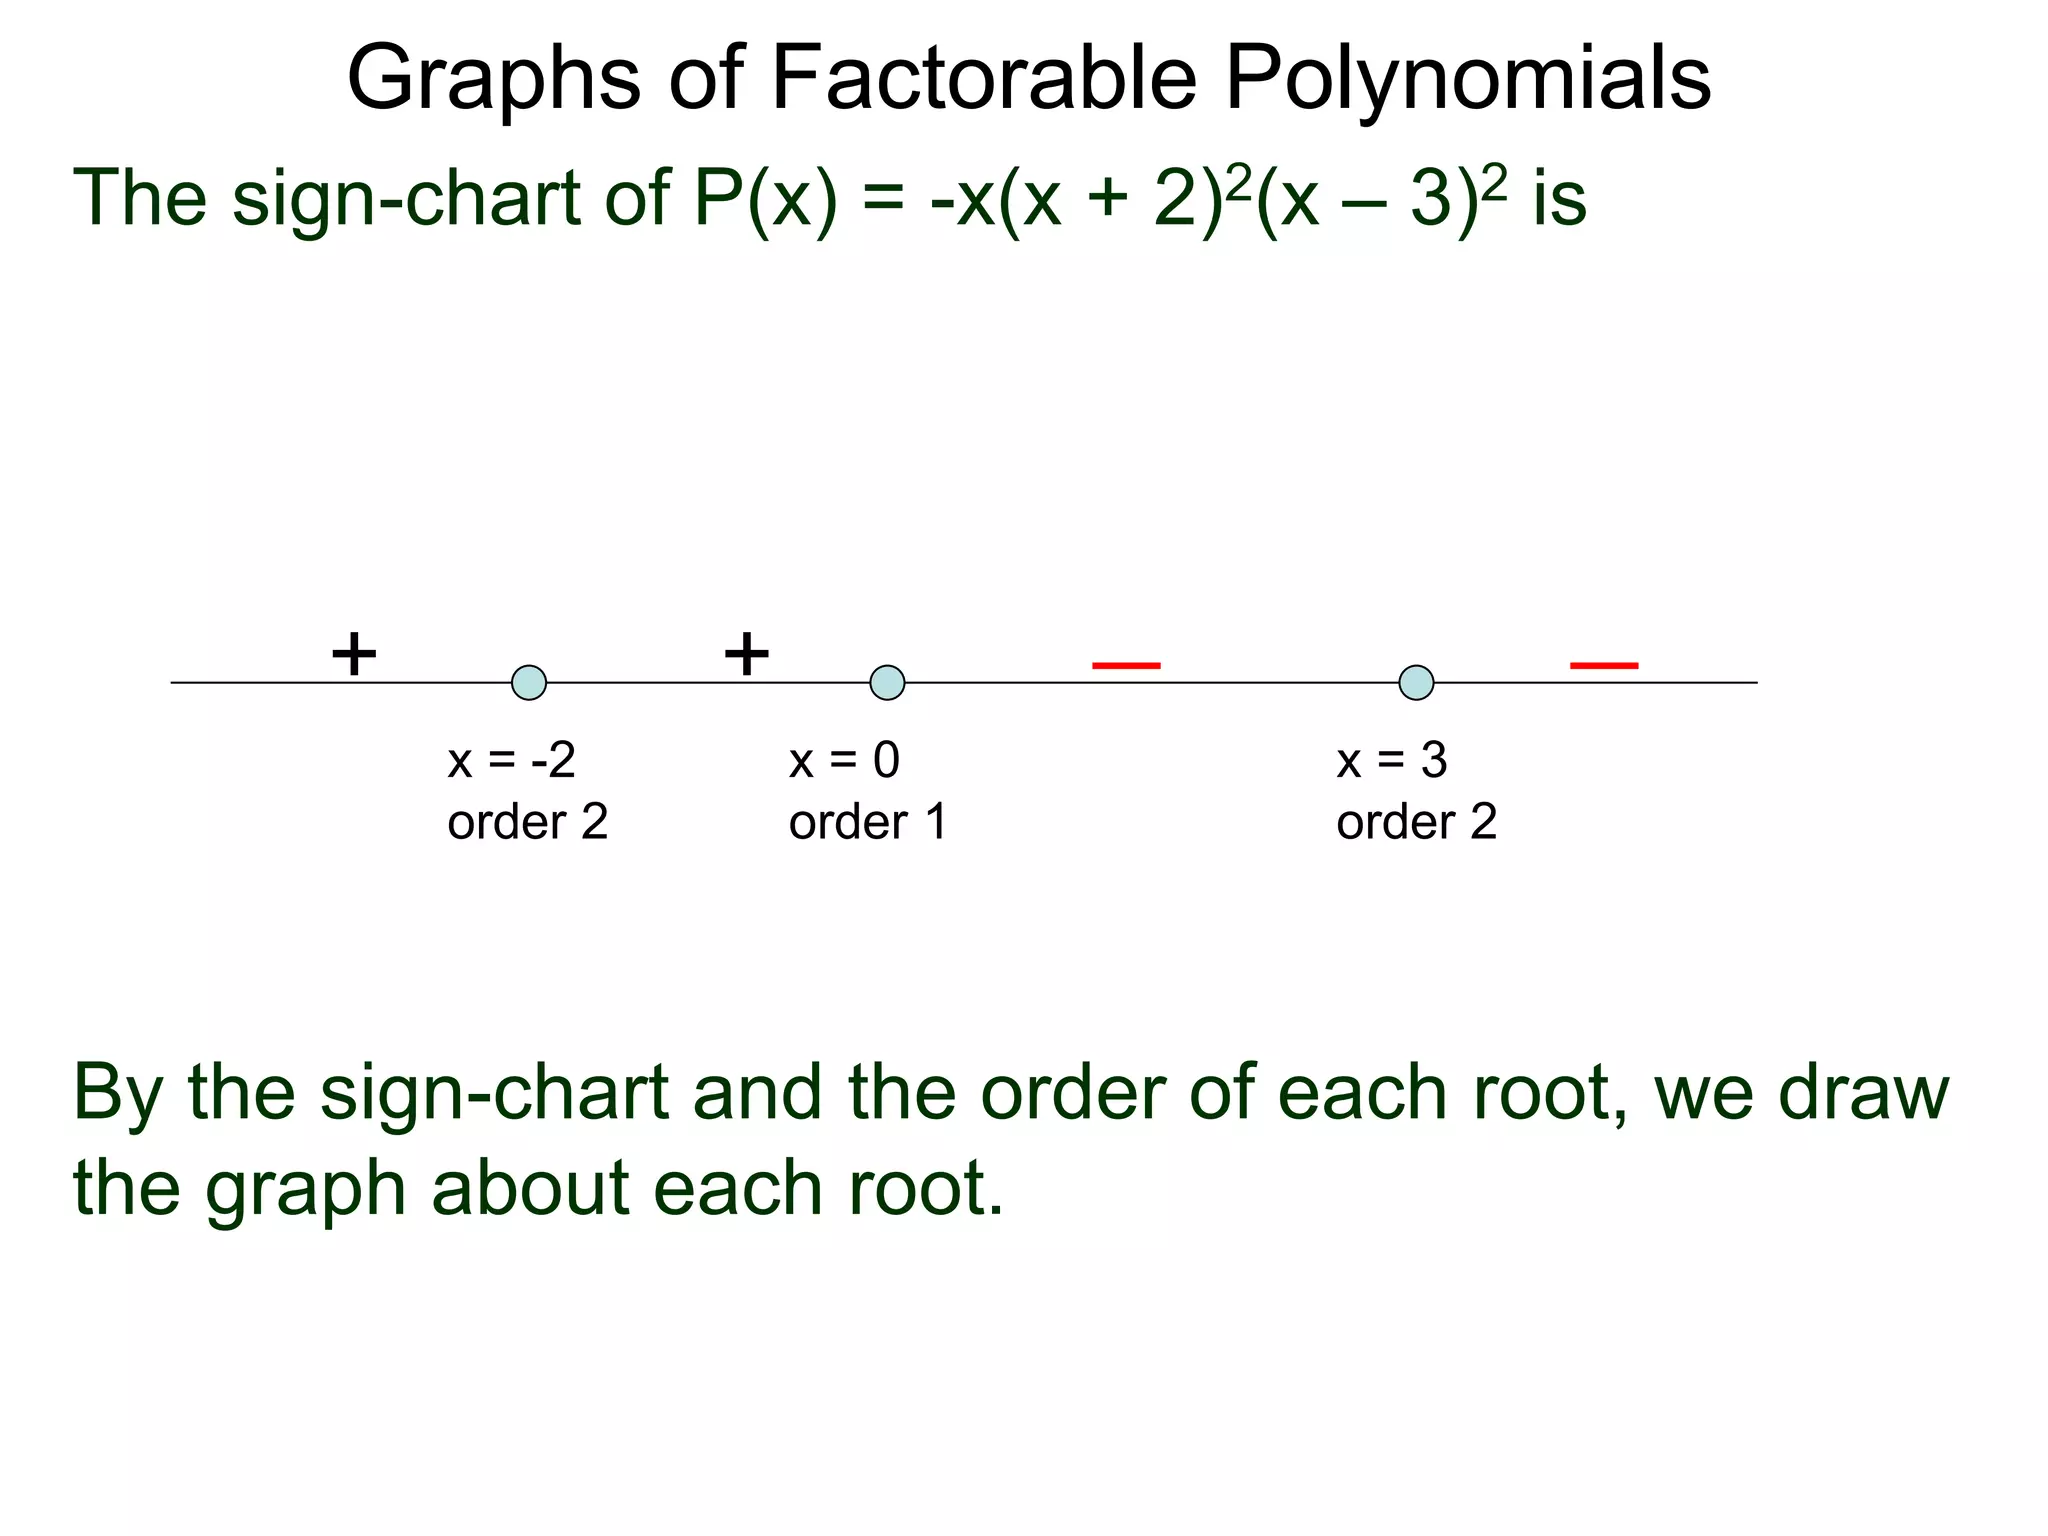
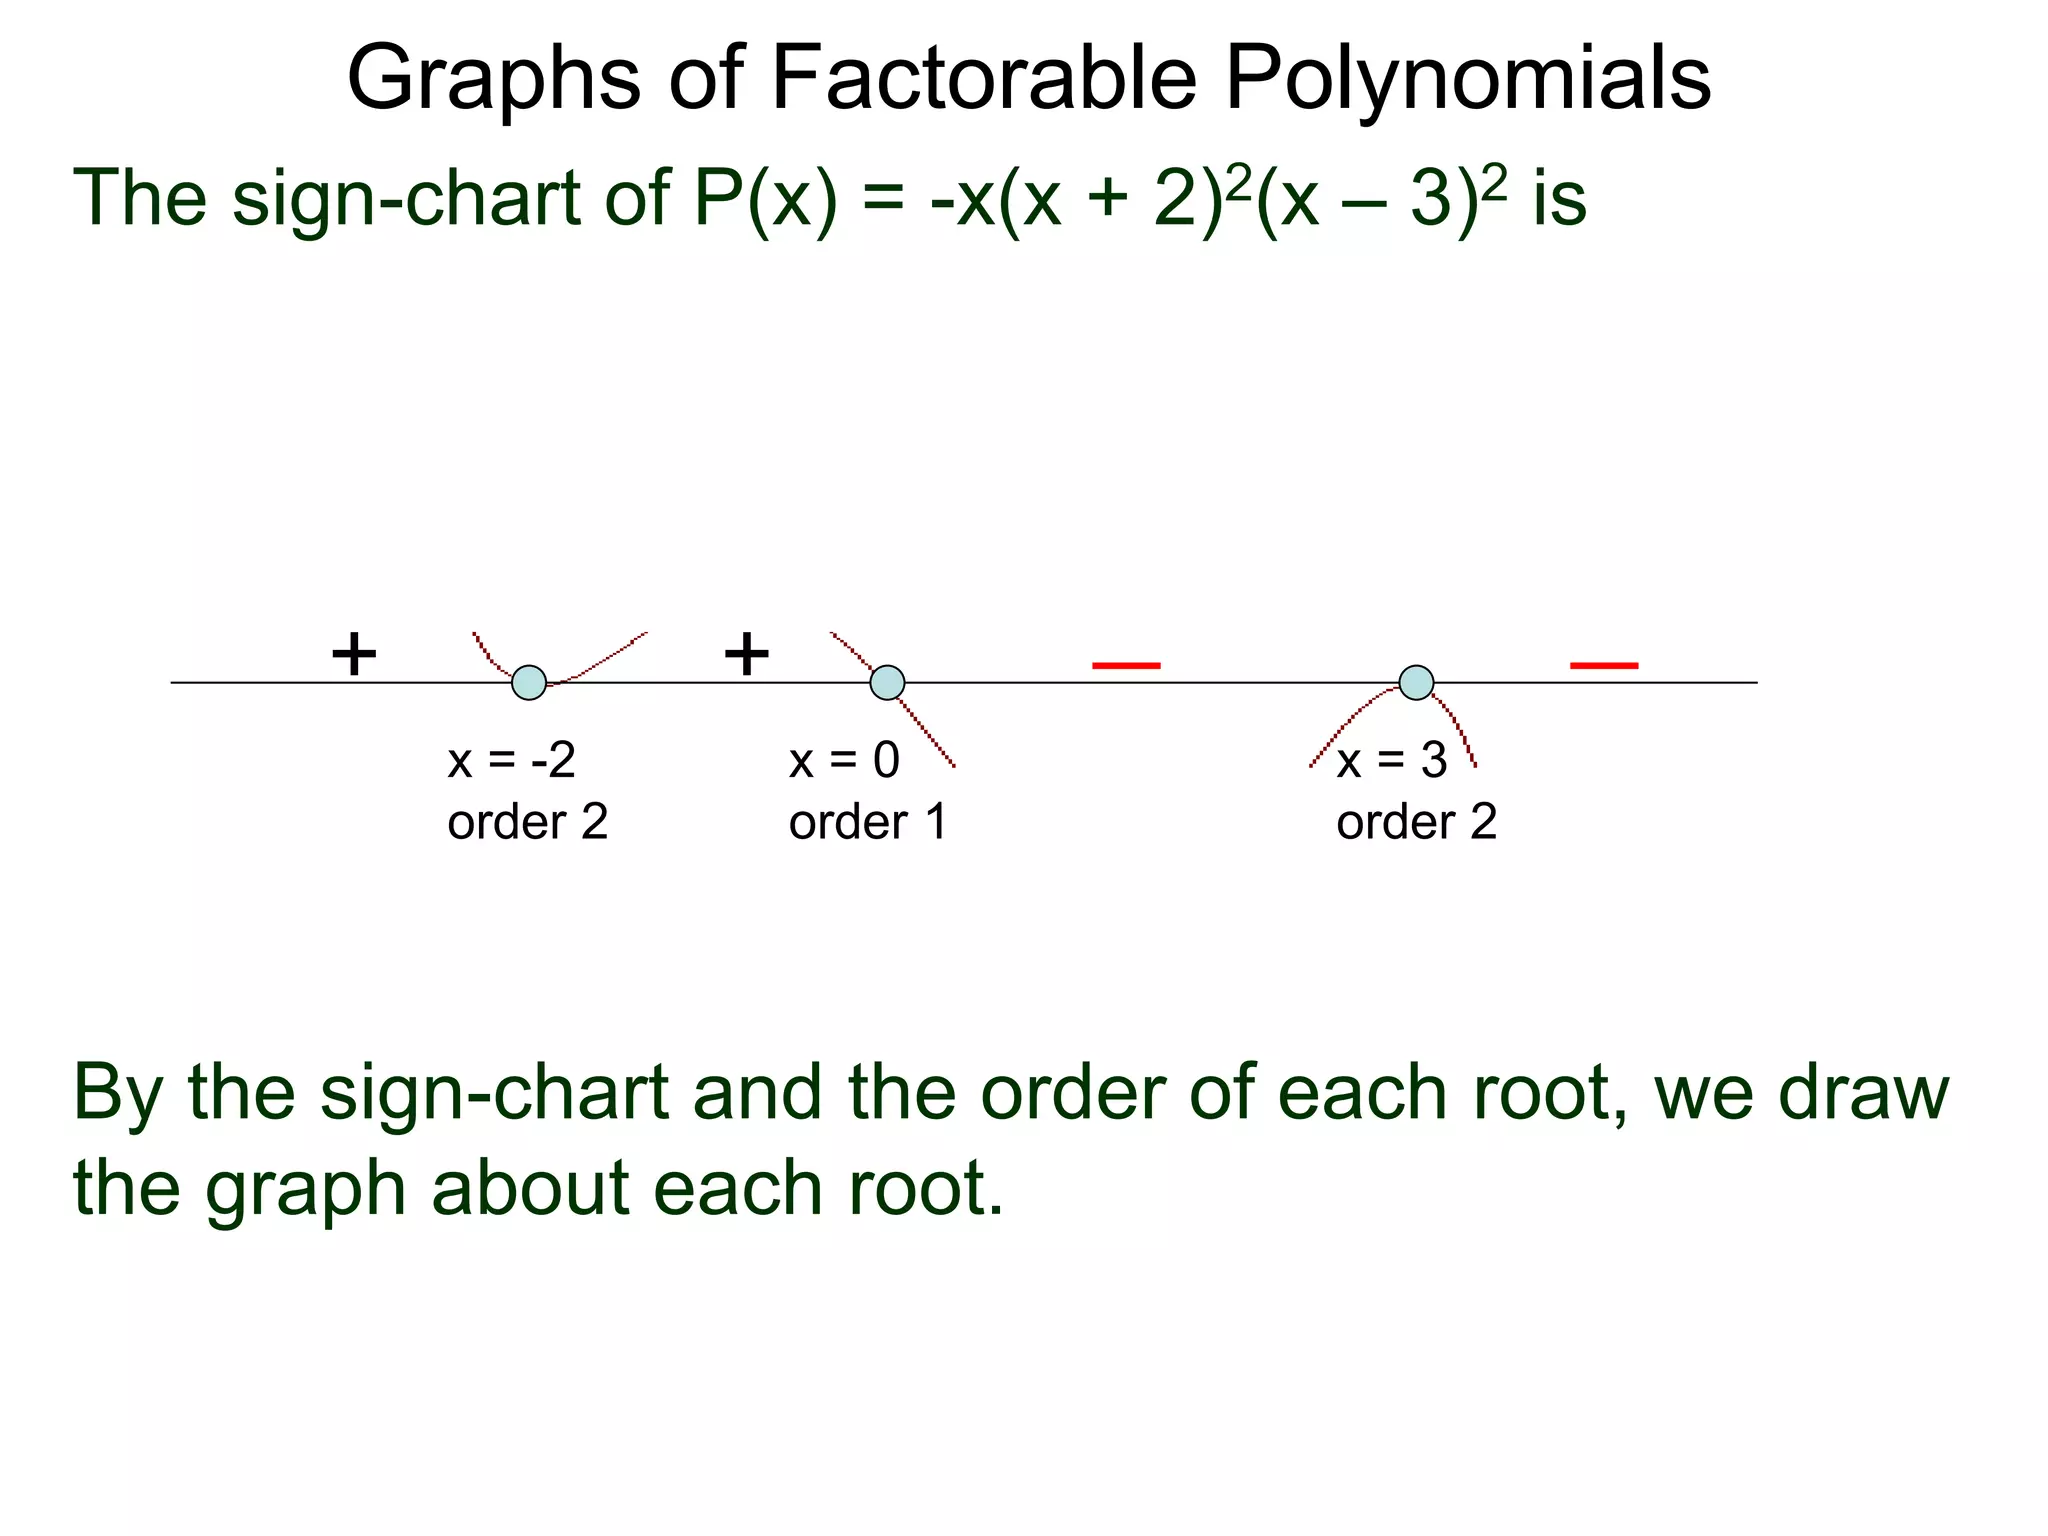
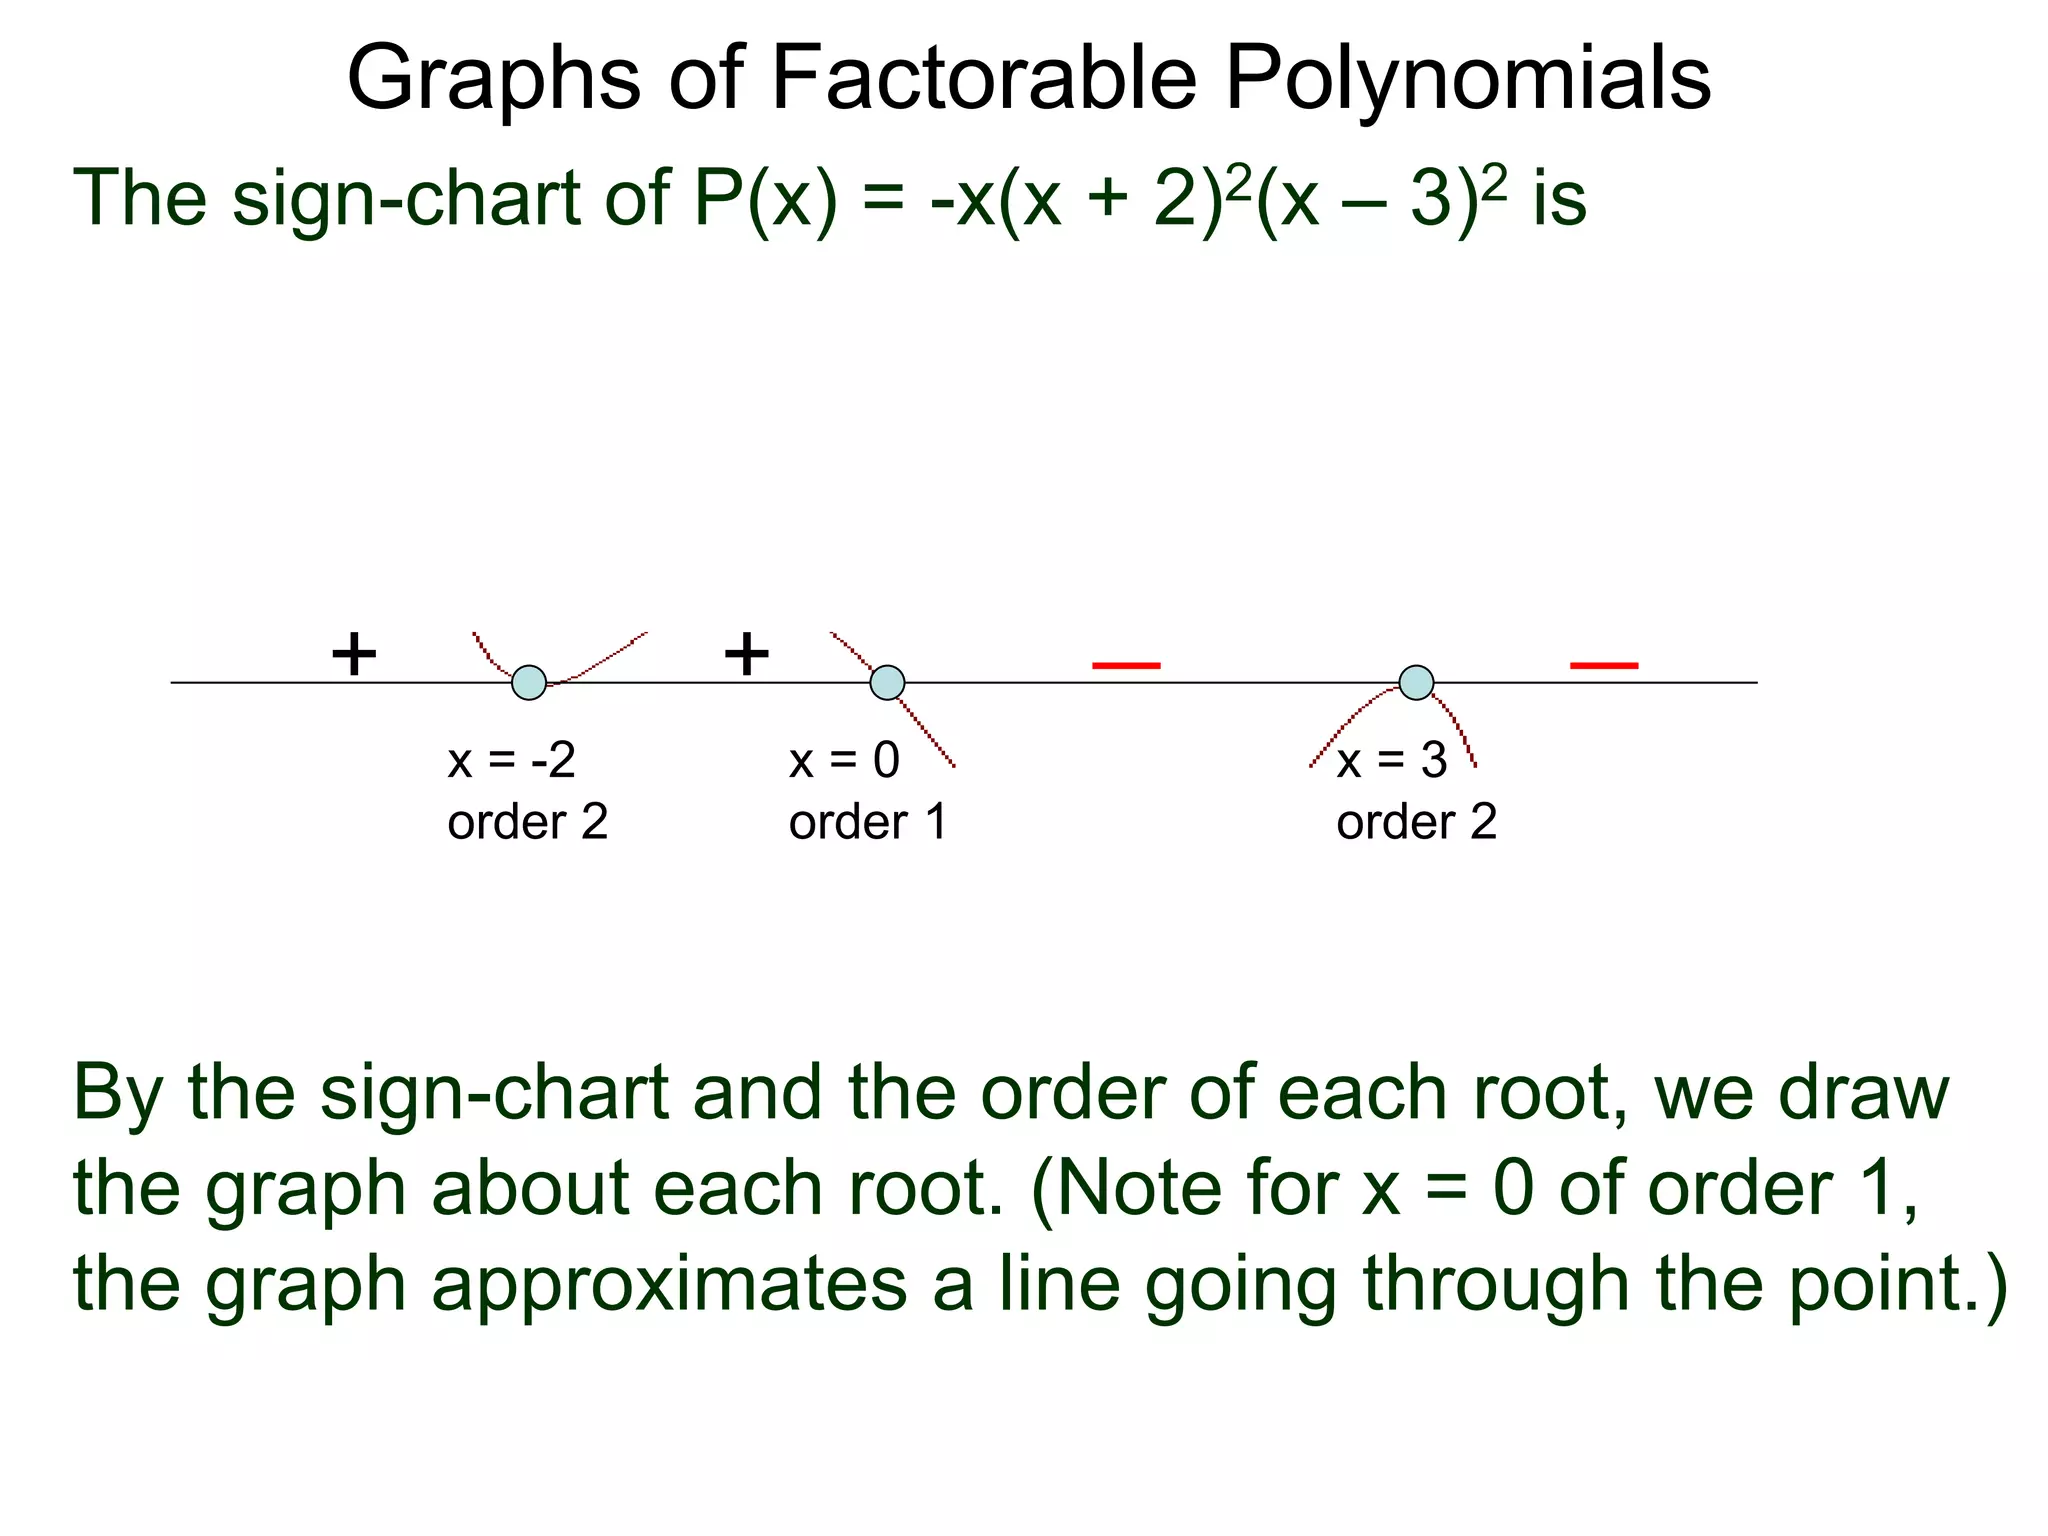
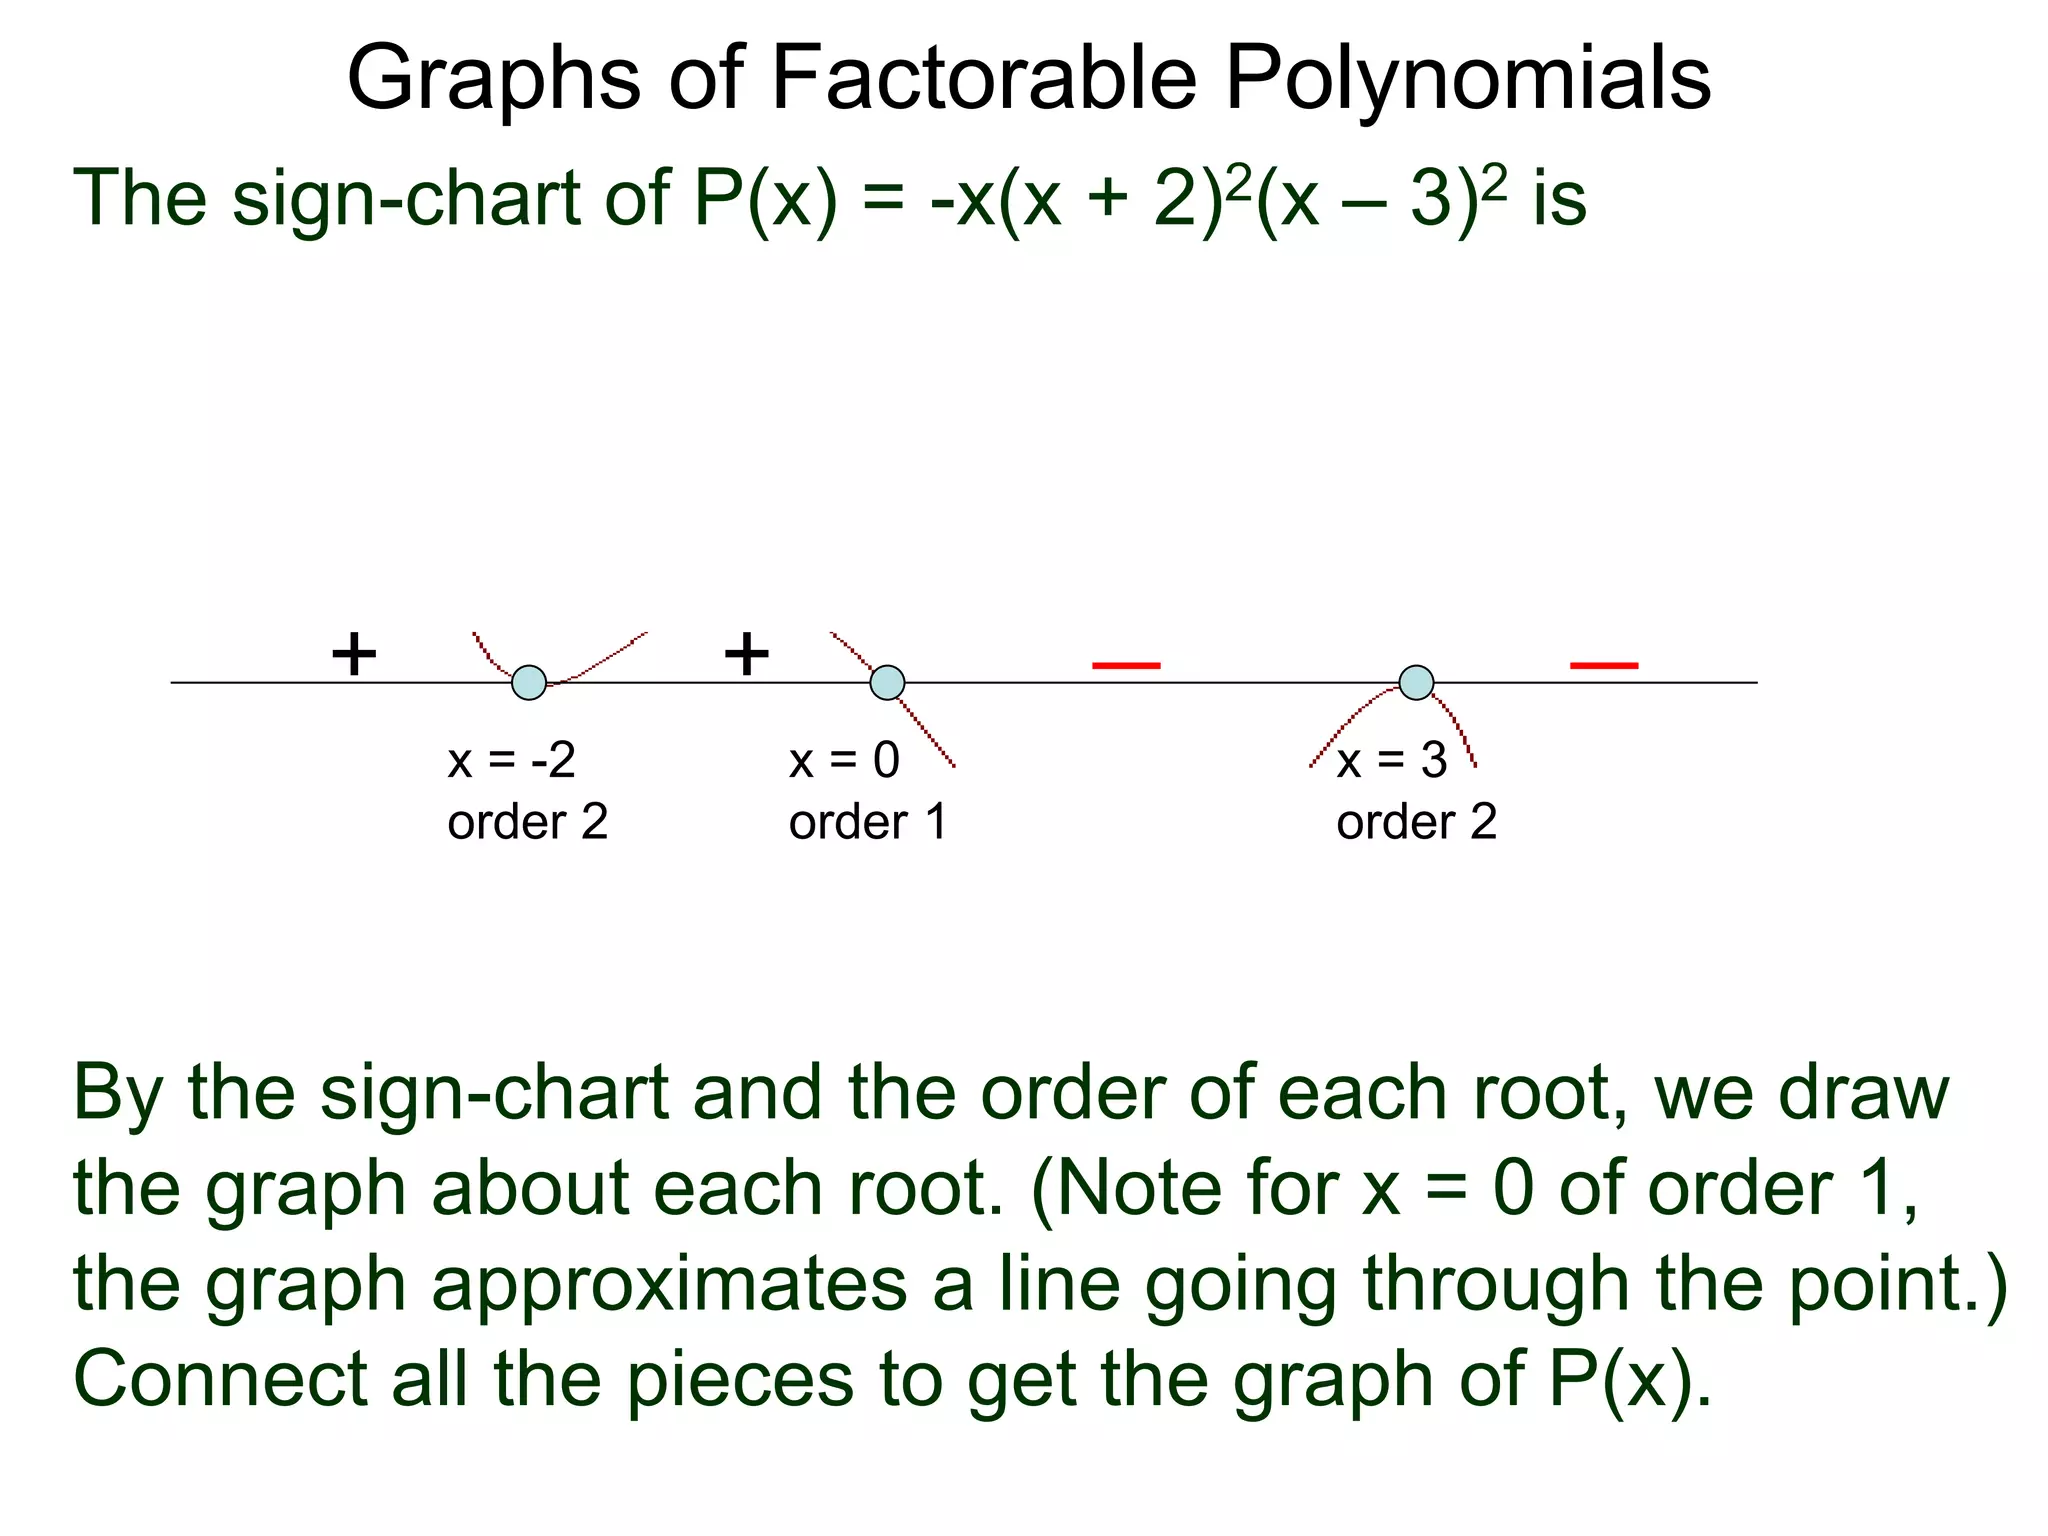
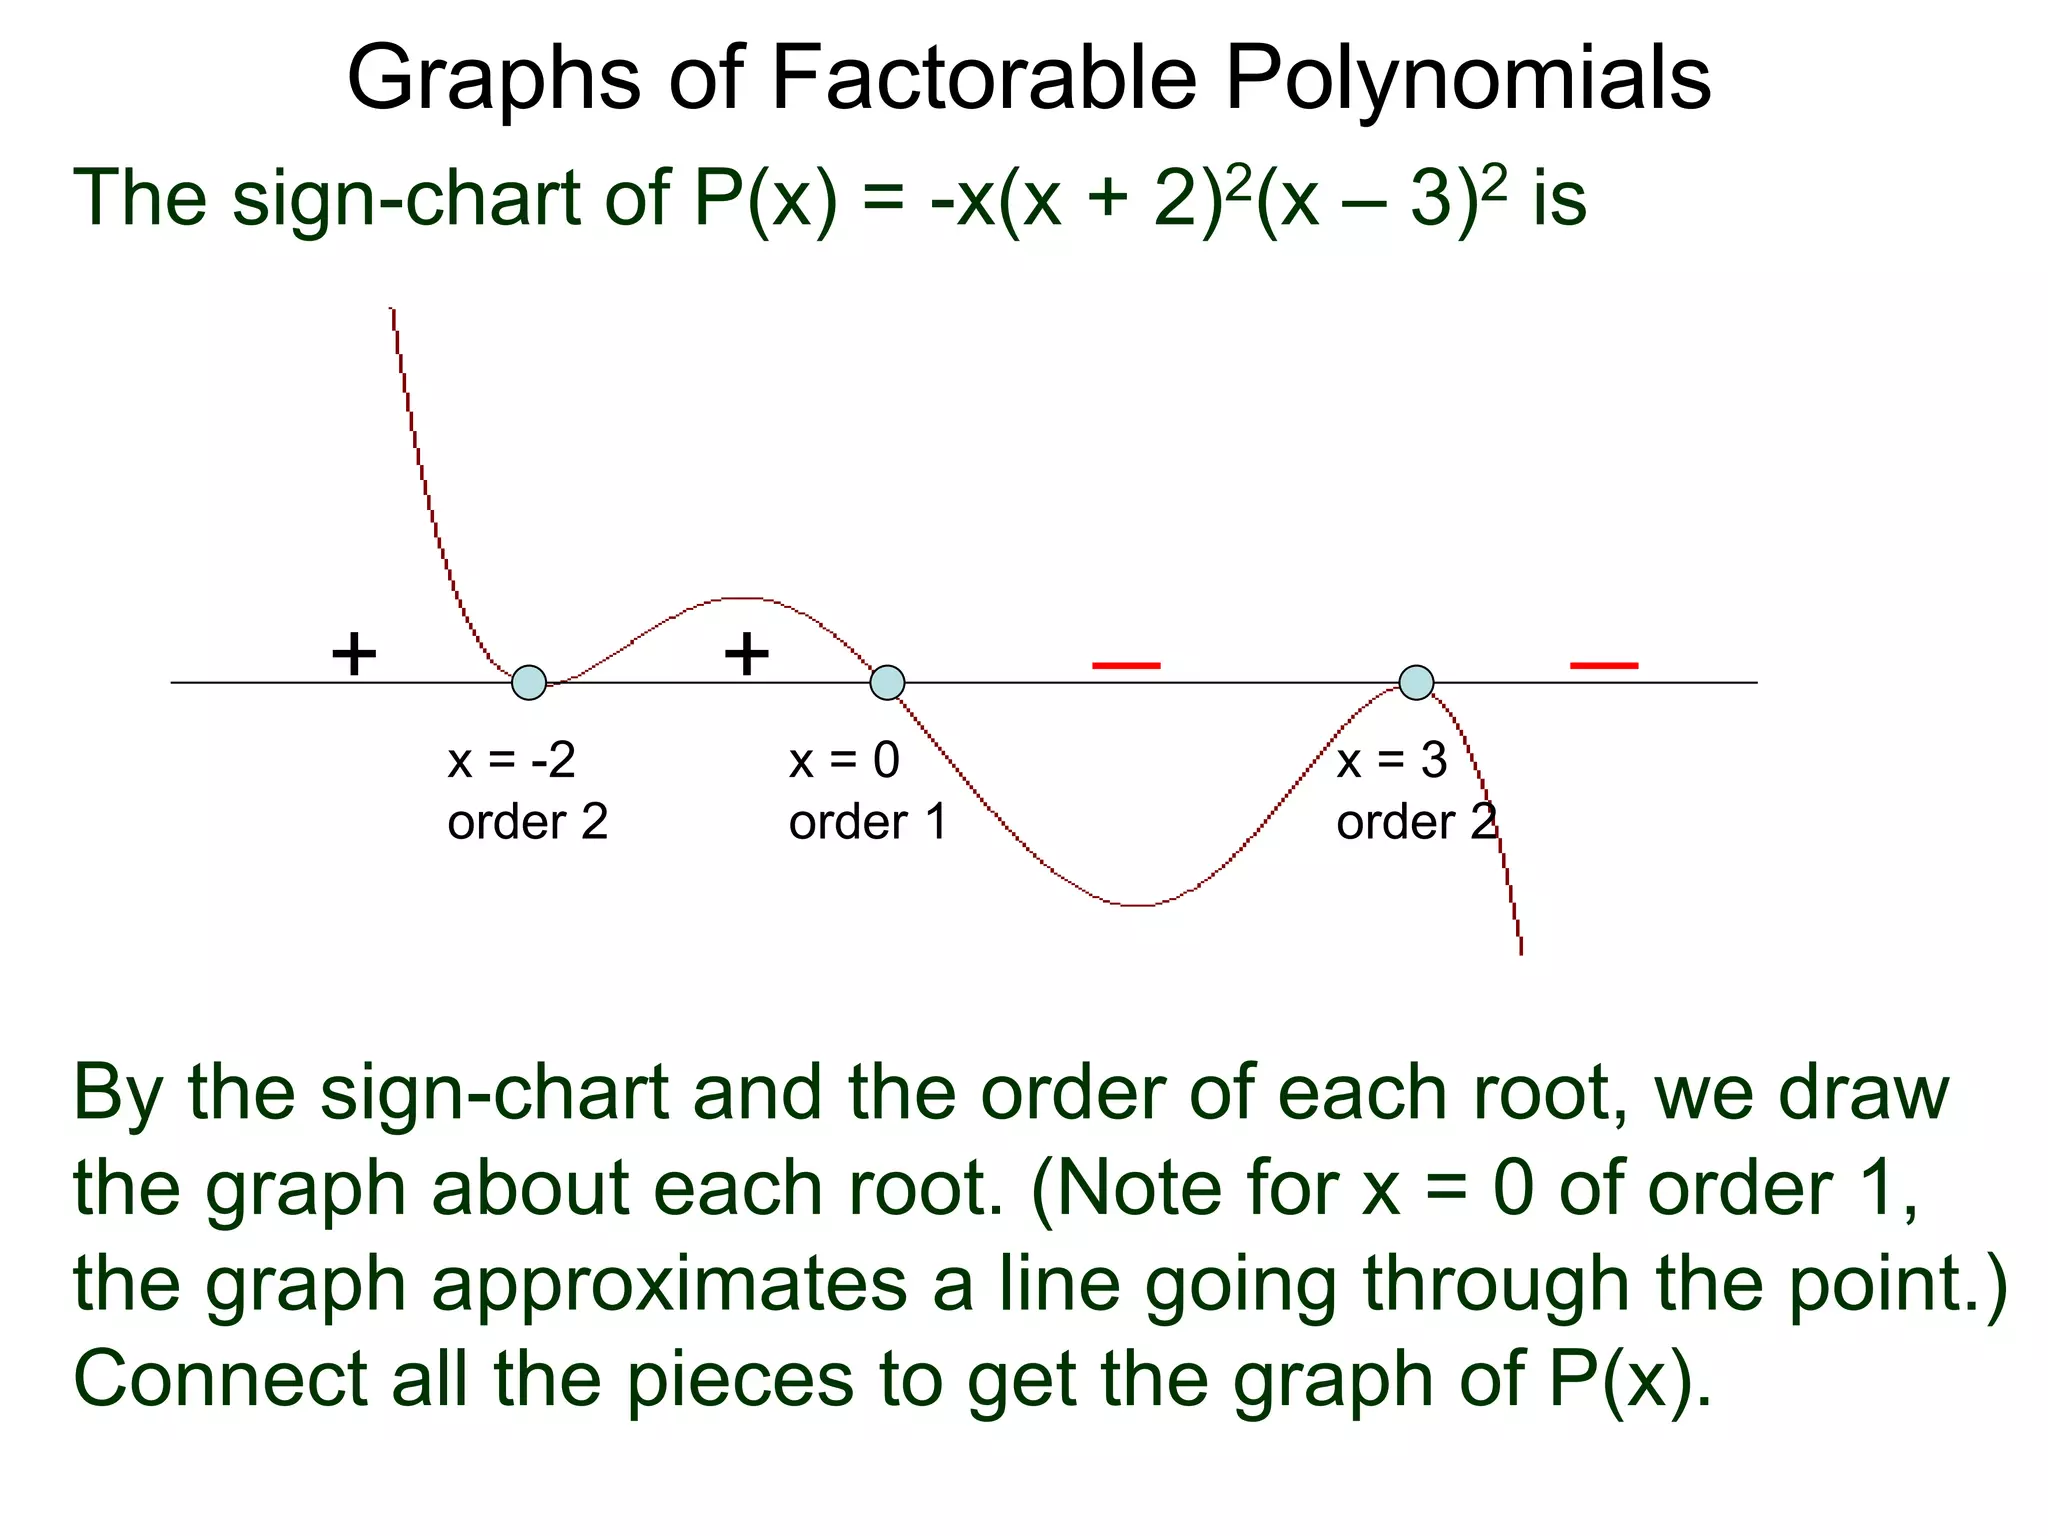
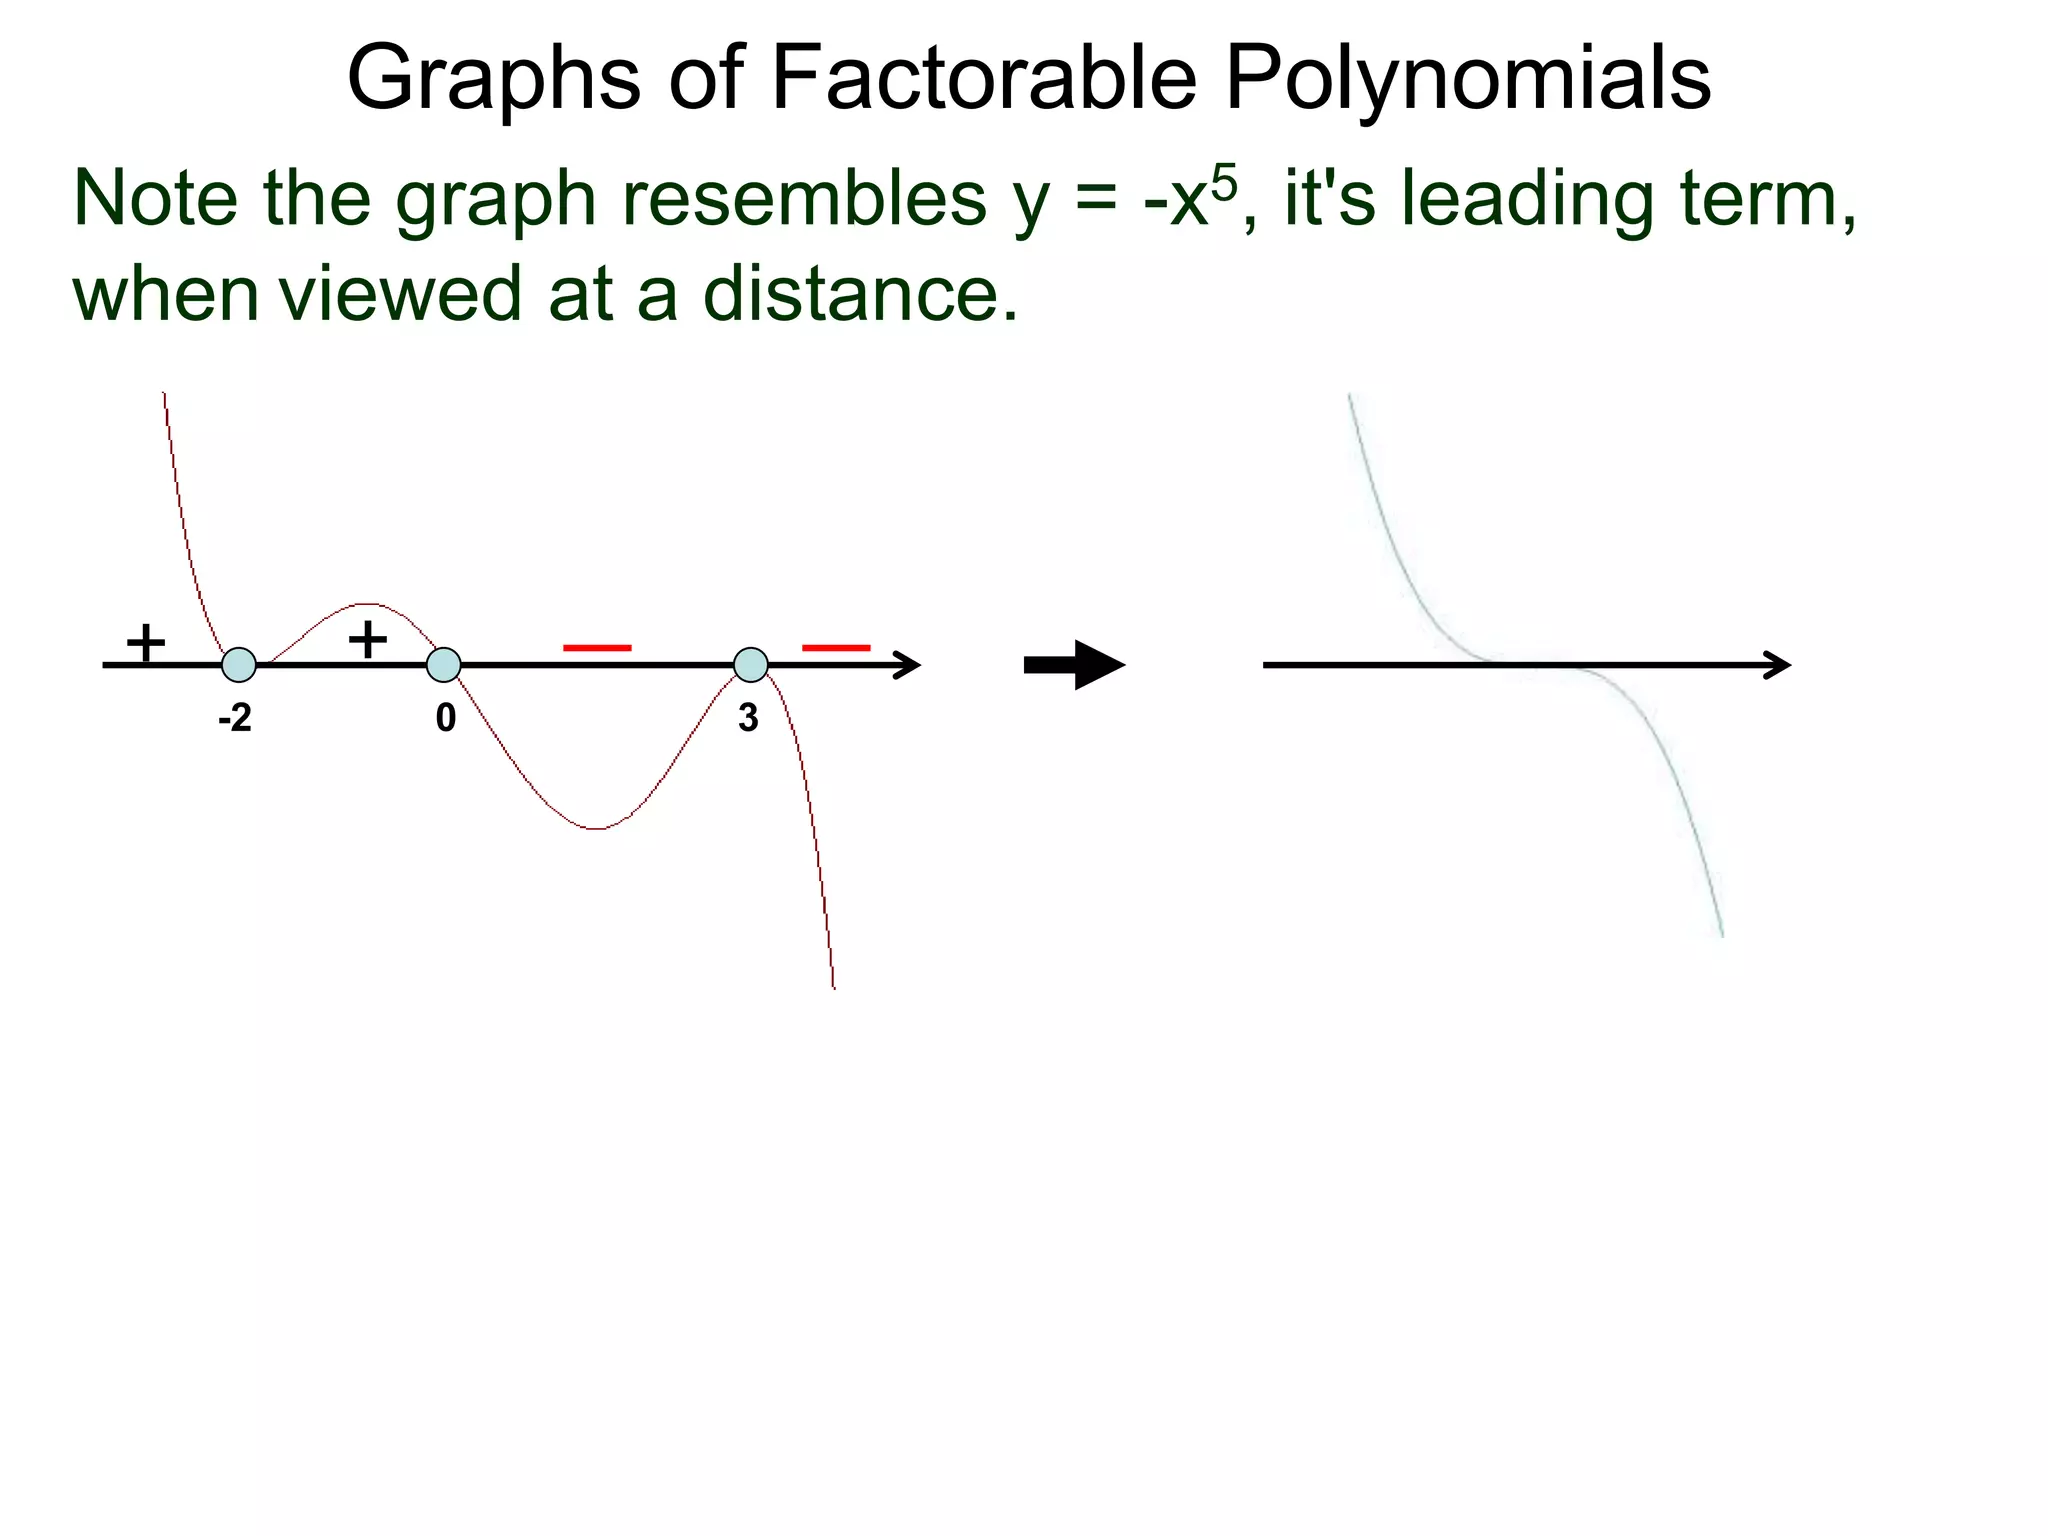
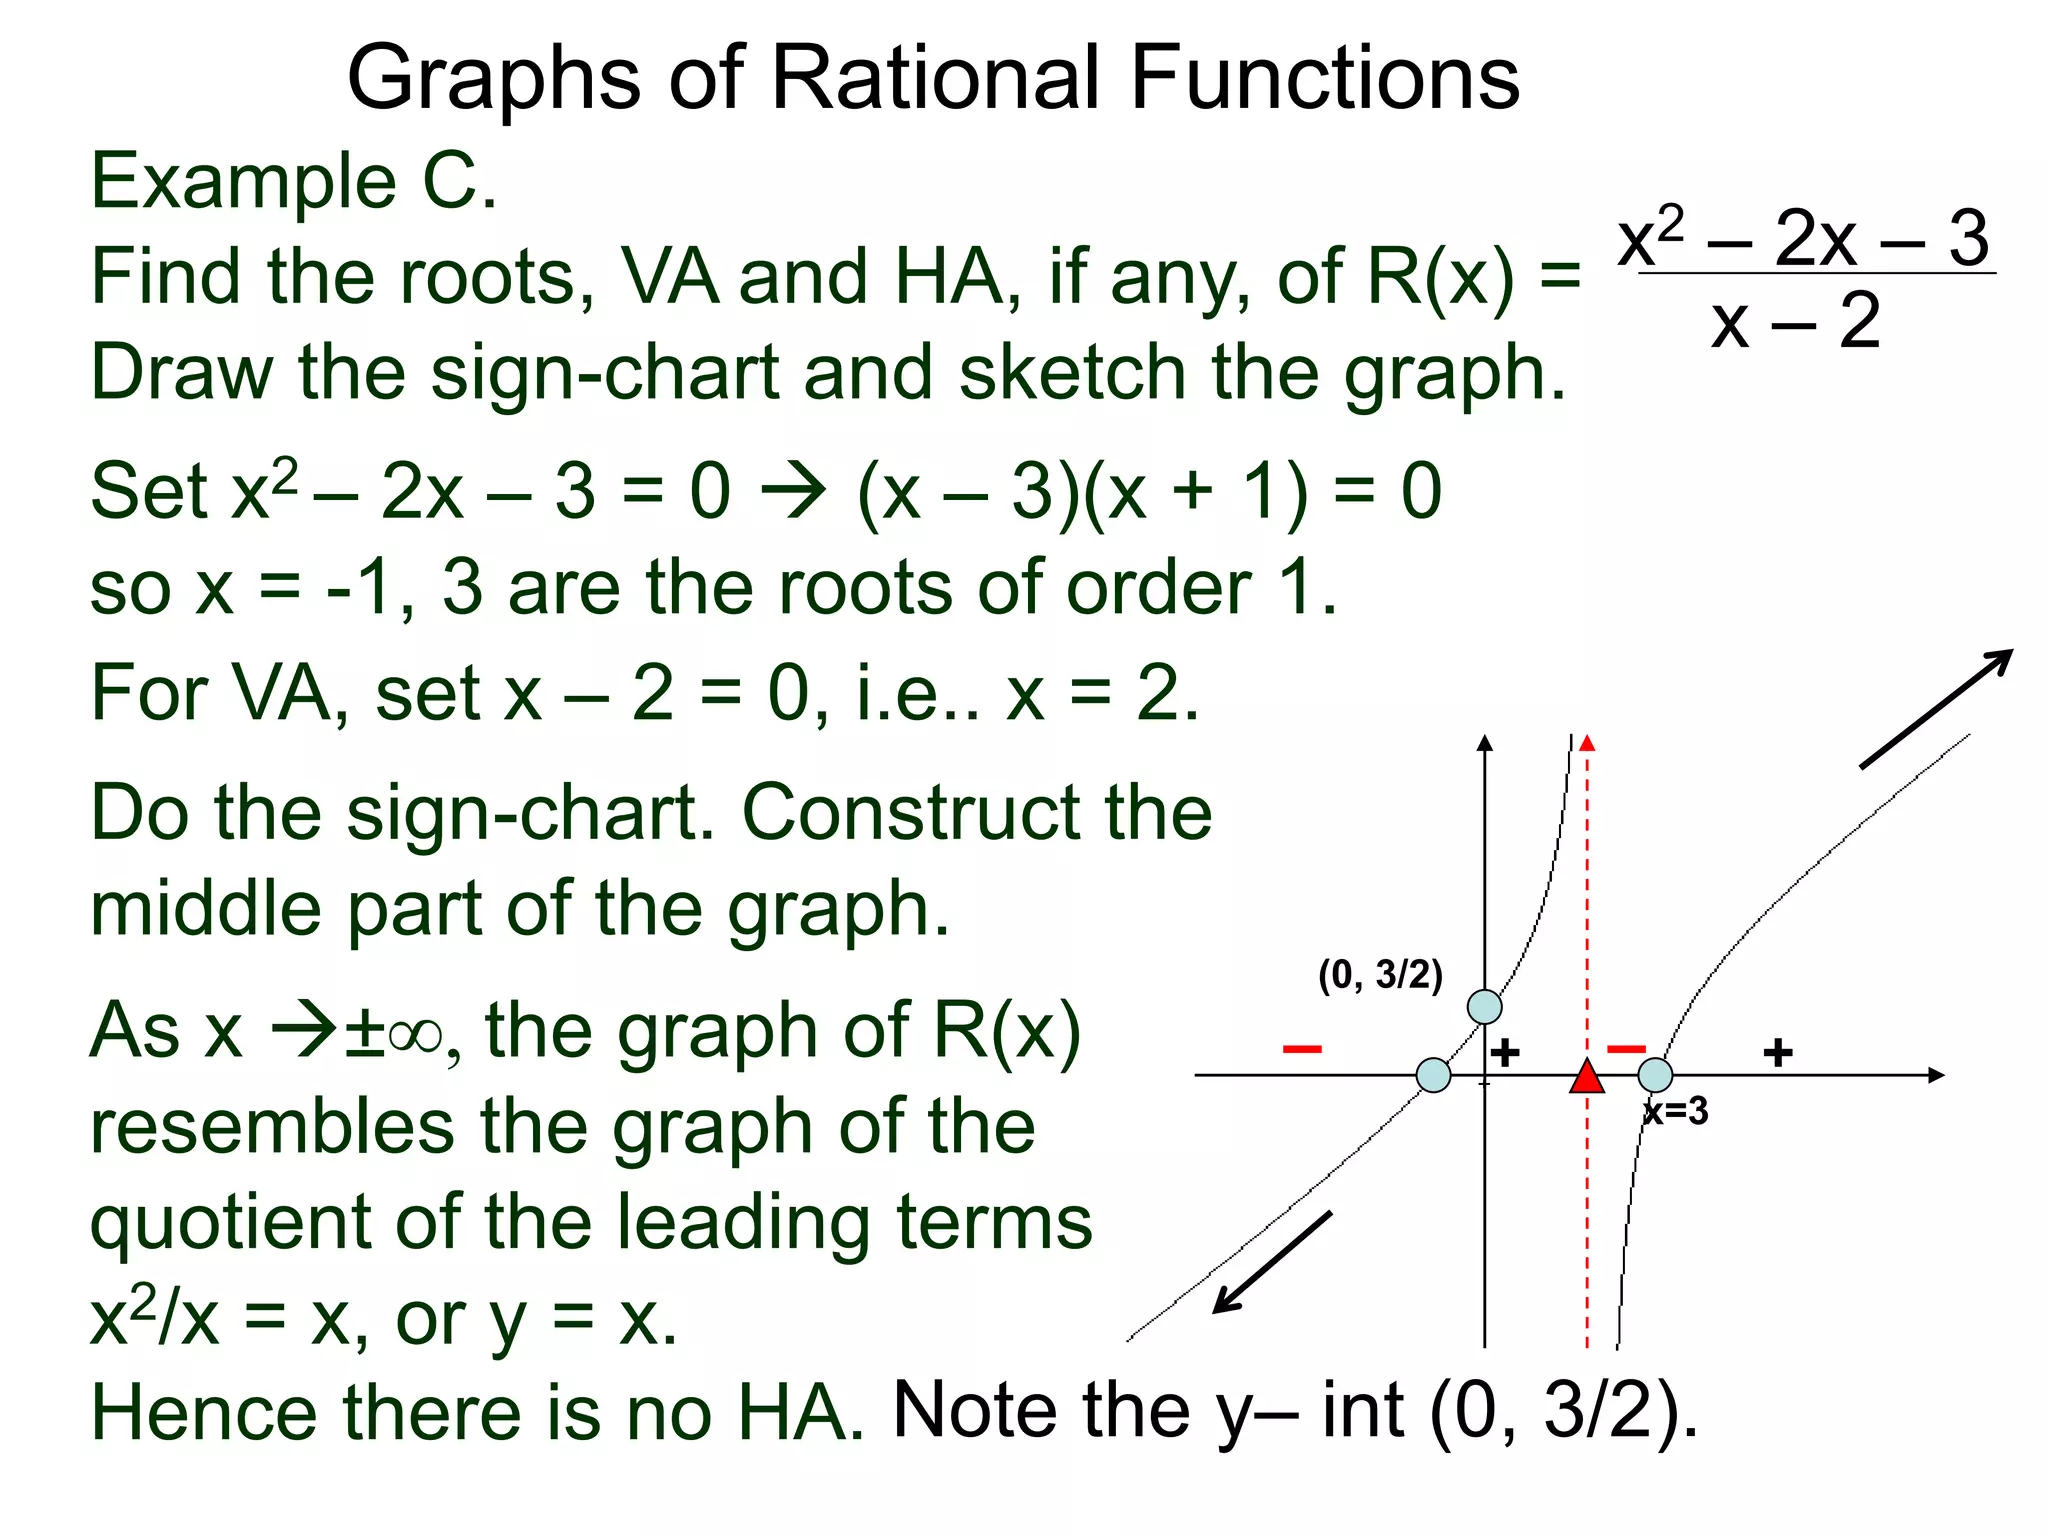
The document discusses graphs of factorable polynomials. It begins by showing examples of graphs of even and odd degree polynomials like y=x2, y=x4, y=x3, and y=-x5. It then explains that the graphs of polynomials are smooth, unbroken curves. For large values of x, the leading term of a polynomial dominates and determines the graph's behavior. Based on the leading term and whether the degree is even or odd, the graph exhibits one of four behaviors as x approaches infinity. The document demonstrates how to construct the sign chart of a polynomial from its roots and use it to sketch the central portion of the graph. It provides an example of sketching the graph of y=x


![Vibe Coding vs. Spec-Driven Development [Free Meetup]](https://cdn.slidesharecdn.com/ss_thumbnails/vibecodingvsspecdrivendevelopment-251209105622-43f455e7-thumbnail.jpg?width=640&height=640&fit=bounds)


