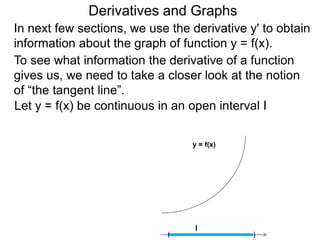
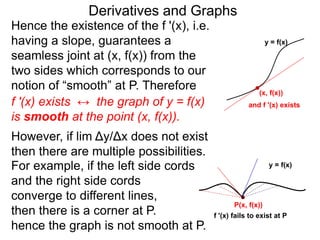
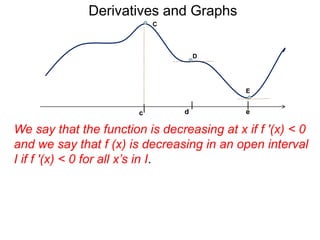
2. Derivatives and Graphs
Interval Notation
We use “(” and “)” to indicate the corresponding point is
excluded and we use “[” and “]” to for the inclusion of the point.
a < x < b
(a, b)
a b
a closed interval:
a ≤ x ≤ b
a b
a ≤ x < b
a [a, b) b
[a, b]
a < x ≤ b
a b
(a, b]
For the unbounded intervals, use “(” or “) for ±∞,
for example, “(–∞, a] or (a, ∞) are the following intervals.
x < a
(–∞, a] a
–∞
a < x
a ∞
an open interval:
half–open intervals:
3. Derivatives and Graphs
In next few sections, we use the derivative y' to obtain
information about the graph of function y = f(x).
4. Derivatives and Graphs
In next few sections, we use the derivative y' to obtain
information about the graph of function y = f(x).
To see what information the derivative of a function
gives us, we need to take a closer look at the notion
of “the tangent line”.
5. Derivatives and Graphs
In next few sections, we use the derivative y' to obtain
information about the graph of function y = f(x).
To see what information the derivative of a function
gives us, we need to take a closer look at the notion
of “the tangent line”.
Let y = f(x) be continuous in an open interval I
y = f(x)
)
I
(
6. Derivatives and Graphs
In next few sections, we use the derivative y' to obtain
information about the graph of function y = f(x).
To see what information the derivative of a function
gives us, we need to take a closer look at the notion
of “the tangent line”.
Let y = f(x) be continuous in an open interval I and
f '(x) = lim Δy/Δx exists at some generic point x in I.
y = f(x)
(x, f(x))
I
( )
7. Derivatives and Graphs
In next few sections, we use the derivative y' to obtain
information about the graph of function y = f(x).
To see what information the derivative of a function
gives us, we need to take a closer look at the notion
of “the tangent line”.
Let y = f(x) be continuous in an open interval I and
f '(x) = lim Δy/Δx exists at some generic point x in I.
y = f(x)
(x, f(x))
I
This means the slopes of
the cords on the right side
of the base point (x, f(x))
connecting to (x+h, f(x+h))
( )
8. Derivatives and Graphs
In next few sections, we use the derivative y' to obtain
information about the graph of function y = f(x).
To see what information the derivative of a function
gives us, we need to take a closer look at the notion
of “the tangent line”.
Let y = f(x) be continuous in an open interval I and
f '(x) = lim Δy/Δx exists at some generic point x in I.
This means the slopes of
the cords on the right side
of the base point (x, f(x))
connecting to (x+h, f(x+h))
y = f(x)
(x, f(x))
(x+h, f(x+h))
I
( )
9. Derivatives and Graphs
In next few sections, we use the derivative y' to obtain
information about the graph of function y = f(x).
To see what information the derivative of a function
gives us, we need to take a closer look at the notion
of “the tangent line”.
Let y = f(x) be continuous in an open interval I and
f '(x) = lim Δy/Δx exists at some generic point x in I.
This means the slopes of
the cords on the right side
of the base point (x, f(x))
connecting to (x+h, f(x+h))
y = f(x)
(x, f(x))
(x+h, f(x+h))
I
( )
10. Derivatives and Graphs
In next few sections, we use the derivative y' to obtain
information about the graph of function y = f(x).
To see what information the derivative of a function
gives us, we need to take a closer look at the notion
of “the tangent line”.
Let y = f(x) be continuous in an open interval I and
f '(x) = lim Δy/Δx exists at some generic point x in I.
This means the slopes of
the cords on the right side
of the base point (x, f(x))
connecting to (x+h, f(x+h))
y = f(x)
(x, f(x))
(x+h, f(x+h))
I
( )
11. Derivatives and Graphs
In next few sections, we use the derivative y' to obtain
information about the graph of function y = f(x).
To see what information the derivative of a function
gives us, we need to take a closer look at the notion
of “the tangent line”.
Let y = f(x) be continuous in an open interval I and
f '(x) = lim Δy/Δx exists at some generic point x in I.
This means the slopes of
the cords on the right side
of the base point (x, f(x))
connecting to (x+h, f(x+h))
y = f(x)
(x, f(x))
(x+h, f(x+h))
I
( )
12. Derivatives and Graphs
In next few sections, we use the derivative y' to obtain
information about the graph of function y = f(x).
To see what information the derivative of a function
gives us, we need to take a closer look at the notion
of “the tangent line”.
Let y = f(x) be continuous in an open interval I and
f '(x) = lim Δy/Δx exists at some generic point x in I.
This means the slopes of
the cords on the right side
of the base point (x, f(x))
connecting to (x+h, f(x+h))
goes to the same limit as
those connecting to the
left of x as h goes to 0.
y = f(x)
(x, f(x))
(x+h, f(x+h))
I
( )
13. Derivatives and Graphs
In next few sections, we use the derivative y' to obtain
information about the graph of function y = f(x).
To see what information the derivative of a function
gives us, we need to take a closer look at the notion
of “the tangent line”.
Let y = f(x) be continuous in an open interval I and
f '(x) = lim Δy/Δx exists at some generic point x in I.
This means the slopes of
the cords on the right side
of the base point (x, f(x))
connecting to (x+h, f(x+h))
goes to the same limit as
those connecting to the
left of x as h goes to 0.
y = f(x)
(x, f(x))
(x+h, f(x+h))
I
( )
14. Derivatives and Graphs
In next few sections, we use the derivative y' to obtain
information about the graph of function y = f(x).
To see what information the derivative of a function
gives us, we need to take a closer look at the notion
of “the tangent line”.
Let y = f(x) be continuous in an open interval I and
f '(x) = lim Δy/Δx exists at some generic point x in I.
This means the slopes of
the cords on the right side
of the base point (x, f(x))
connecting to (x+h, f(x+h))
goes to the same limit as
those connecting to the
left of x as h goes to 0.
y = f(x)
(x, f(x))
(x+h, f(x+h))
I
( )
15. Derivatives and Graphs
In next few sections, we use the derivative y' to obtain
information about the graph of function y = f(x).
To see what information the derivative of a function
gives us, we need to take a closer look at the notion
of “the tangent line”.
Let y = f(x) be continuous in an open interval I and
f '(x) = lim Δy/Δx exists at some generic point x in I.
This means the slopes of
the cords on the right side
of the base point (x, f(x))
connecting to (x+h, f(x+h))
goes to the same limit as
those connecting to the
left of x as h goes to 0.
y = f(x)
(x, f(x))
(x+h, f(x+h))
I
( )
16. Derivatives and Graphs
In next few sections, we use the derivative y' to obtain
information about the graph of function y = f(x).
To see what information the derivative of a function
gives us, we need to take a closer look at the notion
of “the tangent line”.
Let y = f(x) be continuous in an open interval I and
f '(x) = lim Δy/Δx exists at some generic point x in I.
This means the slopes of
the cords on the right side
of the base point (x, f(x))
connecting to (x+h, f(x+h))
goes to the same limit as
those connecting to the
left of x as h goes to 0.
y = f(x)
(x, f(x))
(x+h, f(x+h))
Cords from the right
and left merge into
one “tangent line”
I
( )
17. Derivatives and Graphs
Hence the existence of the f '(x), i.e.
having a slope, guarantees a
seamless joint at (x, f(x)) from the
two sides which corresponds to our
notion of “smooth” at P. Therefore
f '(x) exists ↔ the graph of y = f(x)
is smooth at the point (x, f(x)).
y = f(x)
(x, f(x))
and f '(x) exists
For example, if the left side cords
and the right side cords
converge to different lines,
then there is a corner at P.
hence the graph is not smooth at P.
P(x, f(x))
However, if lim Δy/Δx does not exist
then there are multiple possibilities.
y = f(x)
f '(x) fails to exist at P
18. Derivatives and Graphs
Let’s examine closer the geometry of the graph given
that f '(x) exists.
Given that f '(x) = 0, i.e. the tangent line is flat at
(x, f(x)), there are four possible shapes of y = f(x).
(x, f(x))
the graph y = f(x) crosses
the tangent line
Given that f '(x) > 0, i.e. the slope is positive at
(x, f(x)), there are four possible shapes of y = f(x).
the graph y = f(x) stays on the
same side of the tangent line
the graph y = f(x) crosses
the tangent line
the graph y = f(x) stays on the
same side of the tangent line
(x, f(x)) (x, f(x))
(x, f(x))
(x, f(x))
(x, f(x))
(x, f(x)) (x, f(x))
Draw the four possible graphs if f '(x) < 0.
19. Derivatives and Graphs
Given the graph below, we can easily identify the
points whose tangents are horizontal lines.
y = f(x)
a f
20. Derivatives and Graphs
Given the graph below, we can easily identify the
points whose tangents are horizontal lines.
y = f(x)
B
C
D
E
a f
21. Derivatives and Graphs
Given the graph below, we can easily identify the
points whose tangents are horizontal lines.
B
C
D
E
y = f(x)
a f
A point P(x, y) is a critical point if f '(x) = 0,
or that f '(x) is undefined (more on this later).
22. Derivatives and Graphs
Given the graph below, we can easily identify the
points whose tangents are horizontal lines.
B
C
D
E
y = f(x)
a f
A point P(x, y) is a critical point if f '(x) = 0,
or that f '(x) is undefined (more on this later).
The critical points where f '(x) = 0 are the “flat–points”.
23. Derivatives and Graphs
Given the graph below, we can easily identify the
points whose tangents are horizontal lines.
b
B
C
D
E
y = f(x)
a c d e f
A point P(x, y) is a critical point if f '(x) = 0,
or that f '(x) is undefined (more on this later).
The critical points where f '(x) = 0 are the “flat–points”.
So B, C, D, and E are flat (critical) points and that
f '(b) = f '(c) = .. = 0.
24. Derivatives and Graphs
y = f(x)
the absolute
maximum in
the interval (a, f) A
b
B
C
D
E
F
I
a c d e f
The point C above is the absolute maximum in the
interval I = (a, f).
25. Derivatives and Graphs
y = f(x)
the absolute
maximum in
the interval (a, f) A
b
B
C
D
E
F
I
a c d e f
The point C above is the absolute maximum in the
interval I = (a, f). Given a function y = f(x) with domain
I and that u ϵ I, we say that (u, f(u)) is an absolute
maximum in I if f(u) ≥ f(x) for all x’s in I.
26. Derivatives and Graphs
y = f(x)
the absolute
maximum in
the interval (a, f) A
b
B
C
D
E
F
I
a c d e f
The point C above is the absolute maximum in the
interval I = (a, f). Given a function y = f(x) with domain
I and that u ϵ I, we say that (u, f(u)) is an absolute
maximum in I if f(u) ≥ f(x) for all x’s in I.
An absolute maximum is not lower than any other
point on the graph.
27. Derivatives and Graphs
y = f(x)
the absolute
maximum in
the interval (a, f) A
b
B
C
D
E
F
I
a c d e f
The point C above is the absolute maximum in the
interval I = (a, f). Given a function y = f(x) with domain
I and that u ϵ I, we say that (u, f(u)) is an absolute
maximum in I if f(u) ≥ f(x) for all x’s in I.
An absolute maximum is not lower than any other
point on the graph.
y = sin(x) has infinitely
many absolute maxima.
y = sin(x)
28. b
B
C
D
E
A
a c d e f
F
Derivatives and Graphs
However if the graph continues on and C is not the
overall highest point, than we say C is a “local”
maximum as shown here.
C
a f
the absolute
maximum in
the interval (a, f)
y = f(x)
29. b
B
C
D
E
A
a c d e f
F
Derivatives and Graphs
However if the graph continues on and C is not the
overall highest point, than we say C is a “local”
maximum as shown here.
C
a f
g
the absolute
maximum in
the interval (a, f)
the graph is
higher here
y = f(x)
30. b
B
C
D
E
A
a c d e f
F
Derivatives and Graphs
However if the graph continues on and C is not the
overall highest point, than we say C is a “local”
maximum as shown here.
C
a local
maximum
in the interval (a, g)
a f
g
the absolute
maximum in
the interval (a, f)
the graph is
higher here
y = f(x)
31. b
B
C
D
E
A
a c d e f
F
Derivatives and Graphs
However if the graph continues on and C is not the
overall highest point, than we say C is a “local”
maximum as shown here. In general, we say that
(u, f(u)) is a local maximum if
C
f(u) ≥ f(x) for all x’s in some
open neighborhood N in the
a local
maximum
domain as shown here.
in the interval (a, g)
N g
a f
the absolute
maximum in
the interval (a, f)
the graph is
higher here
y = f(x)
32. b
B
C
D
the absolute
minimum
at x = e
E
y = f(x)
A
a c d e f
F
Derivatives and Graphs
The point E above is the absolute minimum in (a, f).
33. b
B
C
D
the absolute
minimum
at x = e
E
y = f(x)
A
a c d e f
F
Derivatives and Graphs
The point E above is the absolute minimum in (a, f).
Similarly we say that (v, f(v)) is an absolute minimum
if f(x) ≥ f(v) for all x’s in the domain I.
34. b
B
C
D
the absolute
minimum
at x = e
E
y = f(x)
A
a c d e f
F
Derivatives and Graphs
The point E above is the absolute minimum in (a, f).
Similarly we say that (v, f(v)) is an absolute minimum
if f(x) ≥ f(v) for all x’s in the domain I.
An absolute minimum is not
lower than any other point
on the graph.
35. b
B
C
D
the absolute
minimum
at x = e
E
y = f(x)
A
a c d e f
F
Derivatives and Graphs
The point E above is the absolute minimum in (a, f).
Similarly we say that (v, f(v)) is an absolute minimum
if f(x) ≥ f(v) for all x’s in the domain I.
y = tan(x)
An absolute minimum is not
lower than any other point
on the graph. Note that y = tan(x)
does not have any extremum in the
interval (–π/2, π/2).
–π/2 π/2
36. Derivatives and Graphs
b
B
A
a
E
e f
F
C
c
We say that the function is increasing at x if f '(x) > 0
and we say that f (x) is increasing in an open interval I
if f '(x) > 0 for all x’s in I.
37. Derivatives and Graphs
b
B
increasing
A
a
E
e f
F
C
c
We say that the function is increasing at x if f '(x) > 0
and we say that f (x) is increasing in an open interval I
if f '(x) > 0 for all x’s in I.
The curve above is increasing in (a, b),
38. Derivatives and Graphs
increasing
b
B
increasing
A
a
increasing
E
e f
F
C
c
We say that the function is increasing at x if f '(x) > 0
and we say that f (x) is increasing in an open interval I
if f '(x) > 0 for all x’s in I.
The curve above is increasing in (a, b), (b, c) and (e, f).
39. Derivatives and Graphs
increasing
b
B
increasing
A
a
increasing
E
e f
F
C
u < v c
We say that the function is increasing at x if f '(x) > 0
and we say that f (x) is increasing in an open interval I
if f '(x) > 0 for all x’s in I.
The curve above is increasing in (a, b), (b, c) and (e, f).
If f(x) is increasing in an interval I, and u, v are any
two points in I with u < v,
40. Derivatives and Graphs
increasing
b
B
increasing
A
a
increasing
E
e f
F
C
f(u)< f(v)
u < v c
We say that the function is increasing at x if f '(x) > 0
and we say that f (x) is increasing in an open interval I
if f '(x) > 0 for all x’s in I.
The curve above is increasing in (a, b), (b, c) and (e, f).
If f(x) is increasing in an interval I, and u, v are any
two points in I with u < v, then f(u) < f(v).
41. Derivatives and Graphs
increasing
b
B
increasing
A
a
increasing
E
e f
F
C
f(u)< f(v)
u < v c
We say that the function is increasing at x if f '(x) > 0
and we say that f (x) is increasing in an open interval I
if f '(x) > 0 for all x’s in I.
The curve above is increasing in (a, b), (b, c) and (e, f).
If f(x) is increasing in an interval I, and u, v are any
two points in I with u < v, then f(u) < f(v). We say that
f(x) is non–decreasing if f(u) ≤ f(v) for any u < v.
42. Derivatives and Graphs
C
c
D
E
d e
We say that the function is decreasing at x if f '(x) < 0
and we say that f (x) is decreasing in an open interval
I if f '(x) < 0 for all x’s in I.
43. Derivatives and Graphs
decreasing
C decreasing
c
D
E
d e
We say that the function is decreasing at x if f '(x) < 0
and we say that f (x) is decreasing in an open interval
I if f '(x) < 0 for all x’s in I.
The curve above is decreasing in (c, d), and (d, e).
44. Derivatives and Graphs
decreasing
C decreasing
c
D
E
f(u) > f(v)
d u < v
e
We say that the function is decreasing at x if f '(x) < 0
and we say that f (x) is decreasing in an open interval
I if f '(x) < 0 for all x’s in I.
The curve above is decreasing in (c, d), and (d, e).
If f(x) is decreasing in an interval I, and u, v are any
two points in I with u < v, then f(u) > f(v).
45. Derivatives and Graphs
decreasing
C decreasing
c
D
E
f(u) > f(v)
d u < v
e
We say that the function is decreasing at x if f '(x) < 0
and we say that f (x) is decreasing in an open interval
I if f '(x) < 0 for all x’s in I.
The curve above is decreasing in (c, d), and (d, e).
If f(x) is decreasing in an interval I, and u, v are any
two points in I with u < v, then f(u) > f(v). We say that
f(x) is non–increasing if f(u) ≥ f(v) for any u < v.
46. Derivatives and Graphs
Summary of the graphs given the sign of f '(x).
f '(x) = slope = 0 max, min, flat–landing point
(x, f(x))
Draw them.
(x, f(x)) (x, f(x))
(x, f(x))
f '(x) = slope > 0 increasing, going uphill
(x, f(x))
(x, f(x))
(x, f(x)) (x, f(x))
f '(x) = slope < 0 decreasing, going downhill
Let’s apply the above observations to the monomial
functions y = xN where N = 2,3,4..
47. Derivatives and Graphs
The graphs y = xeven
The derivative of y = xeven
is y' = #xodd. So if x < 0,
y' < 0, the function is
decreasing, and if x > 0,
y > 0 and y is increasing.
y = x6 y = x4 y = x2
(-1, 1) (1, 1)
y' < 0 y' > 0
(0,0)
(0, 0) is the absolute min.
48. Derivatives and Graphs
The graphs y = xodd
The graphs y = xeven
The derivative of y = xeven
is y' = #xodd. So if x < 0,
y' < 0, the function is
decreasing, and if x > 0,
y > 0 and y is increasing.
The derivative of y = xodd
is y' = #xeven.
For x ≠ 0, y' > 0, so the
function is increasing
where x ≠ 0.
y = x5
y = x3
y = x7
(1, 1)
(-1, -1)
y = x6 y = x4 y = x2
(-1, 1) (1, 1)
(0,0)
y' < 0 y' > 0
(0,0)
y' > 0 except at
y'(0) = 0
(0, 0) is the absolute min. (0, 0) is a flat–landing.
50. Derivatives and Graphs
Here are the general steps for graphing.
Steps 1 and 2 do not require calculus.
1. Determine the domain of f(x) and the behavior of
y as x approaches the boundary of the domain.
2. Use the roots and asymptotes to make the
sign–chart and determine the general shape of
the graph.
51. Derivatives and Graphs
Here are the general steps for graphing.
Steps 1 and 2 do not require calculus.
1. Determine the domain of f(x) and the behavior of
y as x approaches the boundary of the domain.
2. Use the roots and asymptotes to make the
sign–chart and determine the general shape of
the graph.
Step 3 and 4 uses the 1st derivative of f(x).
3. Find the derivative f '(x), use the roots of f '(x) = 0
to find the extrema and flat–points.
4. Make the sign–chart of f '(x) to determine the terrain
of y = f (x), i.e. the graph is going uphill where f '(x) > 0
and downhill where f '(x) < 0.
52. Derivatives and Graphs
The domain of polynomials is the set of all real
numbers. Polynomial graphs are smooth everywhere
because derivatives of polynomials are well defined
polynomials.
53. Derivatives and Graphs
The domain of polynomials is the set of all real
numbers. Polynomial graphs are smooth everywhere
because derivatives of polynomials are well defined
polynomials.
Example A. Graph y = 9x – x3. Find the locations of
the extrema, the flat points and classify them.
For what x values is y increasing and for what x
values is y decreasing?
54. Derivatives and Graphs
The domain of polynomials is the set of all real
numbers. Polynomial graphs are smooth everywhere
because derivatives of polynomials are well defined
polynomials.
Example A. Graph y = 9x – x3. Find the locations of
the extrema, the flat points and classify them.
For what x values is y increasing and for what x
values is y decreasing?
We start by factoring to locate the roots.
9x – x3 = x(3 – x)(3 + x),
hence x = 0, 3, –3 are the
roots and each is of order 1.
55. Derivatives and Graphs
The domain of polynomials is the set of all real
numbers. Polynomial graphs are smooth everywhere
because derivatives of polynomials are well defined
polynomials.
Example A. Graph y = 9x – x3. Find the locations of
the extrema, the flat points and classify them.
For what x values is y increasing and for what x
values is y decreasing?
We start by factoring to locate the roots.
9x – x3 = x(3 – x)(3 + x),
hence x = 0, 3, –3 are the
roots and each is of order 1.
The sign–chart and the
graph of f(x) is shown here.
56. Derivatives and Graphs
The domain of polynomials is the set of all real
numbers. Polynomial graphs are smooth everywhere
because derivatives of polynomials are well defined
polynomials.
Example A. Graph y = 9x – x3. Find the locations of
the extrema, the flat points and classify them.
For what x values is y increasing and for what x
values is y decreasing?
We start by factoring to locate the roots.
9x – x3 = x(3 – x)(3 + x),
hence x = 0, 3, –3 are the
roots and each is of order 1.
The sign–chart and the
graph of f(x) is shown here.
x
y
+ – + –
–3 0 3
y = 9x – x3
57. Derivatives and Graphs
The domain of polynomials is the set of all real
numbers. Polynomial graphs are smooth everywhere
because derivatives of polynomials are well defined
polynomials.
Example A. Graph y = 9x – x3. Find the locations of
the extrema, the flat points and classify them.
For what x values is y increasing and for what x
values is y decreasing?
We start by factoring to locate the roots.
x
y
+ – + –
–3 0 3
y = 9x – x3
9x – x3 = x(3 – x)(3 + x),
hence x = 0, 3, –3 are the
roots and each is of order 1.
The sign–chart and the
graph of f(x) is shown here.
58. Derivatives and Graphs
The derivative is y' = (9x – x3)' = 9 – 3x2.
x
y
y = 9x – x3
+ – + –
–3 0 3
59. Derivatives and Graphs
The derivative is y' = (9x – x3)' = 9 – 3x2.
Set y' = 9 – 3x2 = 3(3 – x2) = 0 x = ±√3
x
y
y = 9x – x3
+ – + –
–3 0 3
60. Derivatives and Graphs
The derivative is y' = (9x – x3)' = 9 – 3x2
Set y' = 9 – 3x2 = 3(3 – x2) = 0 x = ±√3
x
y
+ – + –
–3 0 3
the corresponding points
on the graphs are
(√3, 9√3 – (√3)3)
= (√3, 6√3) and
(–√3, –6√3) which are
the unique local max.
and the local min.
respectively.
y = 9x – x3
61. Derivatives and Graphs
The derivative is y' = (9x – x3)' = 9 – 3x2
Set y' = 9 – 3x2 = 3(3 – x2) = 0 x = ±√3
x
y
+ – + –
–3 0 3
the corresponding points
on the graphs are
(√3, 9√3 – (√3)3)
= (√3, 6√3) and
(–√3, –6√3) which are
the unique local max.
and the local min.
respectively.
y = 9x – x3
(√3, 6√3)
(–√3, –6√3)
Label these points
on the graph.
62. Derivatives and Graphs
The derivative is y' = (9x – x3)' = 9 – 3x2
Set y' = 9 – 3x2 = 3(3 – x2) = 0 x = ±√3
is shown below the graph.
x
y
+ – + –
–3 0 3
the corresponding points
on the graphs are
(√3, 9√3 – (√3)3)
= (√3, 6√3) and
(–√3, –6√3) which are
the unique local max.
and the local min.
respectively.
y = 9x – x3
(√3, 6√3)
(–√3, –6√3)
Label these points
on the graph. The sign–chart of the
y' = 9 – 3x2 = 3(3 – x2) = 3(x – √3)(x + √3)
63. Derivatives and Graphs
The derivative is y' = (9x – x3)' = 9 – 3x2
Set y' = 9 – 3x2 = 3(3 – x2) = 0 x = ±√3
is shown below the graph.
x
y
+ – + –
–3 0 3
the corresponding points
on the graphs are
(√3, 9√3 – (√3)3)
= (√3, 6√3) and
(–√3, –6√3) which are
the unique local max.
and the local min.
respectively.
y = 9x – x3
(√3, 6√3)
(–√3, –6√3)
–√3 √3
Label these points
on the graph. The sign–chart of the
y' = 9 – 3x2 = 3(3 – x2) = 3(x – √3)(x + √3)
y' = -3(x–√3)(x+√3)
64. Derivatives and Graphs
The derivative is y' = (9x – x3)' = 9 – 3x2
Set y' = 9 – 3x2 = 3(3 – x2) = 0 x = ±√3
is shown below the graph.
x
y
+ – + –
–3 0 3
the corresponding points
on the graphs are
(√3, 9√3 – (√3)3)
= (√3, 6√3) and
(–√3, –6√3) which are
the unique local max.
and the local min.
respectively.
y = 9x – x3
(√3, 6√3)
(–√3, –6√3)
–√3 √3
Label these points
on the graph. The sign–chart of the
y' = 9 – 3x2 = 3(3 – x2) = 3(x – √3)(x + √3)
y' = -3(x–√3)(x+√3)
y' is +
uphill
y' is –
downhill
y' is –
downhill
65. Derivatives and Graphs
At a maximum point the graph must be
changing from going uphill to going downhill
Max
up down
66. Derivatives and Graphs
At a maximum point the graph must be
changing from going uphill to going downhill
and at the minimum point it must be changing
from going downhill to uphill.
Max
up down
down up
Min
67. Derivatives and Graphs
At a maximum point the graph must be
changing from going uphill to going downhill
and at the minimum point it must be changing
from going downhill to uphill. Hence the signs
of the y' must change at these critical points.
Max
up down
down up
Min
68. Derivatives and Graphs
Max
up down
At a maximum point the graph must be
changing from going uphill to going downhill
and at the minimum point it must be changing
from going downhill to uphill. Hence the signs
of the y' must change at these critical points.
Both f(x) = x3(3 – x)(3 + x) = x3(9 – x2) = 9x3 – x5 and
g(x) = x(9 – x2) have the same sign–chart so both
graphs are similar.
down up
Min
69. Derivatives and Graphs
At a maximum point the graph must be
changing from going uphill to going downhill
and at the minimum point it must be changing
from going downhill to uphill. Hence the signs
of the y' must change at these critical points.
up down
down up
Both f(x) = x3(3 – x)(3 + x) = x3(9 – x2) = 9x3 – x5 and
g(x) = x(9 – x2) have the same sign–chart so both
graphs are similar.
However, for f(x) it’s derivative
f '(x) = [9x3 – x5 ]' = 27x2 – 5x4 = x2(27 – 5x2).
Max
Min
70. Derivatives and Graphs
At a maximum point the graph must be
changing from going uphill to going downhill
and at the minimum point it must be changing
from going downhill to uphill. Hence the signs
of the y' must change at these critical points.
up down
down up
Both f(x) = x3(3 – x)(3 + x) = x3(9 – x2) = 9x3 – x5 and
g(x) = x(9 – x2) have the same sign–chart so both
graphs are similar.
However, for f(x) it’s derivative
f '(x) = [9x3 – x5 ]' = 27x2 – 5x4 = x2(27 – 5x2).
signs around x = 0 of
f '(x) = x2(27 – 5x2)
+ uphill
+ uphill
f '(0)=0 with order 2
Max
Min
71. Derivatives and Graphs
At a maximum point the graph must be
changing from going uphill to going downhill
and at the minimum point it must be changing
from going downhill to uphill. Hence the signs
of the y' must change at these critical points.
Max
up down
down up
Min
Both f(x) = x3(3 – x)(3 + x) = x3(9 – x2) = 9x3 – x5 and
g(x) = x(9 – x2) have the same sign–chart so both
graphs are similar.
However, for f(x) it’s derivative
f '(x) = [9x3 – x5 ]' = 27x2 – 5x4 = x2(27 – 5x2).
+ uphill
+ uphill
f '(0)=0 with order 2
signs around x = 0 of
f '(x) = x2(27 – 5x2)
The sign of f '(x) is positive on both sides of x = 0,
so (0, 0) is not a max nor min, it’s a flat landing point.
72. Derivatives and Graphs
We put the two graphs side by side for comparison.
y = g(x) = 9x – x3 y = f(x) = x2g(x) = 9x3 – x5
x
y
+ – + –
–3 0 3
x
+ – + –
–3 0 3
f(0) = 0 of order 3,
and f'(0) = 0 of order 2, flat point
f(0) = 0 of order 1,
and f'(0) = 9 > 0, uphill
y
73. Derivatives and Graphs
We put the two graphs side by side for comparison.
y = g(x) = 9x – x3 y = f(x) = x2g(x) = 9x3 – x5
x
y
+ – + –
–3 0 3
x
+ – + –
–3 0 3
f(0) = 0 of order 3,
and f'(0) = 0 of order 2, flat point
f(0) = 0 of order 1,
and f'(0) = 9 > 0, uphill
y
So if f '(x) = 0 of even order, then it’s a flat landing
point, not a max nor min.
74. Derivatives and Graphs
We put the two graphs side by side for comparison.
y = g(x) = 9x – x3 y = f(x) = x2g(x) = 9x3 – x5
x
y
+ – + –
–3 0 3
x
+ – + –
–3 0 3
f(0) = 0 of order 3,
and f'(0) = 0 of order 2, flat point
f(0) = 0 of order 1,
and f'(0) = 9 > 0, uphill
y
So if f '(x) = 0 of even order, then it’s a flat landing
point, not a max nor min.
Example B. Graph y = x + sin(x). Find the locations of
the extrema, the flat points and classify them.
For what x values is y increasing and for what x values
is y decreasing?
76. Derivatives and Graphs
We observe that
f(x) = x + sin(x) = 0 if x = 0.
Furthermore,
f(x) > 0 if x > 0,
f(x) < 0 if x < 0 (why?),
and as x →±∞, f(x) →±∞
77. Derivatives and Graphs
We observe that
f(x) = x + sin(x) = 0 if x = 0.
Furthermore,
f(x) > 0 if x > 0,
f(x) < 0 if x < 0 (why?),
and as x →±∞, f(x) →±∞
The derivative f '(x) = 1 + cos(x) = 0
so the critical points f '(x) = 0 are at
x = ±π, ±3 π, .. where cos(x) = –1.
78. Derivatives and Graphs
We observe that
f(x) = x + sin(x) = 0 if x = 0.
Furthermore,
f(x) > 0 if x > 0,
f(x) < 0 if x < 0 (why?),
and as x →±∞, f(x) →±∞
The derivative f '(x) = 1 + cos(x) = 0
so the critical points f '(x) = 0 are at
x = ±π, ±3 π, .. where cos(x) = –1.
x y = f(x)
π π
3π 3π
5π 5π
–π –π
–3π –3π
–5π –5π
some points where
f '(x) = 0
In particular f(π) = π, f(3π) = 3π, etc.. so the flat points
of y = f(x) are at (x, x) with x = ± π, ±3 π, ±5 π..
79. Derivatives and Graphs
We observe that
f(x) = x + sin(x) = 0 if x = 0.
Furthermore,
f(x) > 0 if x > 0,
f(x) < 0 if x < 0 (why?),
and as x →±∞, f(x) →±∞
The derivative f '(x) = 1 + cos(x) = 0
so the critical points f '(x) = 0 are at
x = ±π, ±3 π, .. where cos(x) = –1.
x y = f(x)
π π
3π 3π
5π 5π
–π –π
–3π –3π
–5π –5π
some points where
f '(x) = 0
In particular f(π) = π, f(3π) = 3π, etc.. so the flat points
of y = f(x) are at (x, x) with x = ± π, ±3 π, ±5 π..
Furthermore the derivative f '(x) = 1 + cos(x) > 0
so f(x) = x + sin(x) is increasing everywhere else.
Let’s putting it all together.
80. Derivatives and Graphs
Here is a table of some of the points where
y’ = 0, i.e. their tangents are horizontal .
x y
π π
3π 3π
5π 5π
–π –π
–3π –3π
–5π –5π
points where
f '(x) = 0
81. Derivatives and Graphs x y
π π
3π 3π
5π 5π
–π –π
–3π –3π
–5π –5π
Here is a table of some of the points where
y’ = 0, i.e. their tangents are horizontal .
(π, π)
(3π, 3π)
(–π, –π)
(–3π, –3π)
(0, 0)
points where
f '(x) = 0
82. Derivatives and Graphs x y
π π
3π 3π
5π 5π
–π –π
–3π –3π
–5π –5π
Here is a table of some of the points where
y’ = 0, i.e. their tangents are horizontal .
The graph is a continuous smooth curve
that is increasing between all the horizontal
locations.
(π, π)
(3π, 3π)
(–π, –π)
(–3π, –3π)
(0, 0)
points where
f '(x) = 0
83. Derivatives and Graphs x y
π π
3π 3π
5π 5π
–π –π
–3π –3π
–5π –5π
Here is a table of some of the points where
y’ = 0, i.e. their tangents are horizontal .
The graph is a continuous smooth curve
that is increasing between all the horizontal
locations. The only possibility for a smooth
increasing curve between two
flat–spots is shown here.
(π, π)
(3π, 3π)
(–π, –π)
(–3π, –3π)
(0, 0)
points where
f '(x) = 0
84. Derivatives and Graphs
Here is a table of some of the points where
y’ = 0, i.e. their tangents are horizontal .
The graph is a continuous smooth curve
that is increasing between all the horizontal
locations. The only possibility for a smooth
increasing curve between two
flat–spots is shown here.
x y
π π
3π 3π
5π 5π
–π –π
–3π –3π
–5π –5π
(π, π)
(3π, 3π)
(–π, –π)
(–3π, –3π)
(0, 0)
points where
f '(x) = 0
85. Derivatives and Graphs
The graph is a continuous smooth curve
that is increasing between all the horizontal
locations. The only possibility for a smooth
increasing curve between two
flat–spots is shown here.
x y
π π
3π 3π
5π 5π
–π –π
–3π –3π
–5π –5π
Here is a table of some of the points where
y’ = 0, i.e. their tangents are horizontal .
points where
f '(x) = 0
(π, π)
(3π, 3π)
(–π, –π)
(–3π, –3π)
(0, 0)
86. Derivatives and Graphs
The graph is a continuous smooth curve
that is increasing between all the horizontal
locations. The only possibility for a smooth
increasing curve between two
flat–spots is shown here.
x y
π π
3π 3π
5π 5π
–π –π
–3π –3π
–5π –5π
Here is a table of some of the points where
y’ = 0, i.e. their tangents are horizontal .
points where
f '(x) = 0
(π, π)
(3π, 3π)
(–π, –π)
(–3π, –3π)
(0, 0)
Hence the graph of
y = x + sin(x) is:
87. Derivatives and Graphs
The critical points where f '(x) fails to exist are
“corners”, or at points where the tangent line is
vertical.
Questions
a. Find f '(x) as x → 0+, and as x → 0– for each of the
following function.
b. How does their graphs at x = 0 reflect the answers
from a?
f (x) = | x | f (x) = x2/3 f (x) = x1/3