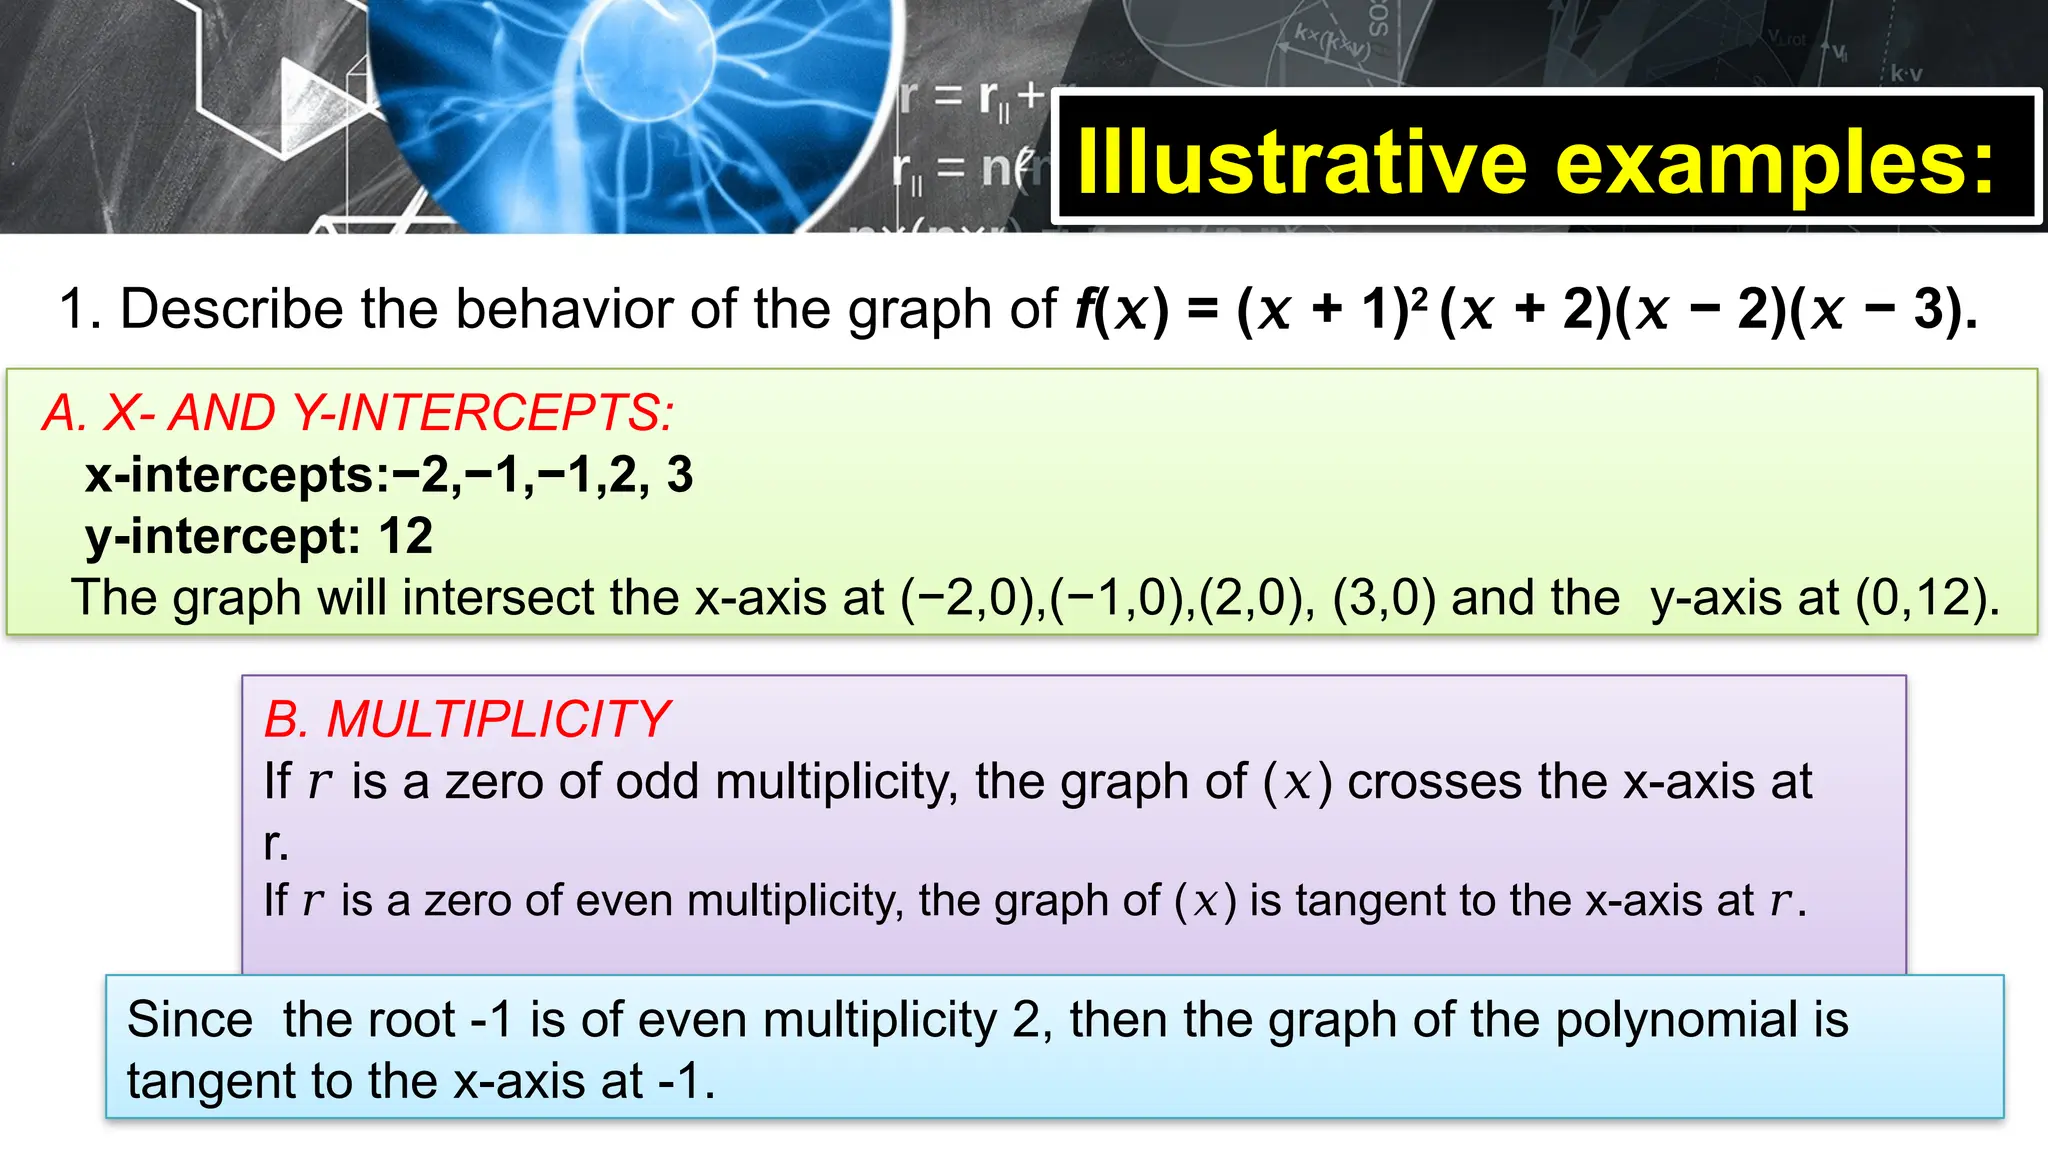
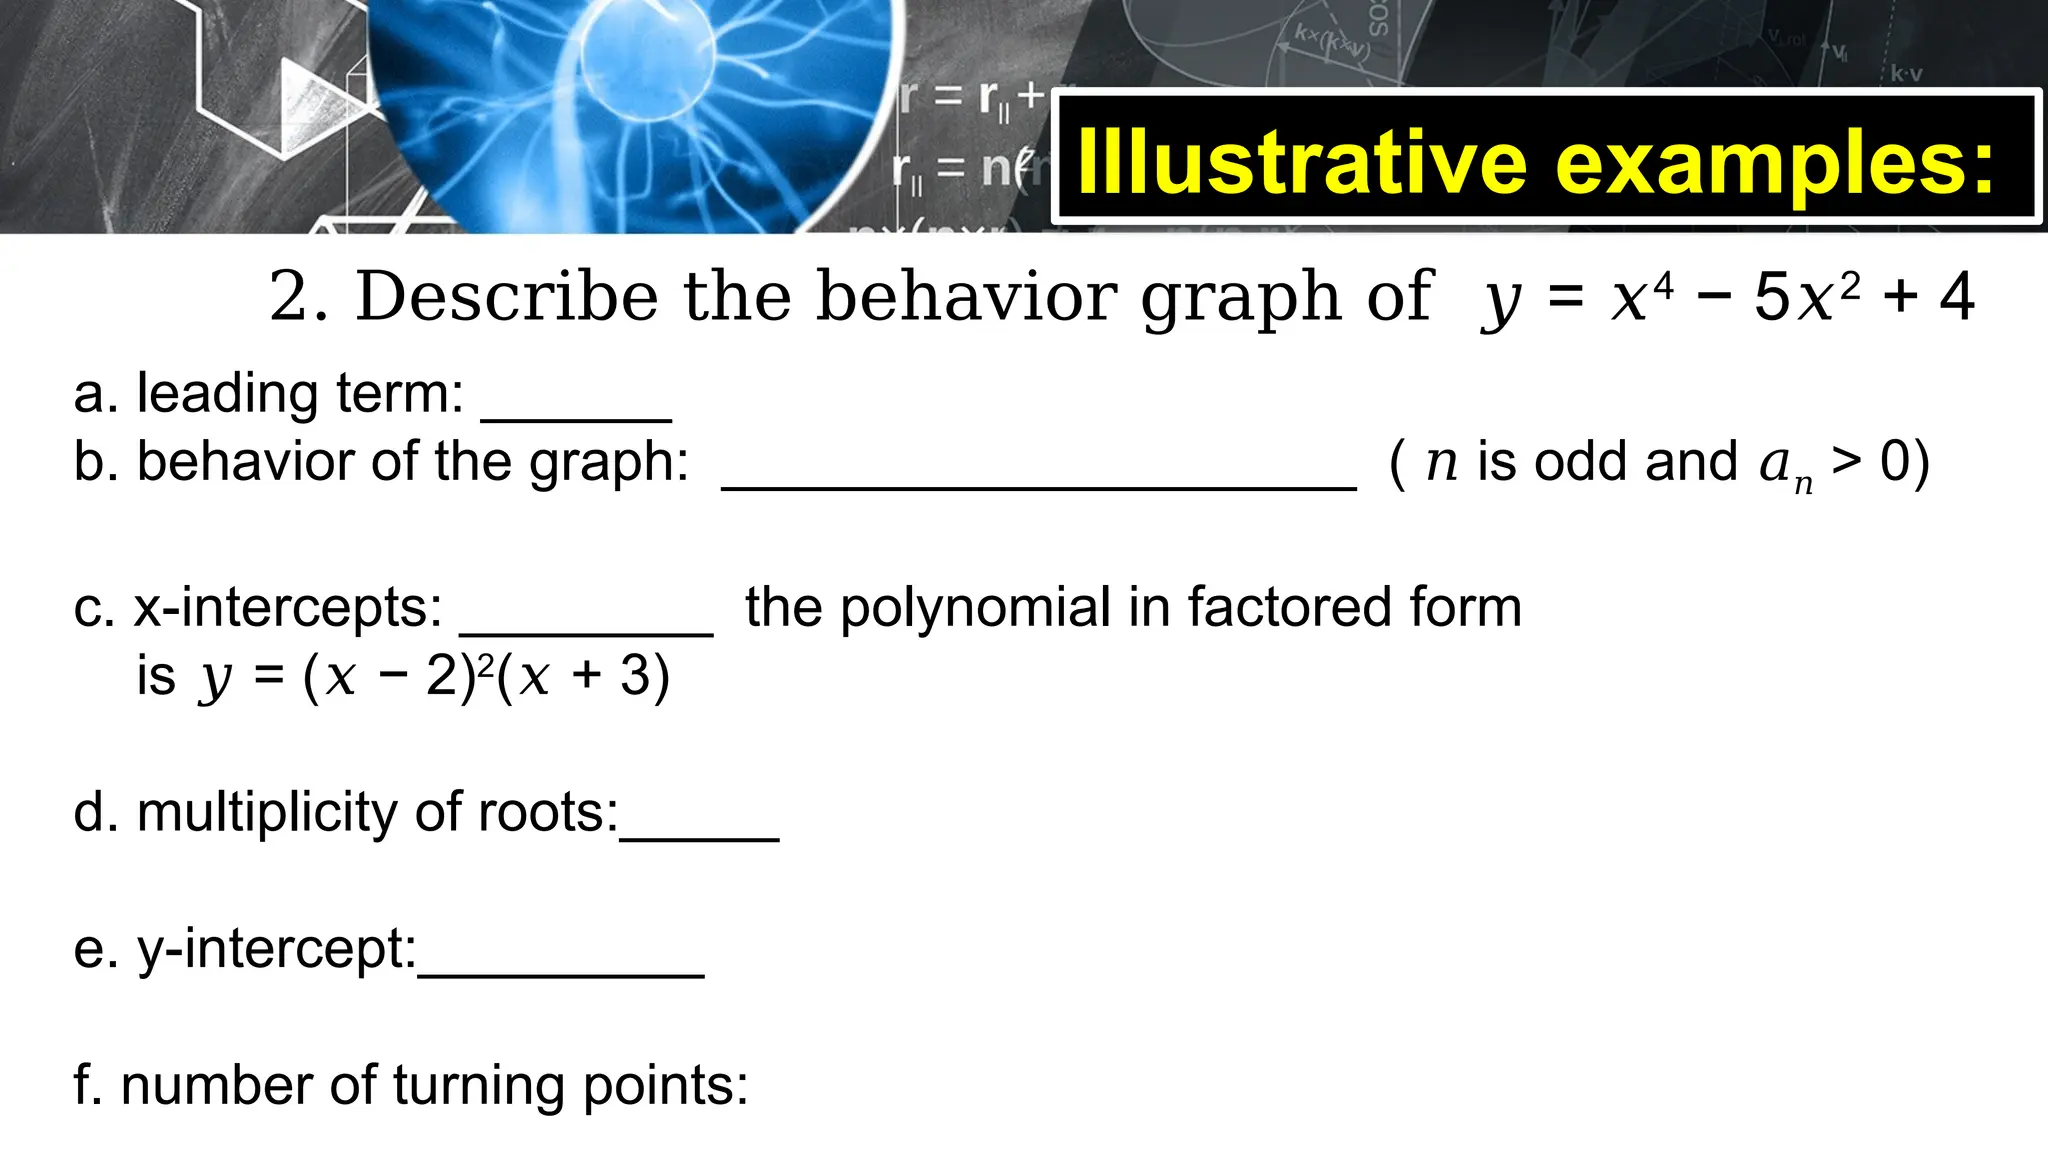
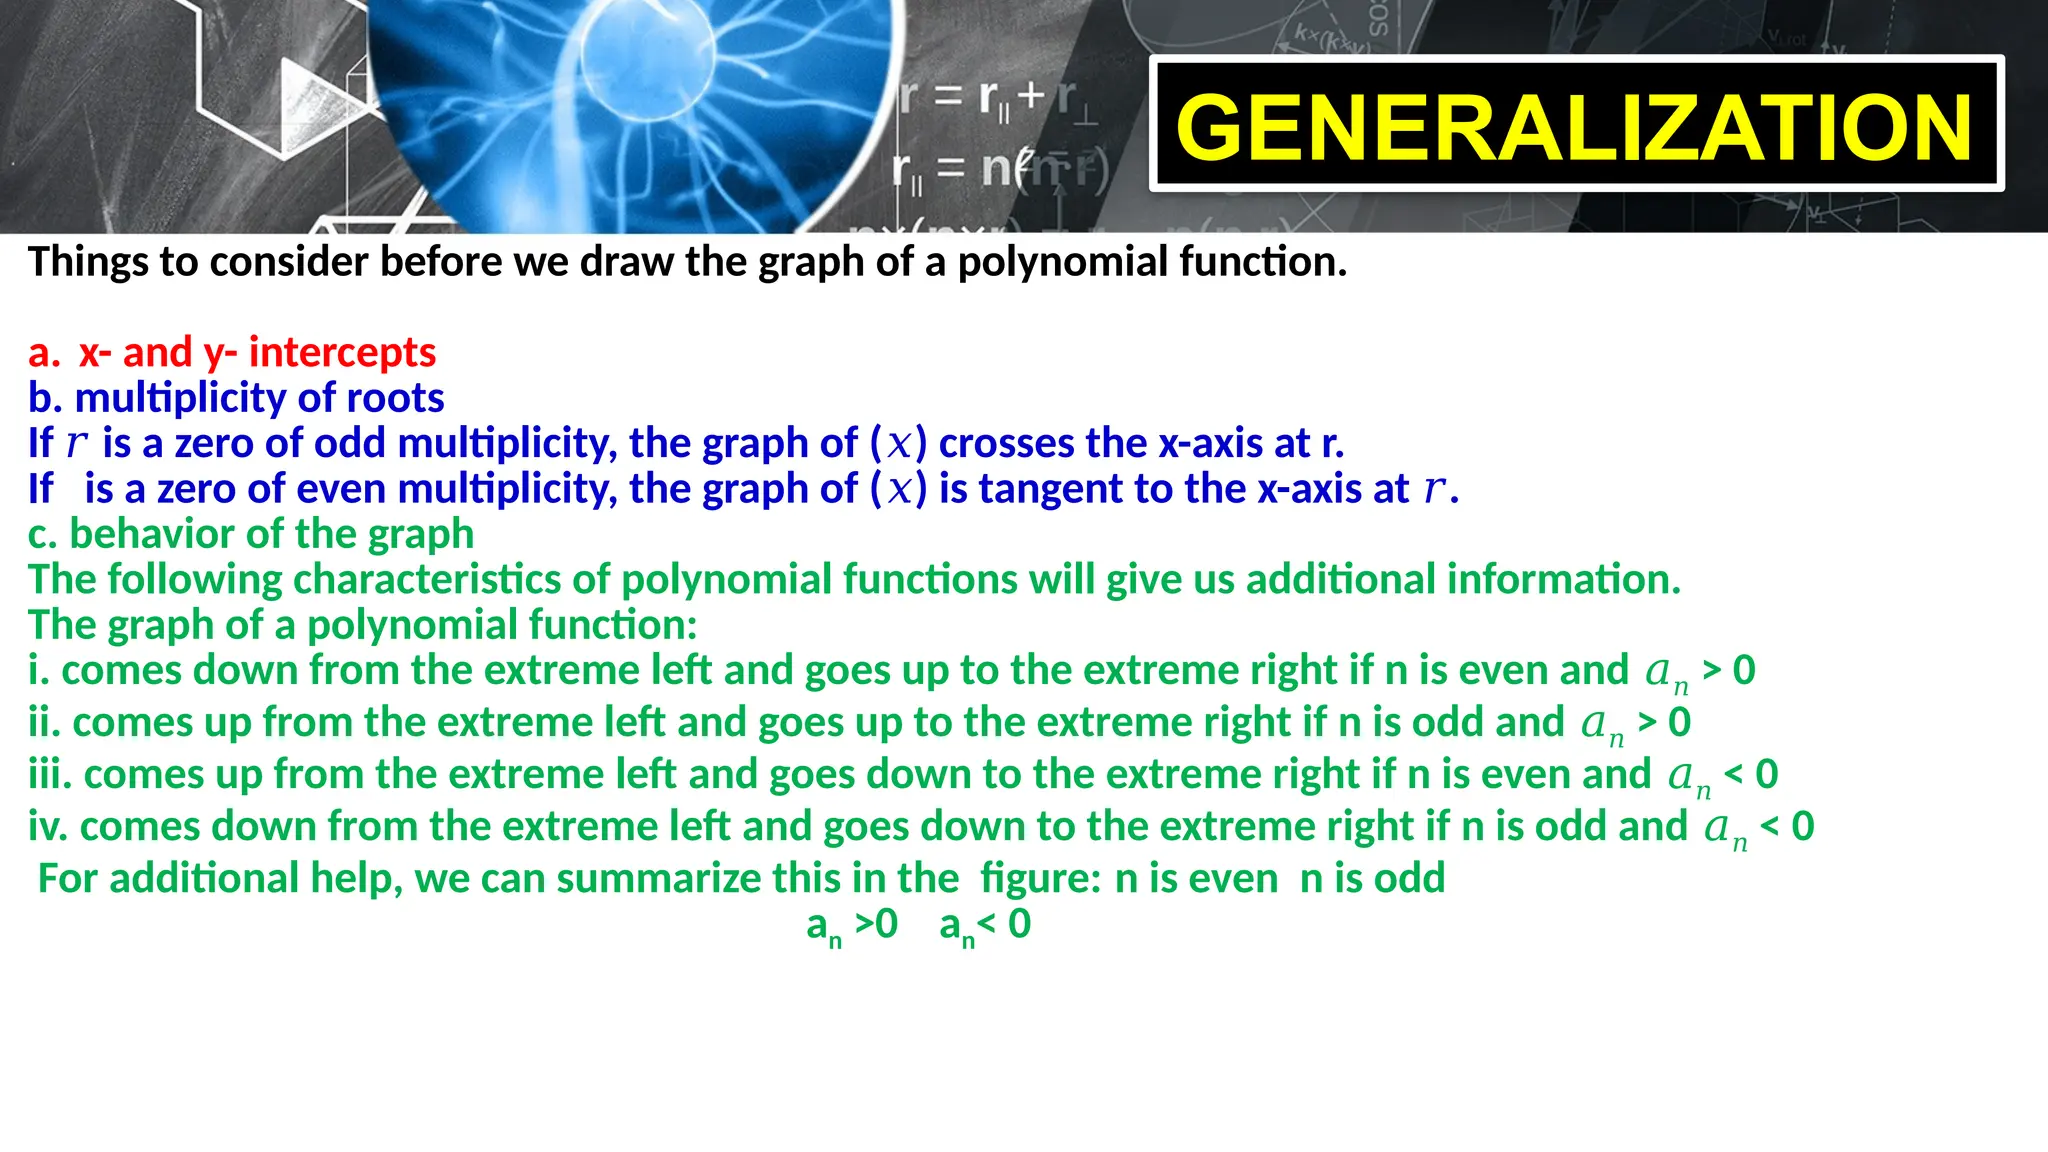
Graphs of Polynomial
Functions
Polynomial Functions
Objectives:
a. Describe the behavior of the graph using the
Leading Coefficient Test.
b. Identify the number of turning points and the
behavior of the graph based on the multiplicity of zeros.
c. Value accumulated knowledge as means of new
understanding.
INSTRUCTIONS:
1. Given the polynomial function,
match it to the graph on the
board.
2. The group who got the correct
answer earns 5 points.
FIND YOUR MATCH
These are some other things that we need
to take into consideration;
a. multiplicity of roots.
b. behavior of the graph
c. number of turning points
FIND YOUR MATCH
Illustrative examples:
1. Describe the behavior of the graph of f(𝑥) = (𝑥 + 1)2
(𝑥 + 2)(𝑥 − 2)(𝑥 − 3).
A. X- AND Y-INTERCEPTS:
x-intercepts:−2,−1,−1,2, 3
y-intercept: 12
The graph will intersect the x-axis at (−2,0),(−1,0),(2,0), (3,0) and the y-axis at (0,12).
B. MULTIPLICITY
If 𝑟 is a zero of odd multiplicity, the graph of (𝑥) crosses the x-axis at
r.
If 𝑟 is a zero of even multiplicity, the graph of (𝑥) is tangent to the x-axis at 𝑟.
Since the root -1 is of even multiplicity 2, then the graph of the polynomial is
tangent to the x-axis at -1.
Illustrative examples:
C. BEHAVIOR OF THE GRAPH:
The following characteristics of polynomial functions will give us additional information.
The graph of a polynomial function:
i. comes down from the extreme left and goes up to the extreme right if n is even and
> 0
𝑎𝑛
ii. comes up from the extreme left and goes up to the extreme right if n is odd and >
𝑎𝑛
0
iii. comes up from the extreme left and goes down to the extreme right if n is even and
< 0
𝑎𝑛
iv. comes down from the extreme left and goes down to the extreme right if n is odd and
< 0
𝑎𝑛
For additional help, we can summarize this in the figure:
n is even n is odd
End behavior - Polynomial functions always go towards  or - at either
end of the graph
Leading Coefficient (+) POSITIVE Leading Coefficient (-) NEGATIVE
Even Degree
Odd Degree
f(x) = x2 f(x) = -x2
f(x) = -x3
f(x) = x3
Illustrative examples:
Leading Coefficient Test
As x grows positively or negatively without bound, the value f(x) of the polynomial
function f(x) = an
xn
+ an – 1
xn – 1
+ … + a1
x + a0
(an
 0)
grows positively or negatively without bound depending upon the sign of the leading
coefficient an
and whether the degree n is odd or even.
x
y
x
y
n odd n even
an positive
an negative
Polynomial functions of the form f(x) = xn
, n  1 are called power functions.
If n is even,
their graphs
resemble the
graph of
f(x) = x2
.
If n is odd, their graphs
resemble the graph of
f(x) = x3
.
x
y
x
y
f(x) = x2
f(x) = x5
f(x) = x4
f(x) = x3
Graphs of polynomial functions are continuous. That is, they have no breaks, holes,
or gaps.
Polynomial functions are also smooth with rounded turns. Graphs with points or cusps
are not graphs of polynomial functions.
x
y
x
y
continuous
not
continuous
continuous
smooth not smooth
polynomial
not polynomial
not polynomial
x
y
f(x) = x3
– 5x2
+ 4x + 4
Example: Determine the multiplicity of the zeros
of f(x) = (x – 2)3
(x +1)4
.
Zero Multiplicity Behavior
2
–1
3
4
odd
even
crosses x-axis
at (2, 0)
touches x-axis
at (–1, 0)
Repeated Zeros
If k is the largest integer for which (x – a)k
is a factor of f(x) and k > 1, then a
is a repeated zero of multiplicity k.
1. If k is odd the graph of f(x) crosses the x-axis at (a, 0).
2. If k is even the graph of f(x) touches, but does not cross
through, the x-axis at (a, 0).
x
y
Illustrative examples:
If the polynomialfunction
𝑃(𝑥) = (𝑥 + 1)2
(𝑥 + 2)(𝑥 − 2)(𝑥 − 3) is written in the standard form then we
have
𝑃(𝑥) = 𝑥5
− 𝑥4
− 9𝑥3
+ 𝑥2
+ 20𝑥 + 12
We can easily see that this is a 5th degree polynomial. Thus, 𝑛 is odd.
The leading term is 𝑥5
, 𝑎𝑛
= 1 and 𝑎𝑛
> 0.
Therefore the graph of the polynomial comes up from the extreme left and
goes up to the extreme right if n is odd and 𝑎𝑛 > 0
Illustrative examples:
D. NUMBER OF TURNING POINTS:
Remember that the number of turning points in the graph of a polynomial is strictly
less than the degree of the polynomial.
Also, we must note that;
i.Quartic Functions: have an odd number of turning points; at most 3 turning points
ii.Quintic functions: have an even number of turning points, at most 4 turning points
iii.The number of turning points is at most (𝑛 − 1)
For our graph to pass through the intercepts (−2,0), (2,0), (3,0) and tangent at (−1,0),
there will be 4 turning points.
Illustrative examples:
2. Describe the behavior graph of 𝑦 = 𝑥4
−
5𝑥2
+ 4
Illustrative examples:
2. Describe the behavior graph of 𝑦 = 𝑥4
− 5𝑥2
+ 4
a. leading term: ______
b. behavior of the graph: ____________________ ( 𝑛 is odd and 𝑎𝑛 > 0)
c. x-intercepts: ________ the polynomial in factored form
is 𝑦 = (𝑥 − 2)2
(𝑥 + 3)
d. multiplicity of roots:_____
e. y-intercept:_________
f. number of turning points:
APPLICATION
1.Are the intercepts enough information for us to
graph polynomials?
2.How can we describe the behavior of the graph of
a polynomial function?
3.Is it possible for the degree of function to be less
than the number of turning points?
APPLICATION
Find the following then describe the behavior of the graph of 𝑝(𝑥) = 𝑥3
− 𝑥2
− 8𝑥 +
12
a. leading term: ______
b. behavior of the graph: ____________________ ( 𝑛 is odd and 𝑎𝑛 > 0)
c. x-intercepts: ________ the polynomial in factored form is 𝑦 = (𝑥 − 2)2
(𝑥 + 3)
d. multiplicity of roots:_____
e. y-intercept:_________
f. number of turning points:
INDIVIDUAL TASK
Describe the graph of the following polynomial
functions:
1. 𝑦 = 𝑥3
+ 3𝑥2
− 𝑥 − 3
2. 𝑦 = −𝑥3
+ 2𝑥2
+ 11𝑥 - 12
GROUP TASK
Describe the graph of the following
polynomial functions:
1. 𝑦 = 𝑥3
− 𝑥2
− 𝑥 + 1
2. 𝑦 = (2𝑥 + 3)(𝑥 − 1) (𝑥 − 4)
GENERALIZATION
Things to consider before we draw the graph of a polynomial function.
a. x- and y- intercepts
b. multiplicity of roots
If is a zero of odd multiplicity, the graph of ( ) crosses the x-axis at r.
𝑟 𝑥
If is a zero of even multiplicity, the graph of ( ) is tangent to the x-axis at .
𝑥 𝑟
c. behavior of the graph
The following characteristics of polynomial functions will give us additional information.
The graph of a polynomial function:
i. comes down from the extreme left and goes up to the extreme right if n is even and 𝑎𝑛 > 0
ii. comes up from the extreme left and goes up to the extreme right if n is odd and 𝑎𝑛 > 0
iii. comes up from the extreme left and goes down to the extreme right if n is even and 𝑎𝑛 < 0
iv. comes down from the extreme left and goes down to the extreme right if n is odd and 𝑎𝑛 < 0
For additional help, we can summarize this in the figure: n is even n is odd
an >0 an< 0
GENERALIZATION
d. number of turning points:
Remember that the number of turning points in the graph of a polynomial is
strictly less than the degree of the polynomial.
Also, we must note that;
i.Quartic Functions: have an odd number of turning points; at most 3 turning
points
ii.Quintic functions: have an even number of turning points, at most 4 turning
points
iii.The number of turning points is at most ( − 1)
𝑛
APPLICATION
For the given polynomial function
𝑦 = −(𝑥 + 2) (𝑥 + 1)4
(𝑥− 1)3
, describe or determine the following.
a. leading term
b. behavior of the graph
c. x-intercepts
d. multiplicity of roots e. y-intercept
f. number of turning points
For the given polynomial function 𝑦 = 𝑥6
+ 4𝑥5
+ 4𝑥4
− 2𝑥3
−5𝑥2
− 2𝑥,
describe or determine the following:
a. leading term
b. behavior of the graph
c. x-intercepts
d. multiplicity of roots
e. y-intercept
f. number of turning points
g. sketch
I WANT MORE!
Study:
Graph of the function
𝑦 = 𝑥6
+ 4𝑥5
+ 4𝑥4
− 2𝑥3
−5𝑥2
− 2𝑥
HOMEWORK

Mathematics 10 Graphs of Polynomial Functions.pptx

  • 1.
  • 2.
    Polynomial Functions Objectives: a. Describethe behavior of the graph using the Leading Coefficient Test. b. Identify the number of turning points and the behavior of the graph based on the multiplicity of zeros. c. Value accumulated knowledge as means of new understanding.
  • 3.
    INSTRUCTIONS: 1. Given thepolynomial function, match it to the graph on the board. 2. The group who got the correct answer earns 5 points. FIND YOUR MATCH
  • 4.
    These are someother things that we need to take into consideration; a. multiplicity of roots. b. behavior of the graph c. number of turning points FIND YOUR MATCH
  • 5.
    Illustrative examples: 1. Describethe behavior of the graph of f(𝑥) = (𝑥 + 1)2 (𝑥 + 2)(𝑥 − 2)(𝑥 − 3). A. X- AND Y-INTERCEPTS: x-intercepts:−2,−1,−1,2, 3 y-intercept: 12 The graph will intersect the x-axis at (−2,0),(−1,0),(2,0), (3,0) and the y-axis at (0,12). B. MULTIPLICITY If 𝑟 is a zero of odd multiplicity, the graph of (𝑥) crosses the x-axis at r. If 𝑟 is a zero of even multiplicity, the graph of (𝑥) is tangent to the x-axis at 𝑟. Since the root -1 is of even multiplicity 2, then the graph of the polynomial is tangent to the x-axis at -1.
  • 6.
    Illustrative examples: C. BEHAVIOROF THE GRAPH: The following characteristics of polynomial functions will give us additional information. The graph of a polynomial function: i. comes down from the extreme left and goes up to the extreme right if n is even and > 0 𝑎𝑛 ii. comes up from the extreme left and goes up to the extreme right if n is odd and > 𝑎𝑛 0 iii. comes up from the extreme left and goes down to the extreme right if n is even and < 0 𝑎𝑛 iv. comes down from the extreme left and goes down to the extreme right if n is odd and < 0 𝑎𝑛 For additional help, we can summarize this in the figure: n is even n is odd
  • 7.
    End behavior -Polynomial functions always go towards  or - at either end of the graph Leading Coefficient (+) POSITIVE Leading Coefficient (-) NEGATIVE Even Degree Odd Degree f(x) = x2 f(x) = -x2 f(x) = -x3 f(x) = x3 Illustrative examples:
  • 8.
    Leading Coefficient Test Asx grows positively or negatively without bound, the value f(x) of the polynomial function f(x) = an xn + an – 1 xn – 1 + … + a1 x + a0 (an  0) grows positively or negatively without bound depending upon the sign of the leading coefficient an and whether the degree n is odd or even. x y x y n odd n even an positive an negative
  • 9.
    Polynomial functions ofthe form f(x) = xn , n  1 are called power functions. If n is even, their graphs resemble the graph of f(x) = x2 . If n is odd, their graphs resemble the graph of f(x) = x3 . x y x y f(x) = x2 f(x) = x5 f(x) = x4 f(x) = x3
  • 10.
    Graphs of polynomialfunctions are continuous. That is, they have no breaks, holes, or gaps. Polynomial functions are also smooth with rounded turns. Graphs with points or cusps are not graphs of polynomial functions. x y x y continuous not continuous continuous smooth not smooth polynomial not polynomial not polynomial x y f(x) = x3 – 5x2 + 4x + 4
  • 11.
    Example: Determine themultiplicity of the zeros of f(x) = (x – 2)3 (x +1)4 . Zero Multiplicity Behavior 2 –1 3 4 odd even crosses x-axis at (2, 0) touches x-axis at (–1, 0) Repeated Zeros If k is the largest integer for which (x – a)k is a factor of f(x) and k > 1, then a is a repeated zero of multiplicity k. 1. If k is odd the graph of f(x) crosses the x-axis at (a, 0). 2. If k is even the graph of f(x) touches, but does not cross through, the x-axis at (a, 0). x y
  • 12.
    Illustrative examples: If thepolynomialfunction 𝑃(𝑥) = (𝑥 + 1)2 (𝑥 + 2)(𝑥 − 2)(𝑥 − 3) is written in the standard form then we have 𝑃(𝑥) = 𝑥5 − 𝑥4 − 9𝑥3 + 𝑥2 + 20𝑥 + 12 We can easily see that this is a 5th degree polynomial. Thus, 𝑛 is odd. The leading term is 𝑥5 , 𝑎𝑛 = 1 and 𝑎𝑛 > 0. Therefore the graph of the polynomial comes up from the extreme left and goes up to the extreme right if n is odd and 𝑎𝑛 > 0
  • 13.
    Illustrative examples: D. NUMBEROF TURNING POINTS: Remember that the number of turning points in the graph of a polynomial is strictly less than the degree of the polynomial. Also, we must note that; i.Quartic Functions: have an odd number of turning points; at most 3 turning points ii.Quintic functions: have an even number of turning points, at most 4 turning points iii.The number of turning points is at most (𝑛 − 1) For our graph to pass through the intercepts (−2,0), (2,0), (3,0) and tangent at (−1,0), there will be 4 turning points.
  • 14.
    Illustrative examples: 2. Describethe behavior graph of 𝑦 = 𝑥4 − 5𝑥2 + 4
  • 15.
    Illustrative examples: 2. Describethe behavior graph of 𝑦 = 𝑥4 − 5𝑥2 + 4 a. leading term: ______ b. behavior of the graph: ____________________ ( 𝑛 is odd and 𝑎𝑛 > 0) c. x-intercepts: ________ the polynomial in factored form is 𝑦 = (𝑥 − 2)2 (𝑥 + 3) d. multiplicity of roots:_____ e. y-intercept:_________ f. number of turning points:
  • 16.
    APPLICATION 1.Are the interceptsenough information for us to graph polynomials? 2.How can we describe the behavior of the graph of a polynomial function? 3.Is it possible for the degree of function to be less than the number of turning points?
  • 17.
    APPLICATION Find the followingthen describe the behavior of the graph of 𝑝(𝑥) = 𝑥3 − 𝑥2 − 8𝑥 + 12 a. leading term: ______ b. behavior of the graph: ____________________ ( 𝑛 is odd and 𝑎𝑛 > 0) c. x-intercepts: ________ the polynomial in factored form is 𝑦 = (𝑥 − 2)2 (𝑥 + 3) d. multiplicity of roots:_____ e. y-intercept:_________ f. number of turning points:
  • 18.
    INDIVIDUAL TASK Describe thegraph of the following polynomial functions: 1. 𝑦 = 𝑥3 + 3𝑥2 − 𝑥 − 3 2. 𝑦 = −𝑥3 + 2𝑥2 + 11𝑥 - 12
  • 19.
    GROUP TASK Describe thegraph of the following polynomial functions: 1. 𝑦 = 𝑥3 − 𝑥2 − 𝑥 + 1 2. 𝑦 = (2𝑥 + 3)(𝑥 − 1) (𝑥 − 4)
  • 20.
    GENERALIZATION Things to considerbefore we draw the graph of a polynomial function. a. x- and y- intercepts b. multiplicity of roots If is a zero of odd multiplicity, the graph of ( ) crosses the x-axis at r. 𝑟 𝑥 If is a zero of even multiplicity, the graph of ( ) is tangent to the x-axis at . 𝑥 𝑟 c. behavior of the graph The following characteristics of polynomial functions will give us additional information. The graph of a polynomial function: i. comes down from the extreme left and goes up to the extreme right if n is even and 𝑎𝑛 > 0 ii. comes up from the extreme left and goes up to the extreme right if n is odd and 𝑎𝑛 > 0 iii. comes up from the extreme left and goes down to the extreme right if n is even and 𝑎𝑛 < 0 iv. comes down from the extreme left and goes down to the extreme right if n is odd and 𝑎𝑛 < 0 For additional help, we can summarize this in the figure: n is even n is odd an >0 an< 0
  • 21.
    GENERALIZATION d. number ofturning points: Remember that the number of turning points in the graph of a polynomial is strictly less than the degree of the polynomial. Also, we must note that; i.Quartic Functions: have an odd number of turning points; at most 3 turning points ii.Quintic functions: have an even number of turning points, at most 4 turning points iii.The number of turning points is at most ( − 1) 𝑛
  • 22.
    APPLICATION For the givenpolynomial function 𝑦 = −(𝑥 + 2) (𝑥 + 1)4 (𝑥− 1)3 , describe or determine the following. a. leading term b. behavior of the graph c. x-intercepts d. multiplicity of roots e. y-intercept f. number of turning points
  • 23.
    For the givenpolynomial function 𝑦 = 𝑥6 + 4𝑥5 + 4𝑥4 − 2𝑥3 −5𝑥2 − 2𝑥, describe or determine the following: a. leading term b. behavior of the graph c. x-intercepts d. multiplicity of roots e. y-intercept f. number of turning points g. sketch I WANT MORE!
  • 24.
    Study: Graph of thefunction 𝑦 = 𝑥6 + 4𝑥5 + 4𝑥4 − 2𝑥3 −5𝑥2 − 2𝑥 HOMEWORK

Editor's Notes

  • #3 Find your Match Group the class into 5. Give each group a polynomial function. Have them match the assigned function to them to the given graphs on the board.
  • #4 Aside from the Intercepts, there are many other things to consider when we draw the graph of a polynomial function.
  • #18 Recitation
  • #20 Recitation
  • #21 Recitation
  • #23 Are the Intercepts enough information for us to graph polynomial functions? Are there other things we need to consider? What are those?
  • #24 Are the Intercepts enough information for us to graph polynomial functions? Are there other things we need to consider? What are those?