This summary provides an overview of centrality measures in social network analysis:
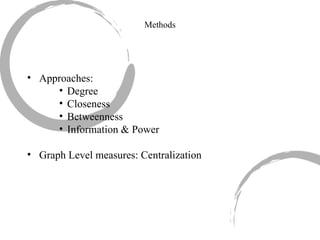
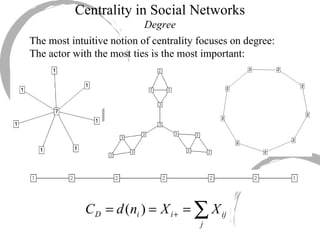
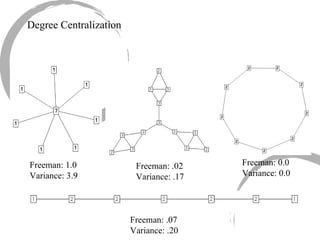
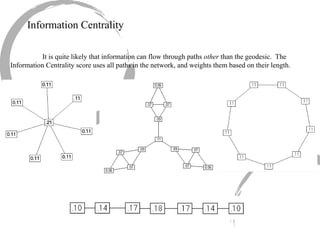
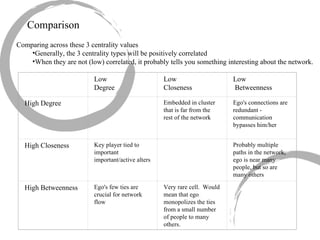
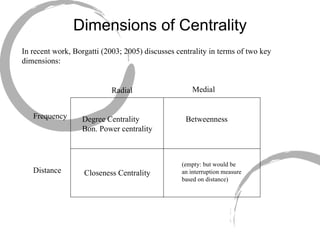
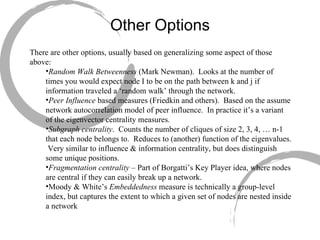
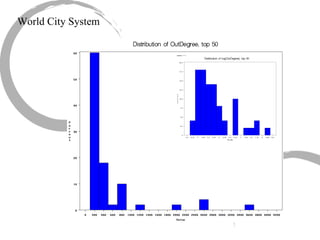
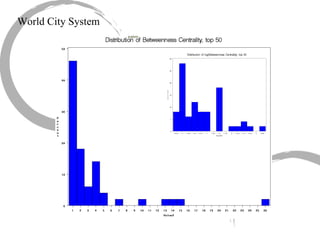
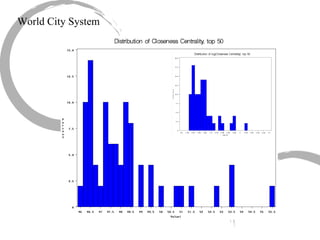
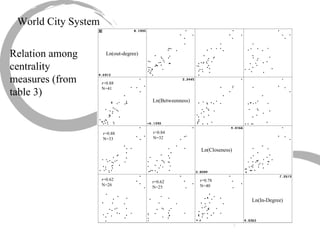
1) There are several approaches to measuring centrality in a network, including degree centrality, closeness centrality, betweenness centrality, and eigenvector centrality. These measures capture different aspects of a node's importance or influence.
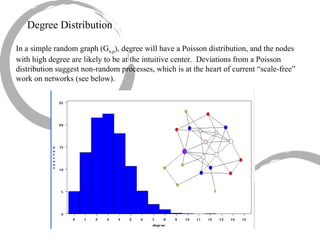
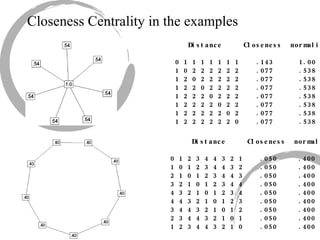
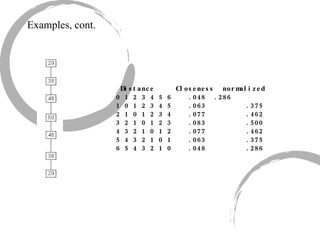
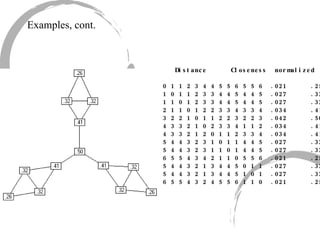
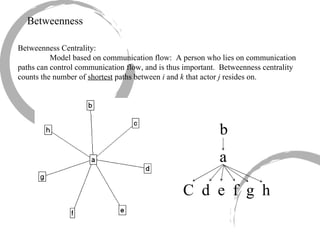
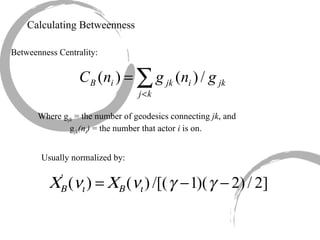
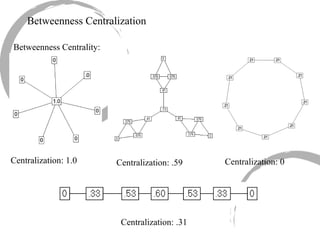
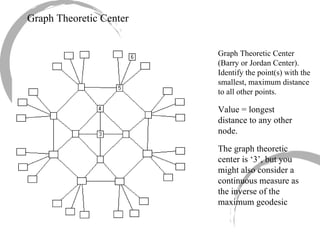
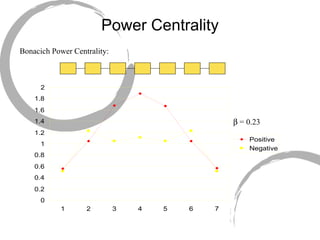
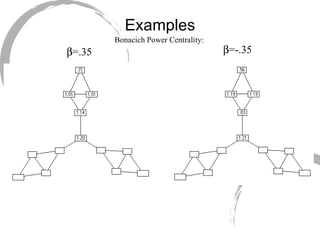
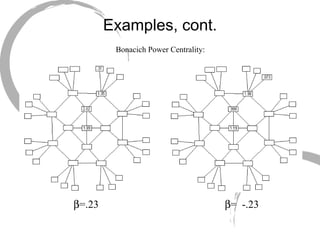
2) Degree centrality focuses on the number of ties a node has, closeness looks at distance to all other nodes, and betweenness considers dependency on shortest paths. Eigenvector centrality captures the influence of important neighbors.
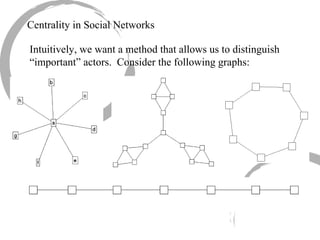
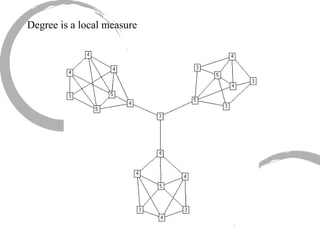
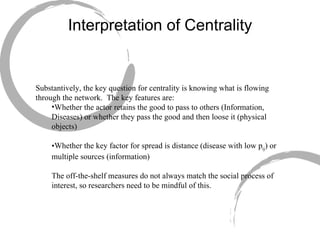
3) Comparing centrality measures can provide insight into a network's structure and a node's role, such as brokering connections vs. being well-connected locally.
Network centrality measures and their effectivenessemapesce
Often centrality measures are used in social network analysis. The goal of this presentation is to explain how different centrality works and how they can be compared.
Centrality measures covered: degree, closeness, harmonic, Lin's index, betweenness, eigenvector, seeley's index, pagerank, hits, SALSA
Quick introduction to community detection.
Structural properties of real world networks, definition of "communities", fundamental techniques and evaluation measures.
Social Network Analysis: What It Is, Why We Should Care, and What We Can Lear...Xiaohan Zeng
The advent of the social networks has completely changed our daily life. The deluge of data collected on Social Network Services (SNS) and recent developments in complex network theory have enabled many marvelous predictive analysis, which tells us many amazing stories.
Why do we often feel that "the world is so small?" Is the six-degree separation purely imagination or based on mathematical insights? Why are there just a few rockstars who enjoy extreme popularity while most of us stay unknown to the world? When science meets coffee shop knowledge, things are bound to be intriguing.
I will first briefly describe what social networks are, in the mathematical sense. Then I will introduce some ways to extract characteristics of networks, and how these analyses can explain many anecdotes in our life. Finally, I'll show an example of what we can learn from social network analysis, based on data from Groupon.
1. Basics of Social Networks
2. Real-world problem
3. How to construct graph from real-world problem?
4. What graph theory problem getting from real-world problem?
5. Graph type of Social Networks
6. Special properties in social graph
7. How to find communities and groups in social networks? (Algorithms)
8. How to interpret graph solution back to real-world problem?
Social Network Analysis Workshop
This talk will be a workshop featuring an overview of basic theory and methods for social network analysis and an introduction to igraph. The first half of the talk will be a discussion of the concepts and the second half will feature code examples and demonstrations.
Igraph is a package in R, Python, and C++ that supports social network analysis and network data visualization.
Ian McCulloh holds joint appointments as a Parson’s Fellow in the Bloomberg School of Public health, a Senior Lecturer in the Whiting School of Engineering and a senior scientist at the Applied Physics Lab, at Johns Hopkins University. His current research is focused on strategic influence in online networks. His most recent papers have been focused on the neuroscience of persuasion and measuring influence in online social media firestorms. He is the author of “Social Network Analysis with Applications” (Wiley: 2013), “Networks Over Time” (Oxford: forthcoming) and has published 48 peer-reviewed papers, primarily in the area of social network analysis. His current applied work is focused on educating soldiers and marines in advanced methods for open source research and data science leadership.
More information about Dr. Ian McCulloh's work can be found at https://ep.jhu.edu/about-us/faculty-directory/1511-ian-mcculloh
Clustering Methods and Community Detection with NetworkX. A slide deck for the NTU Complexity Science Winter School.
For the accompanying iPython Notebook, visit: http://github.com/eflegara/NetStruc
Social Network Analysis Introduction including Data Structure Graph overview. Doug Needham
Social Network Analysis Introduction including Data Structure Graph overview. Given in Cincinnati August 18th 2015 as part of the DataSeed Meetup group.
A brief description of clustering, two relevant clustering algorithms(K-means and Fuzzy C-means), clustering validation, two inner validity indices(Dunn-n-Dunn and Devies Bouldin) .
FellowBuddy.com is an innovative platform that brings students together to share notes, exam papers, study guides, project reports and presentation for upcoming exams.
We connect Students who have an understanding of course material with Students who need help.
Benefits:-
# Students can catch up on notes they missed because of an absence.
# Underachievers can find peer developed notes that break down lecture and study material in a way that they can understand
# Students can earn better grades, save time and study effectively
Our Vision & Mission – Simplifying Students Life
Our Belief – “The great breakthrough in your life comes when you realize it, that you can learn anything you need to learn; to accomplish any goal that you have set for yourself. This means there are no limits on what you can be, have or do.”
Like Us - https://www.facebook.com/FellowBuddycom
These slides introduce MyFaces Extensions Validator. This first part is a short overview. To get more details about MyFaces Extensions Validator we also offer slides with all important details. Do not hesitate to contact us!
This isn't what I thought it was: community in the network ageNancy Wright White
A narrated version can be found here: https://www.youtube.com/watch?v=YB82kbj-NXw This was a short remote presentation that was part of a panel at the CACUSS 12.0: Engaging Digital Citizens conference <http: /> in Vancouver BC, Canada.
The Network, the Community and the Self-CreativityVince Cammarata
Lulu.com is a marketplace where “authors” - individuals, companies
and groups - can publish and sell a variety of digital content including
books, music, video, software, calendars, photos and artwork...
A gentle introduction to 2 classification techniques, as presented by Kriti Puniyani to the NYC Predictive Analytics group (April 14, 2011). To download the file please go here: http://www.meetup.com/NYC-Predictive-Analytics/files/
An introduction in the world of Social Network Analysis and a view on how this may help learning networks. History, data collection and several analysis techniques are shown.
MODELING SOCIAL GAUSS-MARKOV MOBILITY FOR OPPORTUNISTIC NETWORK csandit
Mobility is attracting more and more interests due to its importance for data forwarding
mechanisms in many networks such as mobile opportunistic network. In everyday life mobile
nodes are often carried by human. Thus, mobile nodes’ mobility pattern is inevitable affected by
human social character. This paper presents a novel mobility model (HNGM) which combines
social character and Gauss-Markov process together. The performance analysis on this
mobility model is given and one famous and widely used mobility model (RWP) is chosen to
make comparison..
AN GROUP BEHAVIOR MOBILITY MODEL FOR OPPORTUNISTIC NETWORKS csandit
Mobility is regarded as a network transport mechanism for distributing data in many networks.
However, many mobility models ignore the fact that peer nodes often carried by people and
thus move in group pattern according to some kind of social relation. In this paper, we propose
one mobility model based on group behavior character which derives from real movement
scenario in daily life. This paper also gives the character analysis of this mobility model and
compares with the classic Random Waypoint Mobility model.
Reverse Nearest Neighbors in Unsupervised Distance-Based Outlier Detection1crore projects
IEEE PROJECTS 2015
1 crore projects is a leading Guide for ieee Projects and real time projects Works Provider.
It has been provided Lot of Guidance for Thousands of Students & made them more beneficial in all Technology Training.
Dot Net
DOTNET Project Domain list 2015
1. IEEE based on datamining and knowledge engineering
2. IEEE based on mobile computing
3. IEEE based on networking
4. IEEE based on Image processing
5. IEEE based on Multimedia
6. IEEE based on Network security
7. IEEE based on parallel and distributed systems
Java Project Domain list 2015
1. IEEE based on datamining and knowledge engineering
2. IEEE based on mobile computing
3. IEEE based on networking
4. IEEE based on Image processing
5. IEEE based on Multimedia
6. IEEE based on Network security
7. IEEE based on parallel and distributed systems
ECE IEEE Projects 2015
1. Matlab project
2. Ns2 project
3. Embedded project
4. Robotics project
Eligibility
Final Year students of
1. BSc (C.S)
2. BCA/B.E(C.S)
3. B.Tech IT
4. BE (C.S)
5. MSc (C.S)
6. MSc (IT)
7. MCA
8. MS (IT)
9. ME(ALL)
10. BE(ECE)(EEE)(E&I)
TECHNOLOGY USED AND FOR TRAINING IN
1. DOT NET
2. C sharp
3. ASP
4. VB
5. SQL SERVER
6. JAVA
7. J2EE
8. STRINGS
9. ORACLE
10. VB dotNET
11. EMBEDDED
12. MAT LAB
13. LAB VIEW
14. Multi Sim
CONTACT US
1 CRORE PROJECTS
Door No: 214/215,2nd Floor,
No. 172, Raahat Plaza, (Shopping Mall) ,Arcot Road, Vadapalani, Chennai,
Tamin Nadu, INDIA - 600 026
Email id: 1croreprojects@gmail.com
website:1croreprojects.com
Phone : +91 97518 00789 / +91 72999 51536
Inferring Peer Centrality in Socially-Informed Peer-to-Peer SystemsNicolas Kourtellis
Social applications implemented on a peer-to-peer (P2P) architecture mine the social graph of their users for improved performance in search, recommendations, resource
sharing and others. In such applications, the social graph that connects their users is distributed on the peer-to-peer system: the traversal of the social graph translates to a socially-informed routing in the peer-to-peer layer.
In this work we introduce the model of a projection graph that is the result of mapping a social graph onto a peer-to-peer network. We analytically formulate the relation between metrics in the social graph and in the projection graph. We focus on three such graph metrics: degree centrality, node betweenness centrality, and edge betweenness centrality. We evaluate experimentally the feasibility of estimating these metrics in the projection graph from the metrics of the social graph. Our experiments on real networks show that when mapping communities of 50-150 users on a peer, there is an optimal organization of the projection graph with respect to degree and node betweenness centrality. In this range, the association between the properties of the social graph and the projection graph is the highest, and thus the properties of the (dynamic) projection graph can be inferred from
the properties of the (slower changing) social graph. We discuss the applicability of our findings to aspects of peer-to-peer systems such as data dissemination, social search, peer vulnerability, and data placement and caching.
Inferring Peer Centrality in Socially-Informed Peer-to-Peer Systems. Nicolas Kourtellis and Adriana Iamnitchi. In Proceedings of 11th IEEE International Conference on Peer-to-Peer Computing (P2P'11), Kyoto, Japan, Aug 2011
Read| The latest issue of The Challenger is here! We are thrilled to announce that our school paper has qualified for the NATIONAL SCHOOLS PRESS CONFERENCE (NSPC) 2024. Thank you for your unwavering support and trust. Dive into the stories that made us stand out!
Unit 8 - Information and Communication Technology (Paper I).pdfThiyagu K
This slides describes the basic concepts of ICT, basics of Email, Emerging Technology and Digital Initiatives in Education. This presentations aligns with the UGC Paper I syllabus.
Instructions for Submissions thorugh G- Classroom.pptxJheel Barad
This presentation provides a briefing on how to upload submissions and documents in Google Classroom. It was prepared as part of an orientation for new Sainik School in-service teacher trainees. As a training officer, my goal is to ensure that you are comfortable and proficient with this essential tool for managing assignments and fostering student engagement.
Embracing GenAI - A Strategic ImperativePeter Windle
Artificial Intelligence (AI) technologies such as Generative AI, Image Generators and Large Language Models have had a dramatic impact on teaching, learning and assessment over the past 18 months. The most immediate threat AI posed was to Academic Integrity with Higher Education Institutes (HEIs) focusing their efforts on combating the use of GenAI in assessment. Guidelines were developed for staff and students, policies put in place too. Innovative educators have forged paths in the use of Generative AI for teaching, learning and assessments leading to pockets of transformation springing up across HEIs, often with little or no top-down guidance, support or direction.
This Gasta posits a strategic approach to integrating AI into HEIs to prepare staff, students and the curriculum for an evolving world and workplace. We will highlight the advantages of working with these technologies beyond the realm of teaching, learning and assessment by considering prompt engineering skills, industry impact, curriculum changes, and the need for staff upskilling. In contrast, not engaging strategically with Generative AI poses risks, including falling behind peers, missed opportunities and failing to ensure our graduates remain employable. The rapid evolution of AI technologies necessitates a proactive and strategic approach if we are to remain relevant.
A Strategic Approach: GenAI in EducationPeter Windle
Artificial Intelligence (AI) technologies such as Generative AI, Image Generators and Large Language Models have had a dramatic impact on teaching, learning and assessment over the past 18 months. The most immediate threat AI posed was to Academic Integrity with Higher Education Institutes (HEIs) focusing their efforts on combating the use of GenAI in assessment. Guidelines were developed for staff and students, policies put in place too. Innovative educators have forged paths in the use of Generative AI for teaching, learning and assessments leading to pockets of transformation springing up across HEIs, often with little or no top-down guidance, support or direction.
This Gasta posits a strategic approach to integrating AI into HEIs to prepare staff, students and the curriculum for an evolving world and workplace. We will highlight the advantages of working with these technologies beyond the realm of teaching, learning and assessment by considering prompt engineering skills, industry impact, curriculum changes, and the need for staff upskilling. In contrast, not engaging strategically with Generative AI poses risks, including falling behind peers, missed opportunities and failing to ensure our graduates remain employable. The rapid evolution of AI technologies necessitates a proactive and strategic approach if we are to remain relevant.
Macroeconomics- Movie Location
This will be used as part of your Personal Professional Portfolio once graded.
Objective:
Prepare a presentation or a paper using research, basic comparative analysis, data organization and application of economic information. You will make an informed assessment of an economic climate outside of the United States to accomplish an entertainment industry objective.
Biological screening of herbal drugs: Introduction and Need for
Phyto-Pharmacological Screening, New Strategies for evaluating
Natural Products, In vitro evaluation techniques for Antioxidants, Antimicrobial and Anticancer drugs. In vivo evaluation techniques
for Anti-inflammatory, Antiulcer, Anticancer, Wound healing, Antidiabetic, Hepatoprotective, Cardio protective, Diuretics and
Antifertility, Toxicity studies as per OECD guidelines
Operation “Blue Star” is the only event in the history of Independent India where the state went into war with its own people. Even after about 40 years it is not clear if it was culmination of states anger over people of the region, a political game of power or start of dictatorial chapter in the democratic setup.
The people of Punjab felt alienated from main stream due to denial of their just demands during a long democratic struggle since independence. As it happen all over the word, it led to militant struggle with great loss of lives of military, police and civilian personnel. Killing of Indira Gandhi and massacre of innocent Sikhs in Delhi and other India cities was also associated with this movement.
Synthetic Fiber Construction in lab .pptxPavel ( NSTU)
Synthetic fiber production is a fascinating and complex field that blends chemistry, engineering, and environmental science. By understanding these aspects, students can gain a comprehensive view of synthetic fiber production, its impact on society and the environment, and the potential for future innovations. Synthetic fibers play a crucial role in modern society, impacting various aspects of daily life, industry, and the environment. ynthetic fibers are integral to modern life, offering a range of benefits from cost-effectiveness and versatility to innovative applications and performance characteristics. While they pose environmental challenges, ongoing research and development aim to create more sustainable and eco-friendly alternatives. Understanding the importance of synthetic fibers helps in appreciating their role in the economy, industry, and daily life, while also emphasizing the need for sustainable practices and innovation.
4. Centrality in Social Networks Intuitively, we want a method that allows us to distinguish “important” actors. Consider the following graphs:
5. The most intuitive notion of centrality focuses on degree: The actor with the most ties is the most important: Centrality in Social Networks Degree
6. Degree Distribution In a simple random graph (G n,p ), degree will have a Poisson distribution, and the nodes with high degree are likely to be at the intuitive center. Deviations from a Poisson distribution suggest non-random processes, which is at the heart of current “scale-free” work on networks (see below).
8. Normalizing Degree If we want to measure the degree to which the graph as a whole is centralized, we look at the dispersion of centrality: Simple: variance of the individual centrality scores. Or, using Freeman’s general formula for centralization (which ranges from 0 to 1):
10. Closeness Centrality An actor is considered important if he/she is relatively close to all other actors. Closeness is based on the inverse of the distance of each actor to every other actor in the network. Closeness Centrality: Normalized Closeness Centrality
14. Betweenness Betweenness Centrality: Model based on communication flow: A person who lies on communication paths can control communication flow, and is thus important. Betweenness centrality counts the number of shortest paths between i and k that actor j resides on. b a C d e f g h
15. Calculating Betweenness Betweenness Centrality: Where g jk = the number of geodesics connecting jk , and g jk (n i ) = the number that actor i is on. Usually normalized by:
18. Information Centrality It is quite likely that information can flow through paths other than the geodesic. The Information Centrality score uses all paths in the network, and weights them based on their length.
19. Graph Theoretic Center Graph Theoretic Center (Barry or Jordan Center). Identify the point(s) with the smallest, maximum distance to all other points. Value = longest distance to any other node. The graph theoretic center is ‘3’, but you might also consider a continuous measure as the inverse of the maximum geodesic
20.
21.
22. Intepretation of Eigenvector Centrality Bonacich Power Centrality: The magnitude of reflects the radius of power. Small values of weight local structure, larger values weight global structure. If is positive, then ego has higher centrality when tied to people who are central. If is negative, then ego has higher centrality when tied to people who are not central. As approaches zero, you get degree centrality.
26. Dimensions of Centrality In recent work, Borgatti (2003; 2005) discusses centrality in terms of two key dimensions: Radial Medial Frequency Distance Degree Centrality Bon. Power centrality Closeness Centrality Betweenness (empty: but would be an interruption measure based on distance)
27.
28.
29.
30.
31.
32.
33.
34.
35.
36. Total Effects Centrality (Friedkin). Very similar to the Bonacich measure, it is based on an assumed peer influence model. The formula is: Where W is a row-normalized adjacency matrix, and is a weight for the amount of interpersonal influence
37. Find that each matter for interpersonal communication, and that communication is what matters most for interpersonal influence. + + + Noah Friedkin: Structural bases of interpersonal influence in groups
45. Baker & Faulkner: Social Organization of Conspiracy Questions: How are relations organized to facilitate illegal behavior? They show that the pattern of communication maximizes concealment, and predicts the criminal verdict. Inter-organizational cooperation is common, but too much ‘cooperation’ can thwart market competition, leading to (illegal) market failure. Illegal networks differ from legal networks, in that they must conceal their activity from outside agents. A “Secret society” should be organized to (a) remain concealed and (b) if discovered make it difficult to identify who is involved in the activity The need for secrecy should lead conspirators to conceal their activities by creating sparse and decentralized networks.
46. Baker & Faulkner: Social Organization of Conspiracy Secrets in a Southern Sorority:
53. From an individual standpoint, actors want to be central to get the benefits, but peripheral to remain concealed. They examine the effect of Degree, Betweenness and Closeness centrality on the criminal outcomes, based on reconstruction of the communication networks involved. At the organizational level, they find decentralized networks in the two low information-processing conspiracies, but high centralization in the other. Thus, a simple product can be organized without centralization. At the individual level, that degree centrality (net of other factors) predicts verdict,
54. Information Low High Secrecy Low High Centralized Decentralized Decentralized Centralized