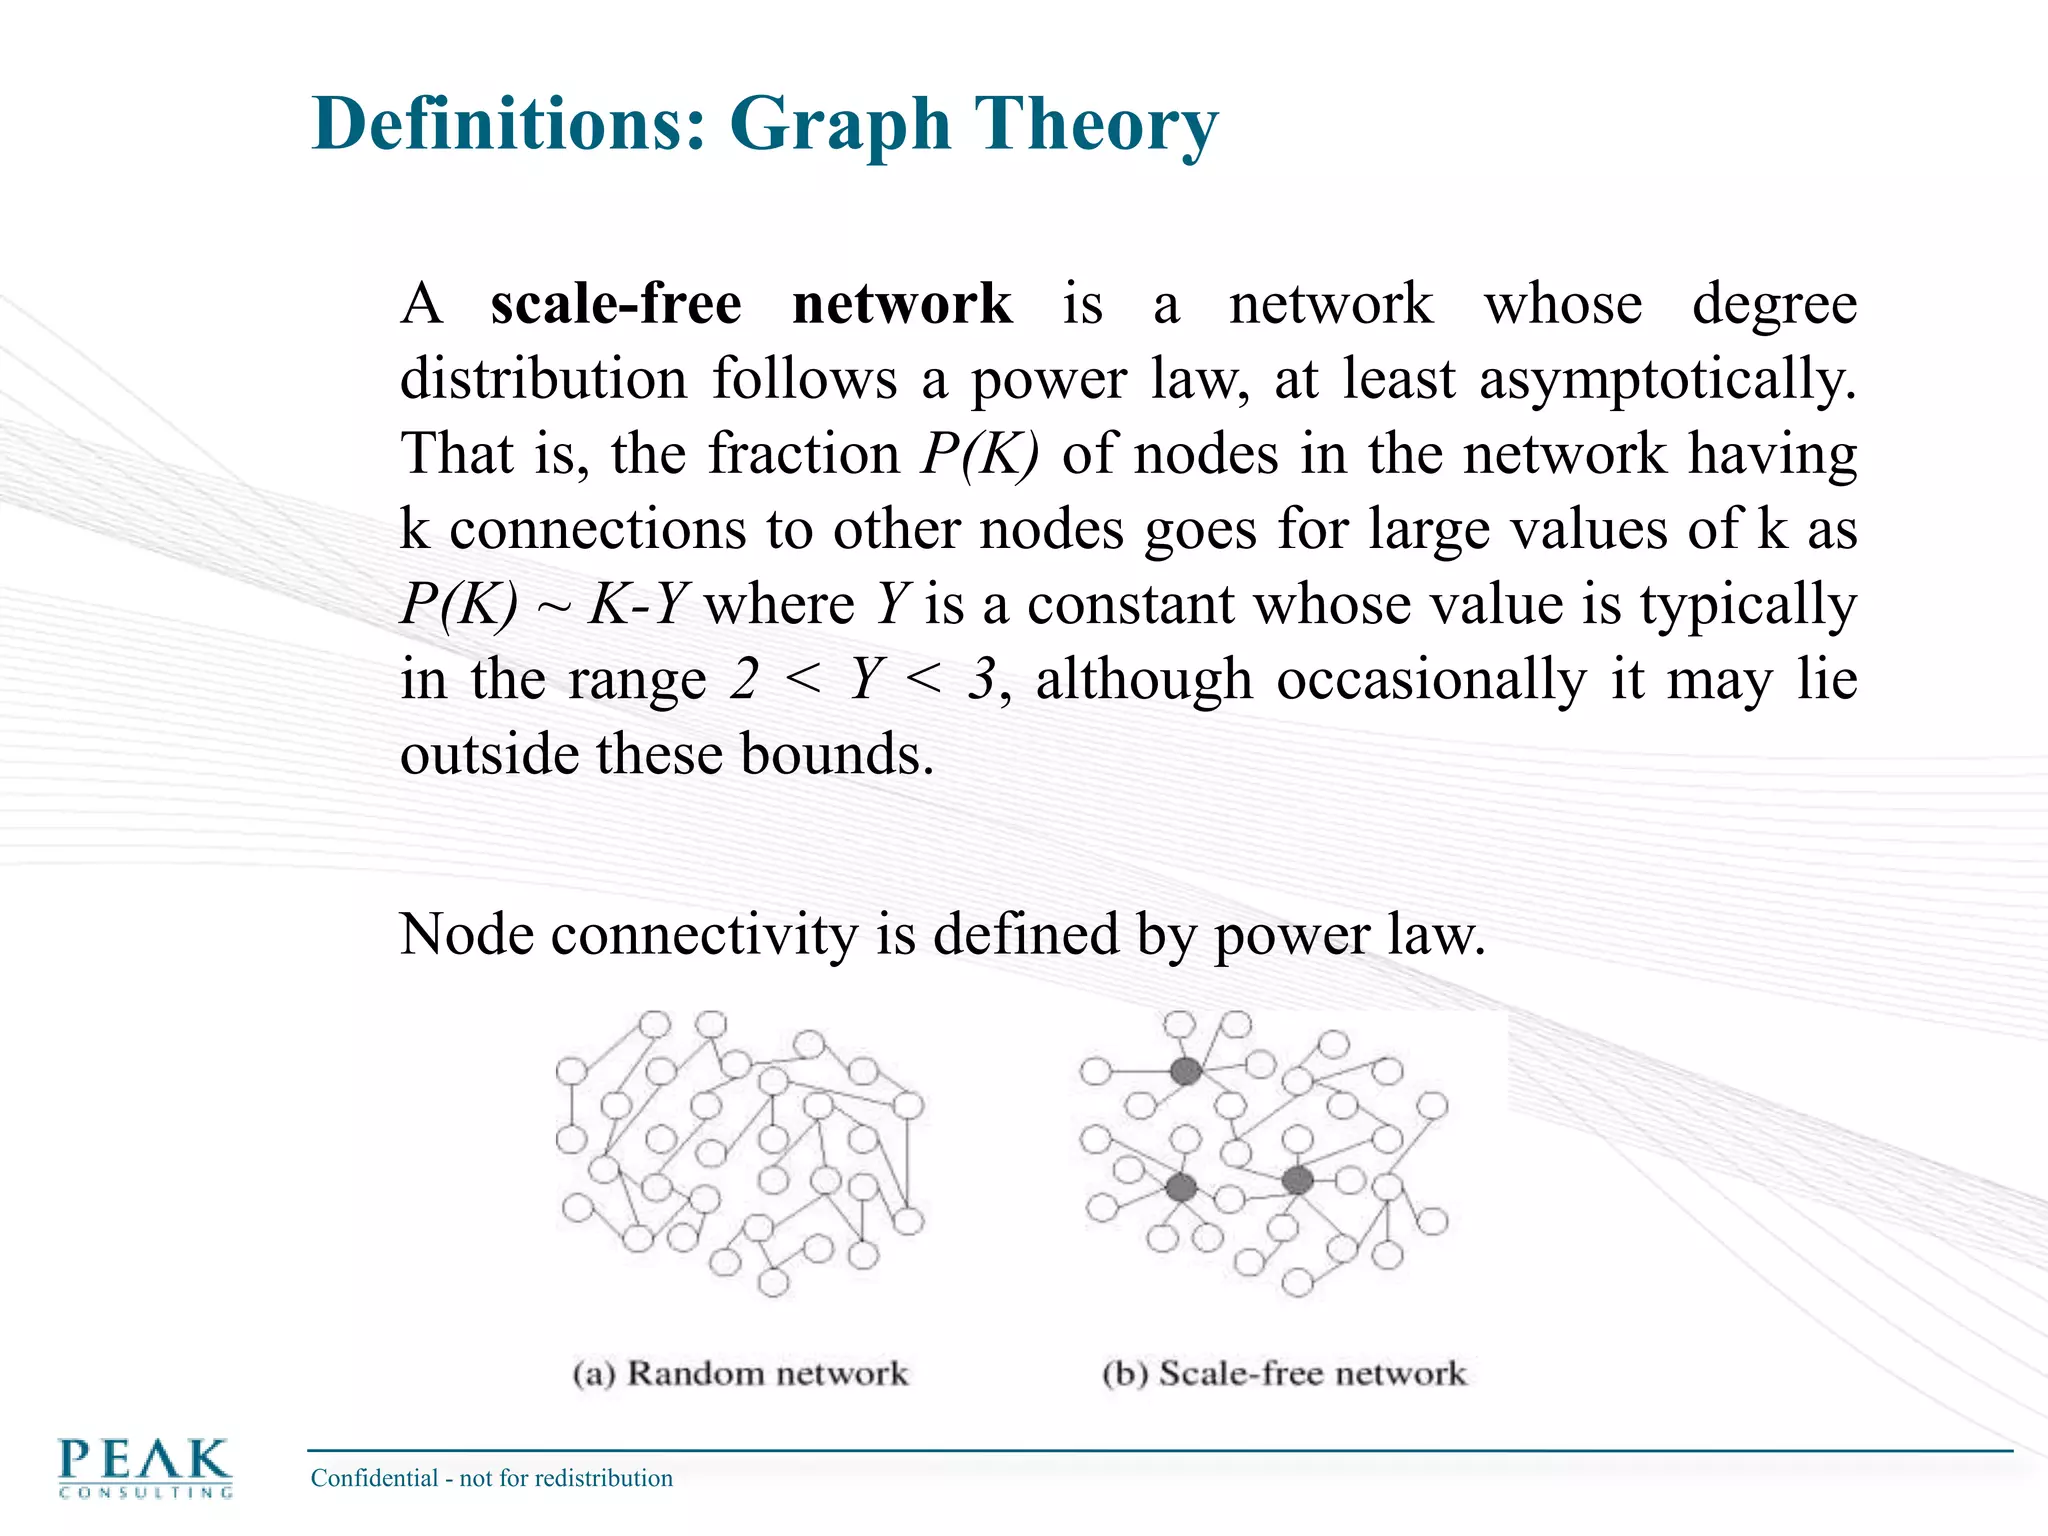
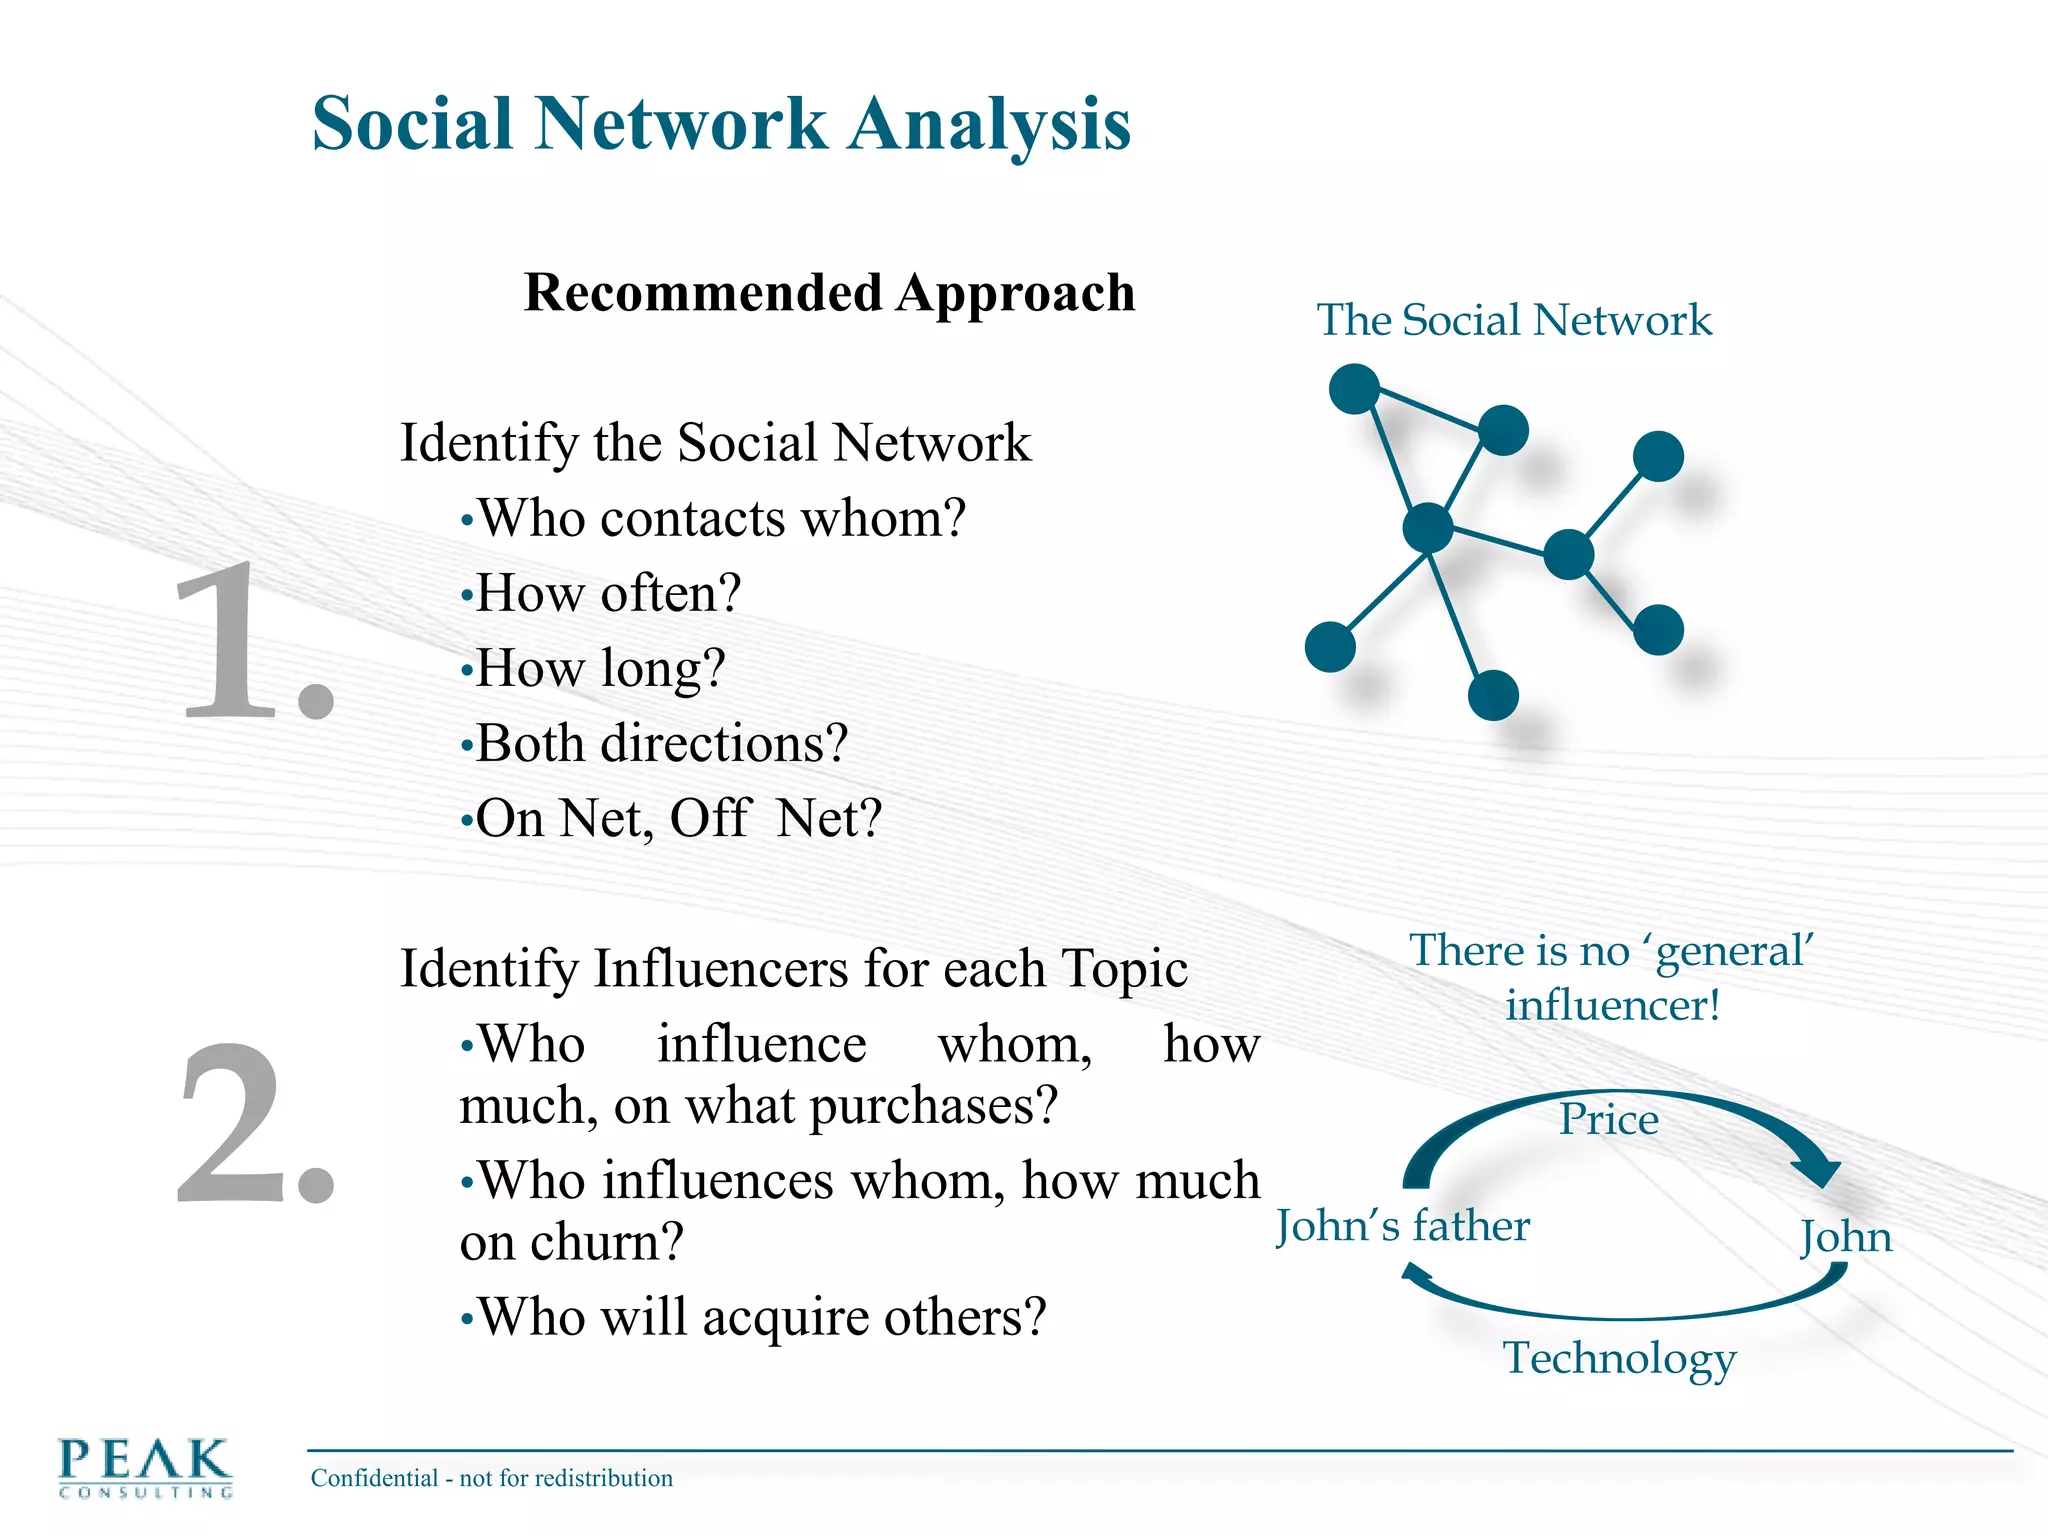
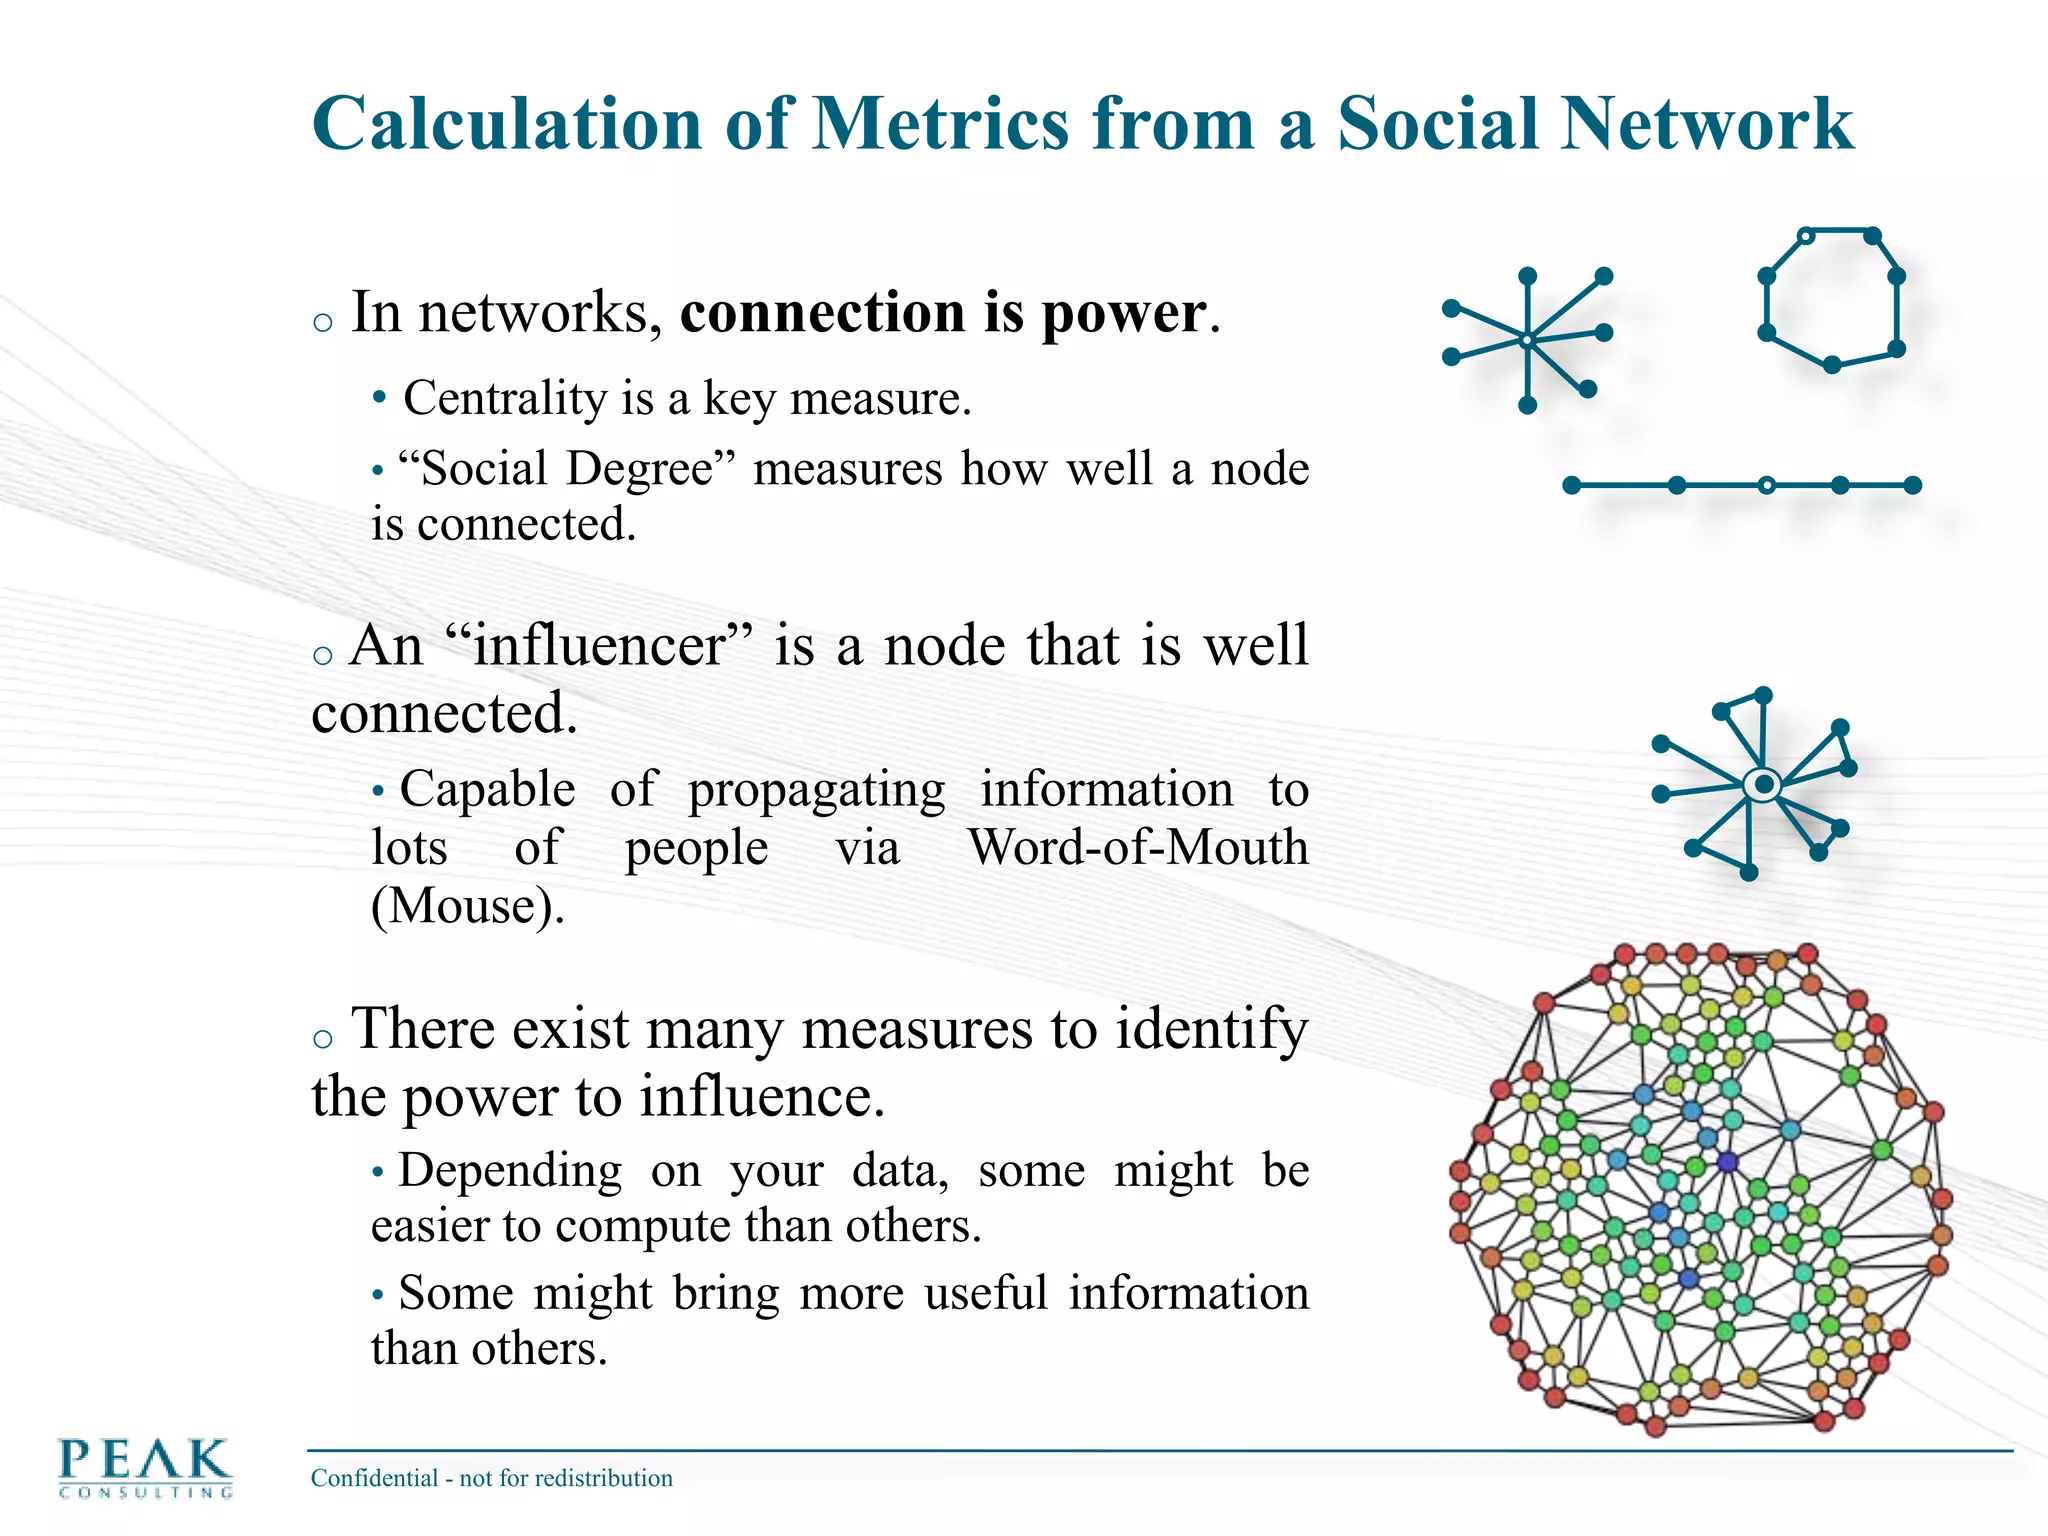
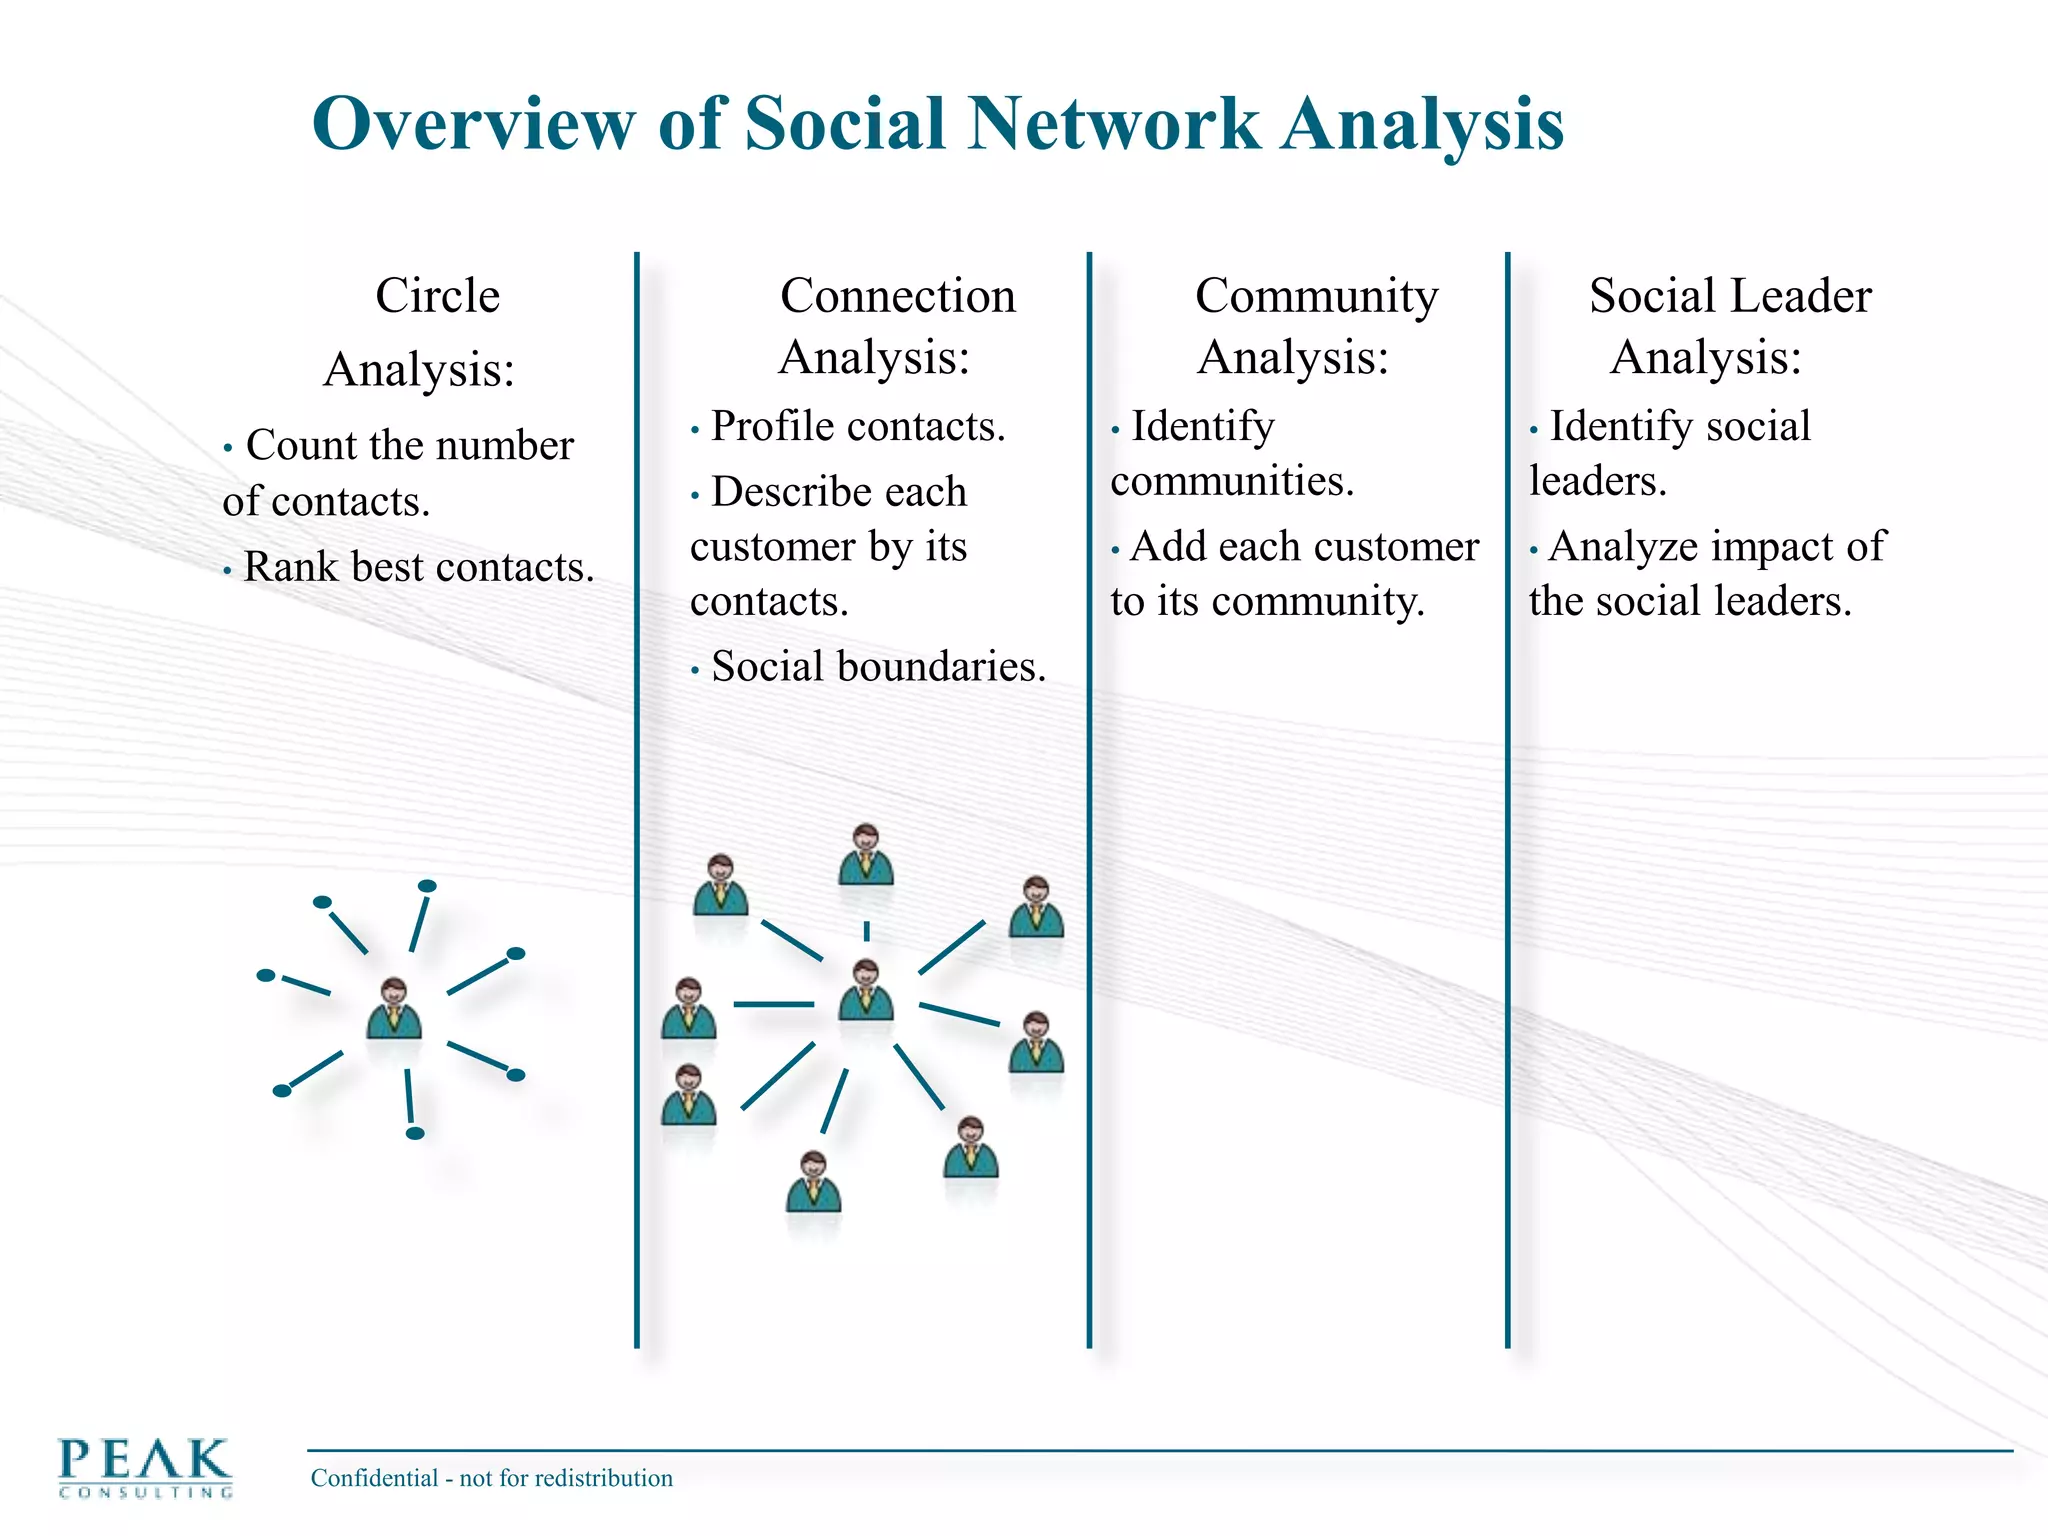
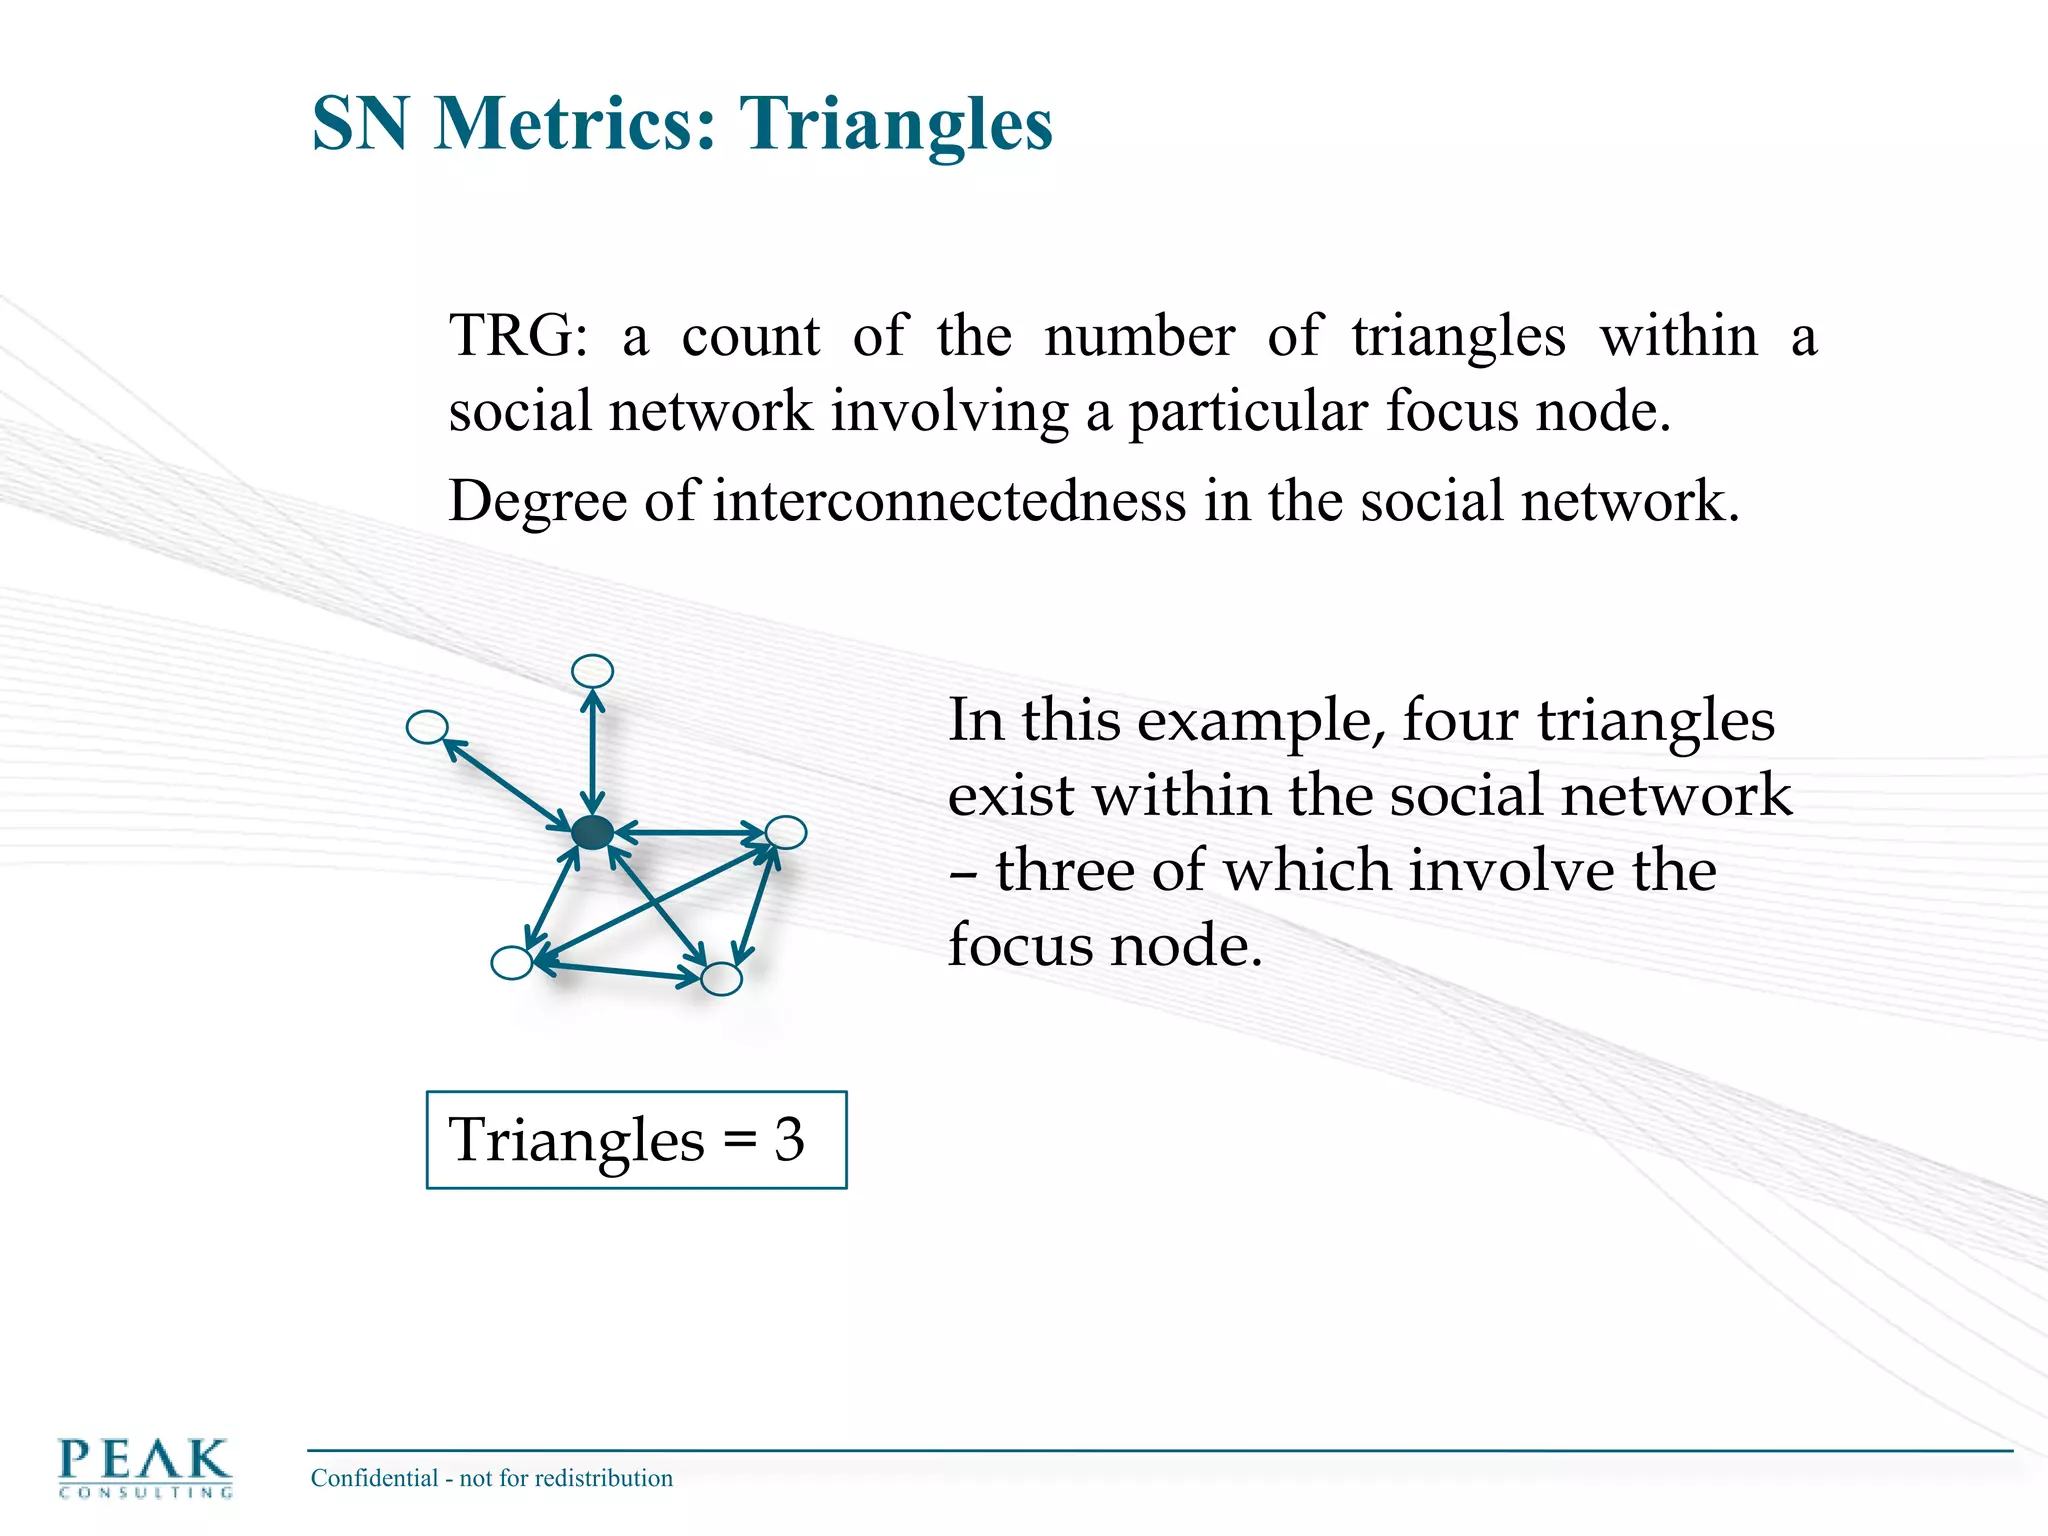
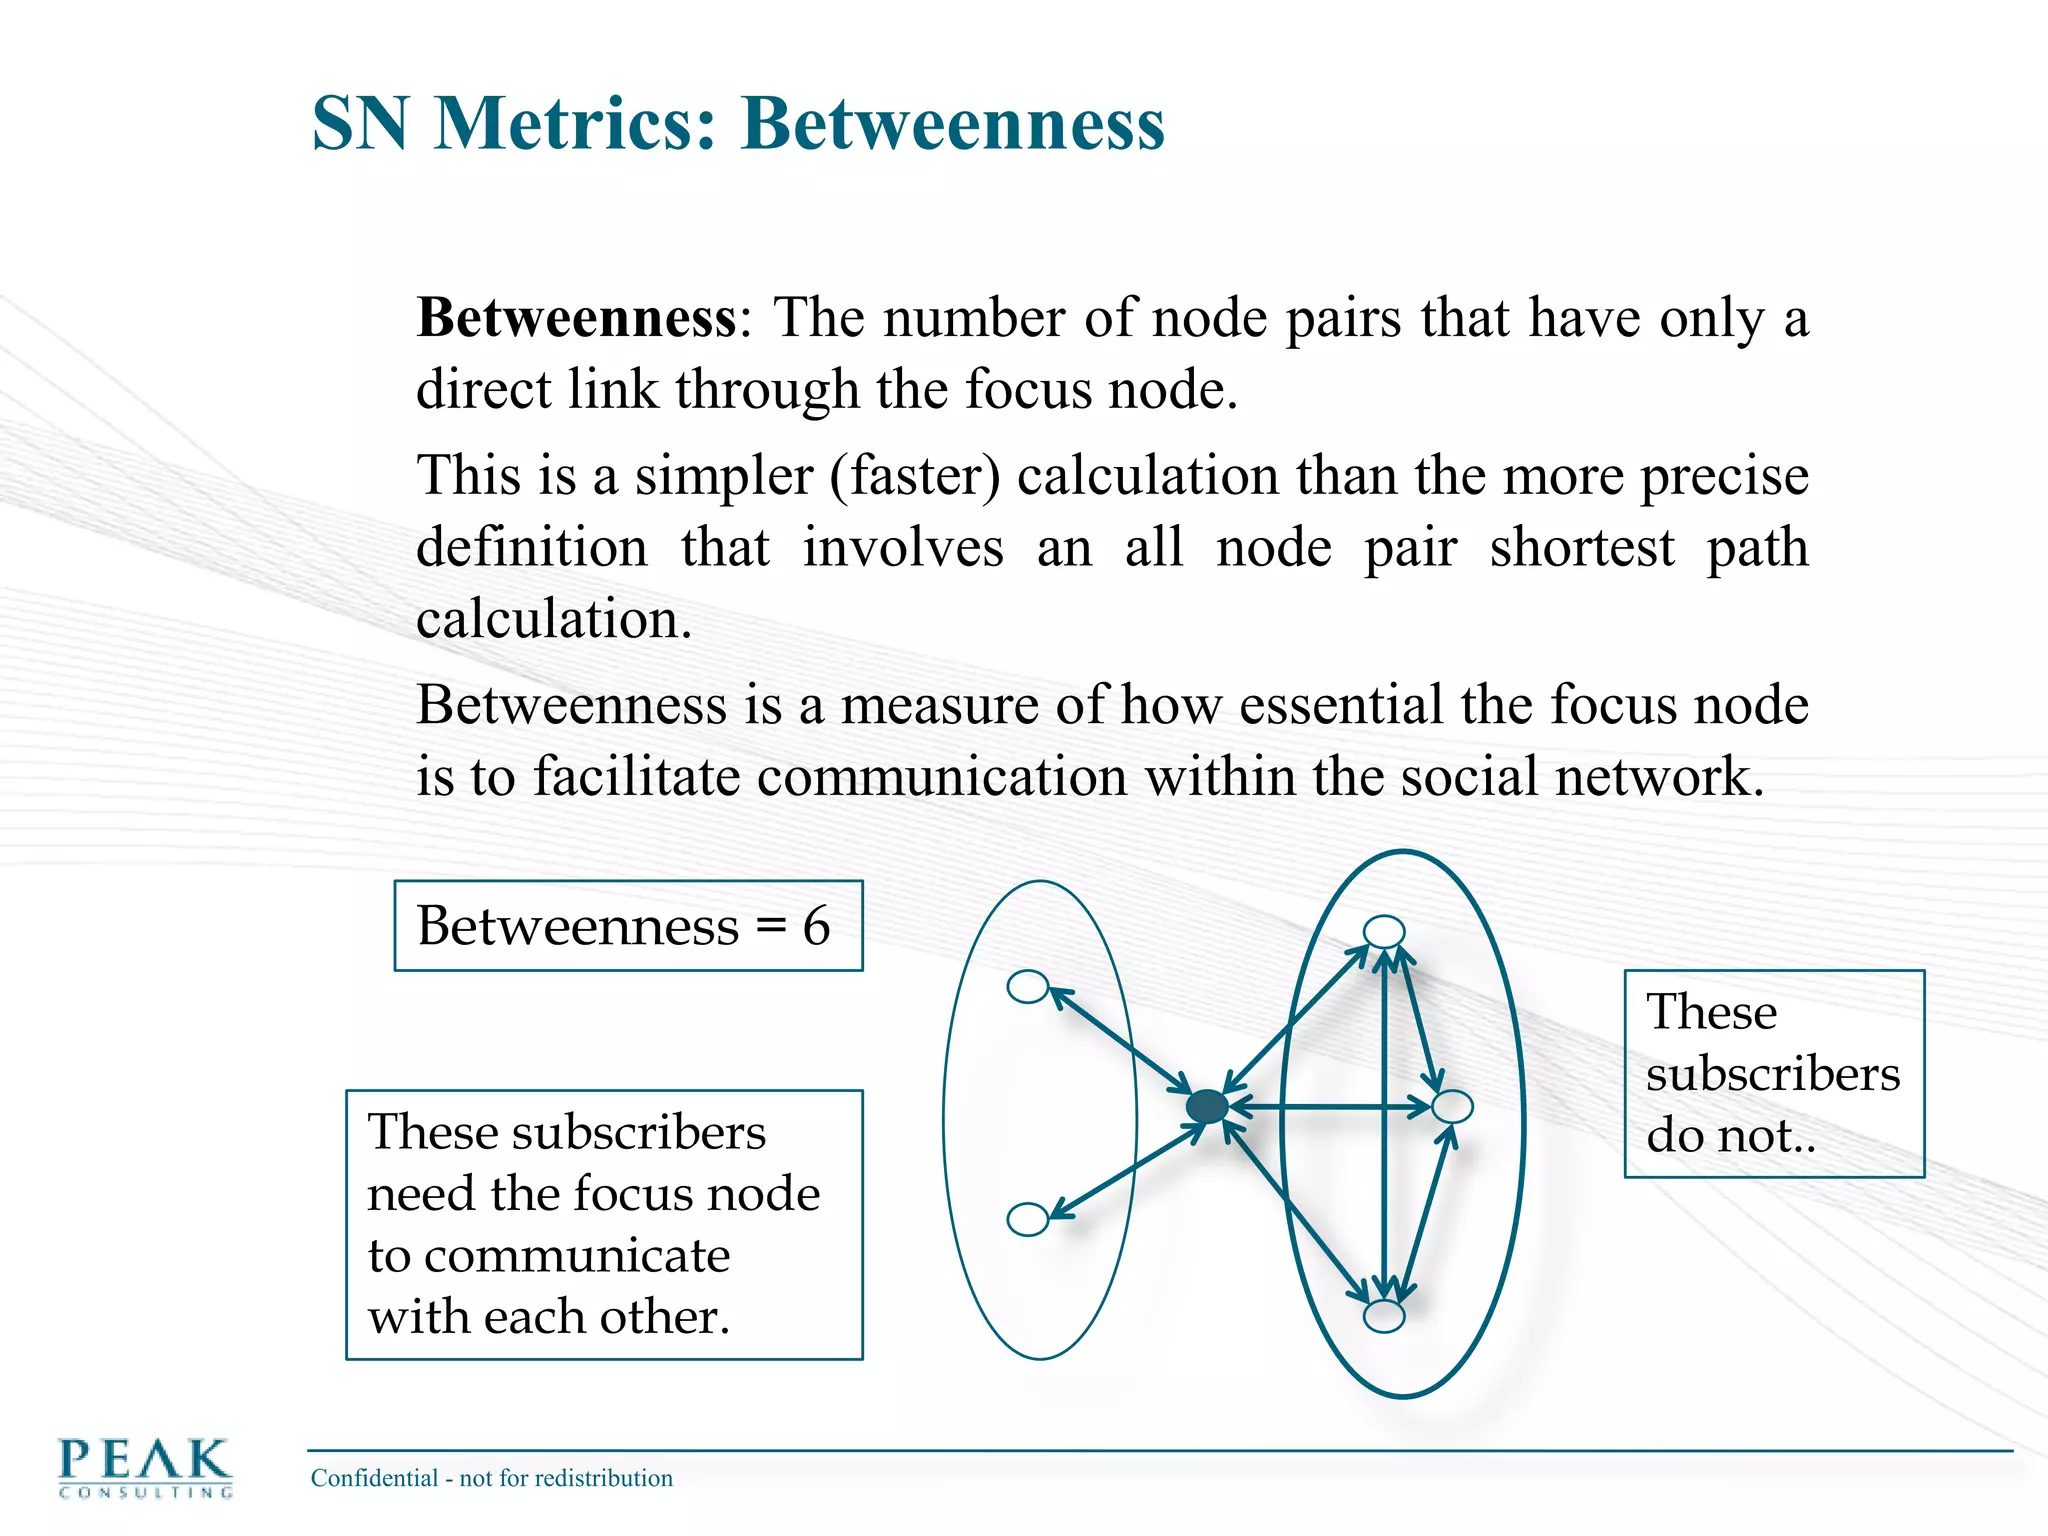
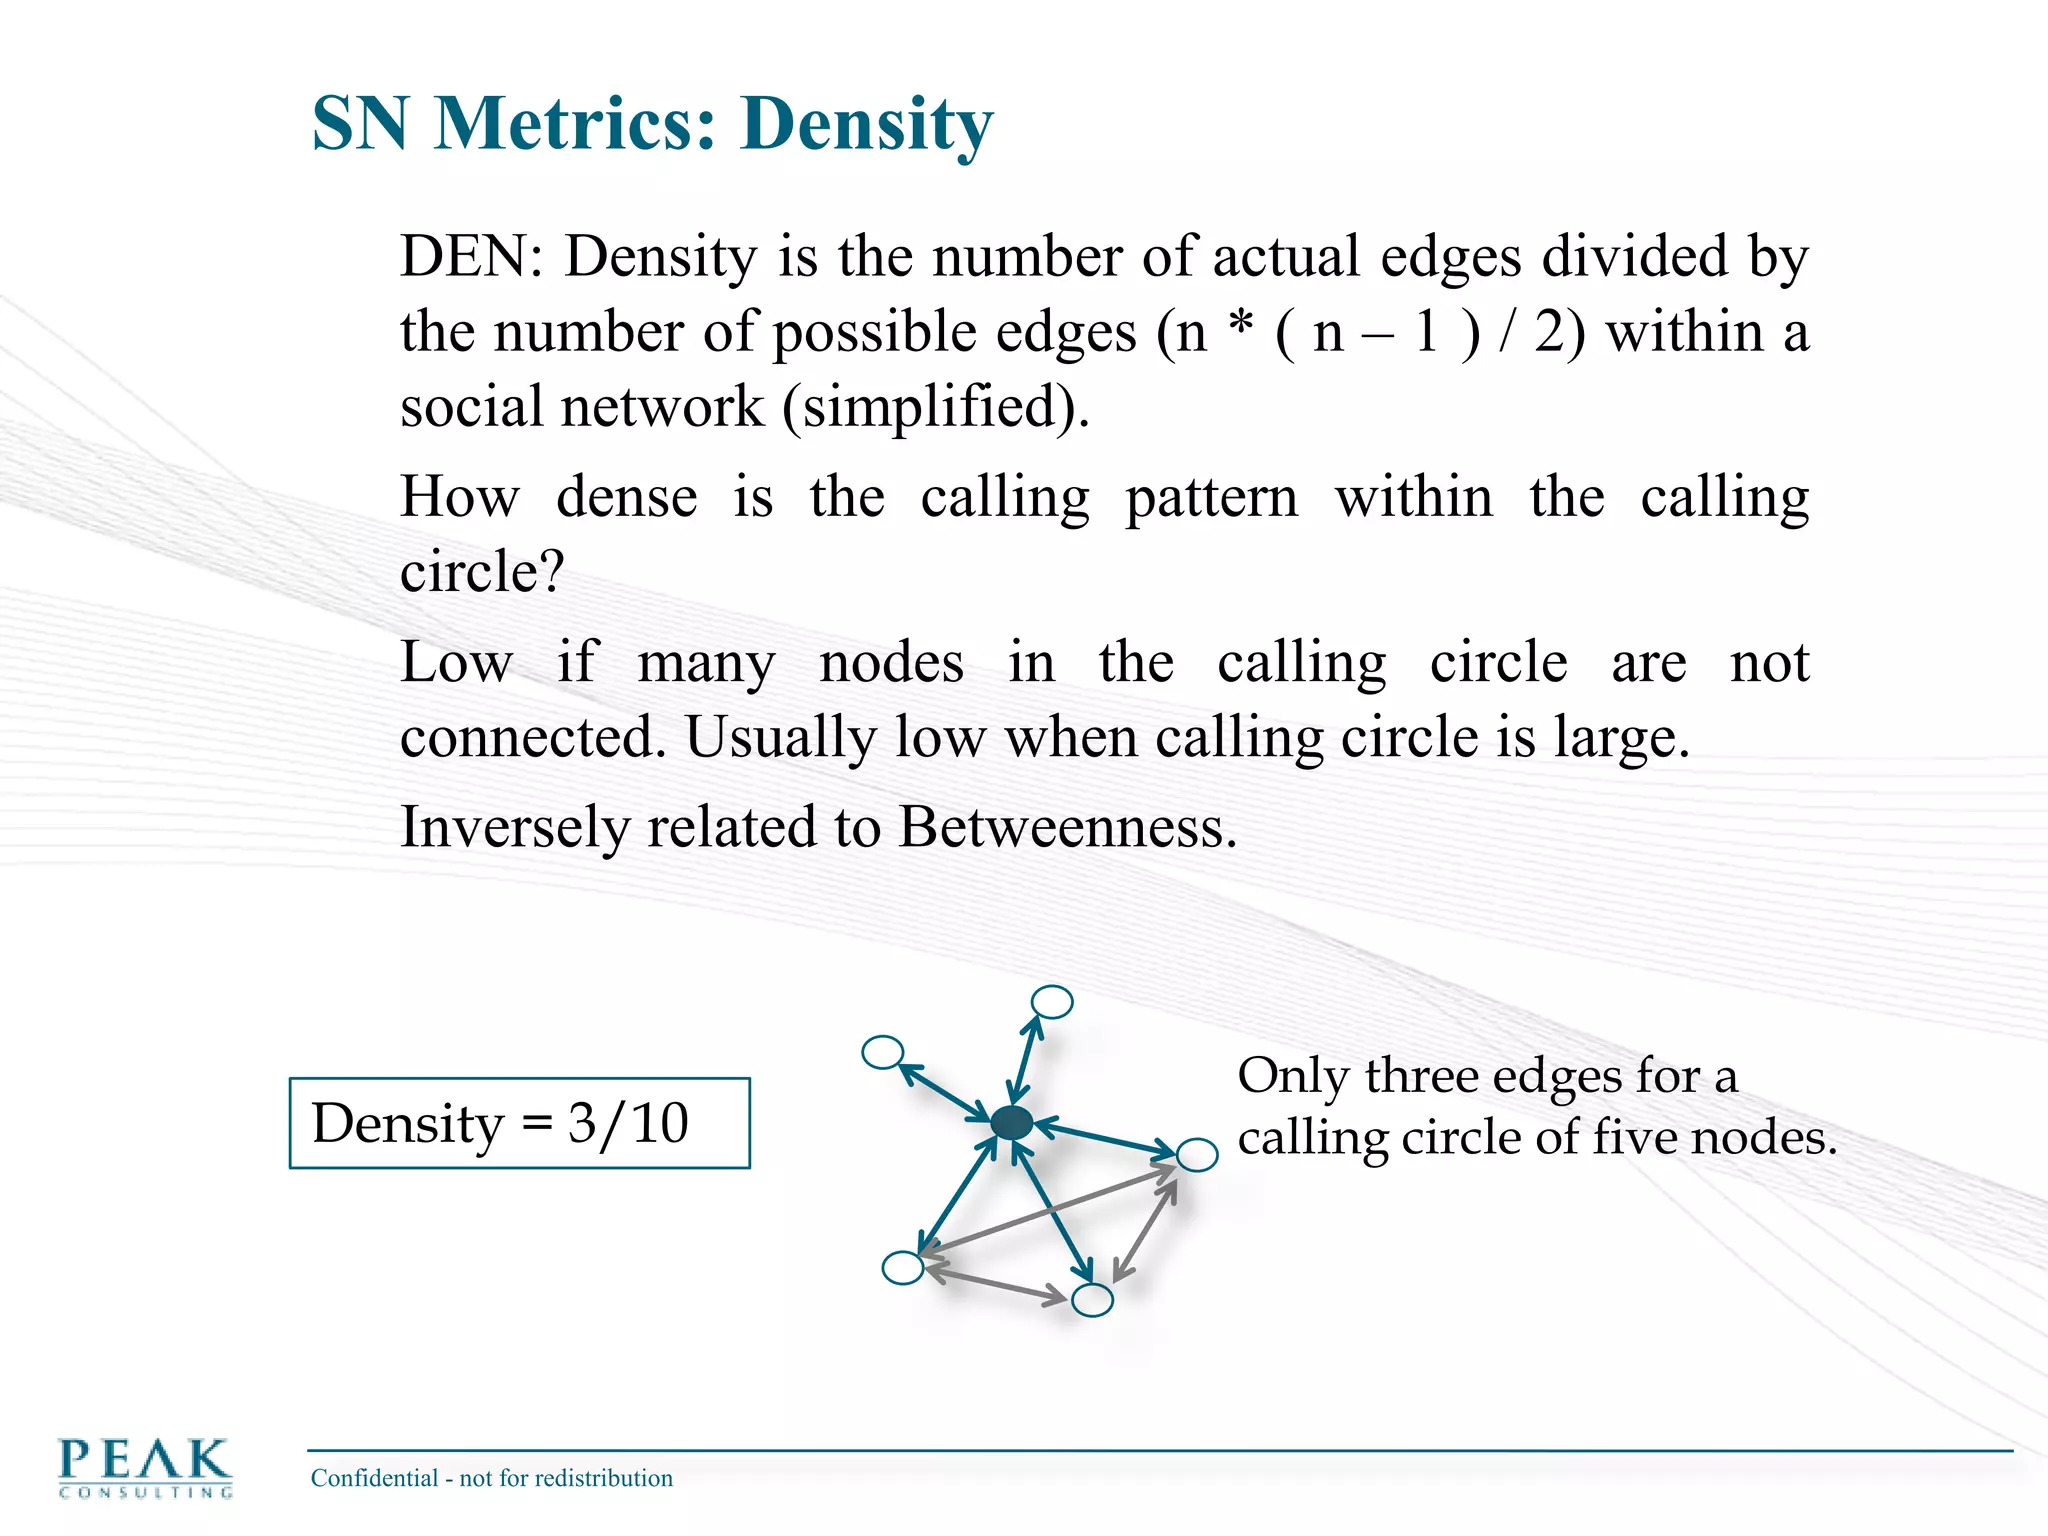
SlideShare a Scribd company logo
1 of 73
Social Network Analysis: Practical Uses and Implementation
[object Object]
 Metrics and Implementation
 Social Network Analysis with Relationships
 Social Network Analysis with Transactions
 Conclusions,[object Object]
Definitions: Social Network Social Network: A social structure composed of individuals (or organizations) interconnected by one or more specific types of interdependencies such as friendship, kinship, financial exchanges, communication  exchanges, etc.
Definitions: Social Network Analysis Social Network Analysis: The application of graph theory to understand, categorize and quantify relationships in a social network. In the representation of a social network, nodes in a graph represent the individuals or organizations (actors) and edges in the graph represent interdependencies. Edges may be either directed or non-directed. Confidential - not for redistribution
Definitions: Social Network Analysis Confidential - not for redistribution  Rather than treating individuals (persons, organizations) as discrete units of analysis, social network analysis focuses on how the structure of ties (links) affects individuals and their relationships. Not a new science: ,[object Object]
Formalized by J.A. Barnes 50+ years ago.
Six degrees of separation small world phenomena.
Stanley Milgram’s post mail experiments.
Watts, Dodds, Muhamed email study.A boom of popular press: ,[object Object]
Watts: Small Worlds: The Dynamics of Networks Berween Order and Randomness.
Barabasi: Linked: The New Science of Networks
Watts: Six Degrees: The Science of a Connected Age,[object Object]
Definitions: Graph Theory	 A scale-free network is a network whose degree distribution follows a power law, at least asymptotically. That is, the fraction P(K) of nodes in the network having k connections to other nodes goes for large values of k as P(K) ~ K-Y where Y is a constant whose value is typically in the range 2 < Y < 3, although occasionally it may lie outside these bounds. Node connectivity is defined by power law. Confidential - not for redistribution
Definitions: Graph Theory The shape of a social network can influence its behaviour and usefulness. ,[object Object]
 In-breeding of ideas: persons who only interact with each other share the same ideas and opportunities.
 Characterized by a (near) fully connected graph.
 “Open” social networks have loose ties (weak links) across multiple communities.
 More likely to introduce new ideas and opportunities to their members.
 Requires connector nodes to bridge across.Confidential - not for redistribution
Definitions: Graph Theory ,[object Object]
 An N-Clique is a subgraph of N nodes (actors) which are fully connected (“closed” network).
 Maximum clique detection within a graph is an NP-complete computational problem.
 A K-plex is a less strict subset of the graph.
 A giant component is a connected subgraph that contains a majority of an entire graph’s nodes.Confidential - not for redistribution
Social Network Analysis Circle analysis: ,[object Object]
 Count neighbours (degree).
 Count those in circle@
 Who churned,
 Who have a product P,
 Who became customers after node A,
…..
 Enrichnode label with these metrics.Confidential - not for redistribution  A
Key Observation: Few Isolated Communities Exist in the Real World ,[object Object],of a single mega-community. ,[object Object],artificial decisions. ,[object Object]
Five random starting
subscribers.
Count number of new subscribers in degree 1, degree 2, etc.
Conclusion: Peak numbers between degree 5 and degree 7. Very few new subscribers after degree 8. Most subscribers are interconnected, rather than in discrete communities. Confidential - not for redistribution
An example with real world data: 73,277From 5 to 22 nodes: Singletons- 320 communities. 	15,666	   2,658	            653		- 1905 nodes. pairs	triangles	       squares Large Component of 1.1M nodes (with off-network nodes =  3.6M) Confidential - not for redistribution  Key Observation: Few Isolated Communities Exist in the Real World
Why should you care about SNA? ,[object Object]
If you want to sell lots of stuff to your customers… do it in a viral way (target the “right” customers).
Use  social network analysis to understand more about your customers and their communities.
Enhance existing reports, modelling tools, and methodologies with social metrics.Confidential - not for redistribution
Why should you care about SNA? Traditional marketing practices are becoming obsolete. ,[object Object]
Information exchange between individuals within an online social network is extremely high.
Difficult to keep control group “pure”.
 Need to understand behaviour across and within communities rather than focusing just on individuals.
 Leverage (and protect against) high velocity of information exchange within on-line social  networks.Confidential - not for redistribution
How does a Customer with the Role of an Influencer in the Social Network Work? ,[object Object]
 Influential user tells (and influences) his or her immediate contacts within the community.
 These immediate contacts tell their contacts.
 ...and the viral marketing spreads.It is important… ,[object Object]
 To influence these people.
 To monitor the behaviour of these people.Confidential - not for redistribution
Roles in a social Network MalcomGladwell characterized key actors in a social network in his seminal work The Tipping Point: Connector: people who “link us up with the world … people with a special gift for bringing the world together”. Gladwell characterizes these individuals as having social networks of over one hundred people. Salesperson: people who are charismatic with powerful negotiation skills. They tend to have an indefinable trait that goes beyond what they say, which makes others want to agree with them. Maven: people who are “information specialists” or “people we rely upon to connect us with new information”. They accumulate knowledge, especially about the marketplace, and know how to share it with others. Confidential - not for redistribution
Social Network Analysis Recommended Approach Identify the Social Network ,[object Object]
How often?
How long?
Both directions?
On Net, Off  Net?Identify Influencers for each Topic ,[object Object]
Who influences whom, how much on churn?
Who will acquire others?Confidential - not for redistribution  The Social Network 1. There is no ‘general’ influencer! 2. Price John’s father John Technology
Metrics andImplementation Confidential - not for redistribution
Calculation of Metrics from a Social Network ,[object Object]
Centrality is a key measure.
 “Social Degree” measures how well a node is connected.
 An “influencer” is a node that is well connected.
 Capable of propagating information to lots of people via Word-of-Mouth (Mouse).
 There exist many measures to identify the power to influence.
 Depending on your data, some might be easier to compute than others.

More Related Content

What's hot

02 Network Data Collection
02 Network Data Collection02 Network Data Collection
02 Network Data Collectiondnac
 
01 Introduction to Networks Methods and Measures
01 Introduction to Networks Methods and Measures01 Introduction to Networks Methods and Measures
01 Introduction to Networks Methods and Measuresdnac
 
Preso on social network analysis for rtp analytics unconference
Preso on social network analysis for rtp analytics unconferencePreso on social network analysis for rtp analytics unconference
Preso on social network analysis for rtp analytics unconferenceBruce Conner
 
Overview Of Network Analysis Platforms
Overview Of Network Analysis PlatformsOverview Of Network Analysis Platforms
Overview Of Network Analysis PlatformsNoah Flower
 
Social Network Analysis
Social Network AnalysisSocial Network Analysis
Social Network AnalysisScott Gomer
 
The Mathematics of Social Network Analysis: Metrics for Academic Social Networks
The Mathematics of Social Network Analysis: Metrics for Academic Social NetworksThe Mathematics of Social Network Analysis: Metrics for Academic Social Networks
The Mathematics of Social Network Analysis: Metrics for Academic Social NetworksEditor IJCATR
 
Pilkada DKI 2017 Social Network Model (Early Report)
Pilkada DKI 2017 Social Network Model (Early Report)Pilkada DKI 2017 Social Network Model (Early Report)
Pilkada DKI 2017 Social Network Model (Early Report)Andry Alamsyah
 
Social network analysis course 2010 - 2011
Social network analysis course 2010 - 2011Social network analysis course 2010 - 2011
Social network analysis course 2010 - 2011guillaume ereteo
 
Social Network Analysis
Social Network AnalysisSocial Network Analysis
Social Network AnalysisSujoy Bag
 
Social Network Analysis power point presentation
Social Network Analysis power point presentation Social Network Analysis power point presentation
Social Network Analysis power point presentation Ratnesh Shah
 
A comparative study of social network analysis tools
A comparative study of social network analysis toolsA comparative study of social network analysis tools
A comparative study of social network analysis toolsDavid Combe
 
Making the invisible visible through SNA
Making the invisible visible through SNAMaking the invisible visible through SNA
Making the invisible visible through SNAMYRA School of Business
 
The Basics of Social Network Analysis
The Basics of Social Network AnalysisThe Basics of Social Network Analysis
The Basics of Social Network AnalysisRory Sie
 
Mining and analyzing social media part 2 - hicss47 tutorial - dave king
Mining and analyzing social media   part 2 - hicss47 tutorial - dave kingMining and analyzing social media   part 2 - hicss47 tutorial - dave king
Mining and analyzing social media part 2 - hicss47 tutorial - dave kingDave King
 

What's hot (20)

Social Network Analysis
Social Network AnalysisSocial Network Analysis
Social Network Analysis
 
Social network analysis
Social network analysisSocial network analysis
Social network analysis
 
02 Network Data Collection
02 Network Data Collection02 Network Data Collection
02 Network Data Collection
 
01 Introduction to Networks Methods and Measures
01 Introduction to Networks Methods and Measures01 Introduction to Networks Methods and Measures
01 Introduction to Networks Methods and Measures
 
01 Network Data Collection (2017)
01 Network Data Collection (2017)01 Network Data Collection (2017)
01 Network Data Collection (2017)
 
Preso on social network analysis for rtp analytics unconference
Preso on social network analysis for rtp analytics unconferencePreso on social network analysis for rtp analytics unconference
Preso on social network analysis for rtp analytics unconference
 
Overview Of Network Analysis Platforms
Overview Of Network Analysis PlatformsOverview Of Network Analysis Platforms
Overview Of Network Analysis Platforms
 
Social Network Analysis
Social Network AnalysisSocial Network Analysis
Social Network Analysis
 
The Mathematics of Social Network Analysis: Metrics for Academic Social Networks
The Mathematics of Social Network Analysis: Metrics for Academic Social NetworksThe Mathematics of Social Network Analysis: Metrics for Academic Social Networks
The Mathematics of Social Network Analysis: Metrics for Academic Social Networks
 
Social Network Analysis (SNA)
Social Network Analysis (SNA)Social Network Analysis (SNA)
Social Network Analysis (SNA)
 
Pilkada DKI 2017 Social Network Model (Early Report)
Pilkada DKI 2017 Social Network Model (Early Report)Pilkada DKI 2017 Social Network Model (Early Report)
Pilkada DKI 2017 Social Network Model (Early Report)
 
Social network analysis course 2010 - 2011
Social network analysis course 2010 - 2011Social network analysis course 2010 - 2011
Social network analysis course 2010 - 2011
 
Social Network Analysis
Social Network AnalysisSocial Network Analysis
Social Network Analysis
 
Social Network Analysis power point presentation
Social Network Analysis power point presentation Social Network Analysis power point presentation
Social Network Analysis power point presentation
 
A comparative study of social network analysis tools
A comparative study of social network analysis toolsA comparative study of social network analysis tools
A comparative study of social network analysis tools
 
02 Descriptive Statistics (2017)
02 Descriptive Statistics (2017)02 Descriptive Statistics (2017)
02 Descriptive Statistics (2017)
 
Making the invisible visible through SNA
Making the invisible visible through SNAMaking the invisible visible through SNA
Making the invisible visible through SNA
 
The Basics of Social Network Analysis
The Basics of Social Network AnalysisThe Basics of Social Network Analysis
The Basics of Social Network Analysis
 
Mining and analyzing social media part 2 - hicss47 tutorial - dave king
Mining and analyzing social media   part 2 - hicss47 tutorial - dave kingMining and analyzing social media   part 2 - hicss47 tutorial - dave king
Mining and analyzing social media part 2 - hicss47 tutorial - dave king
 
11 Keynote (2017)
11 Keynote (2017)11 Keynote (2017)
11 Keynote (2017)
 

Similar to Social Network Analysis

Social network analysis (SNA) - Big data and social data - Telecommunications...
Social network analysis (SNA) - Big data and social data - Telecommunications...Social network analysis (SNA) - Big data and social data - Telecommunications...
Social network analysis (SNA) - Big data and social data - Telecommunications...Wael Elrifai
 
Least Cost Influence by Mapping Online Social Networks
Least Cost Influence by Mapping Online Social Networks Least Cost Influence by Mapping Online Social Networks
Least Cost Influence by Mapping Online Social Networks paperpublications3
 
02 Introduction to Social Networks and Health: Key Concepts and Overview
02 Introduction to Social Networks and Health: Key Concepts and Overview02 Introduction to Social Networks and Health: Key Concepts and Overview
02 Introduction to Social Networks and Health: Key Concepts and OverviewDuke Network Analysis Center
 
01 Introduction to Networks Methods and Measures (2016)
01 Introduction to Networks Methods and Measures (2016)01 Introduction to Networks Methods and Measures (2016)
01 Introduction to Networks Methods and Measures (2016)Duke Network Analysis Center
 
Social Network Analysis (SNA) 2018
Social Network Analysis  (SNA) 2018Social Network Analysis  (SNA) 2018
Social Network Analysis (SNA) 2018Arsalan Khan
 
Sharma social networks
Sharma social networksSharma social networks
Sharma social networkskeuvoh7883
 
Sharma Social Networks (Tin180 Com)
Sharma Social Networks (Tin180 Com)Sharma Social Networks (Tin180 Com)
Sharma Social Networks (Tin180 Com)Tin180 VietNam
 
Sharma social crear red
Sharma social crear redSharma social crear red
Sharma social crear redkeuvoh7883
 
Nm4881 a social network analysis week 6
Nm4881 a social network analysis week 6Nm4881 a social network analysis week 6
Nm4881 a social network analysis week 6jiahao84
 
00 Introduction to SN&H: Key Concepts and Overview
00 Introduction to SN&H: Key Concepts and Overview00 Introduction to SN&H: Key Concepts and Overview
00 Introduction to SN&H: Key Concepts and OverviewDuke Network Analysis Center
 
Thinking in networks – #RENAschool
Thinking in networks – #RENAschoolThinking in networks – #RENAschool
Thinking in networks – #RENAschoolAlberto Cottica
 
An improvised model for identifying influential nodes in multi parameter soci...
An improvised model for identifying influential nodes in multi parameter soci...An improvised model for identifying influential nodes in multi parameter soci...
An improvised model for identifying influential nodes in multi parameter soci...csandit
 
2010 Catalyst Conference - Trends in Social Network Analysis
2010 Catalyst Conference - Trends in Social Network Analysis2010 Catalyst Conference - Trends in Social Network Analysis
2010 Catalyst Conference - Trends in Social Network AnalysisMarc Smith
 
Social Network Analysis: An Overview
Social Network Analysis: An OverviewSocial Network Analysis: An Overview
Social Network Analysis: An OverviewPenn State University
 
Thinking in networks: what it means for policy makers
Thinking in networks: what it means for policy makersThinking in networks: what it means for policy makers
Thinking in networks: what it means for policy makersAlberto Cottica
 
Ona For Community Roundtable
Ona For Community RoundtableOna For Community Roundtable
Ona For Community RoundtablePatti Anklam
 
Social Networking Analysis
Social Networking AnalysisSocial Networking Analysis
Social Networking AnalysisMia Horrigan
 
SCALABLE LOCAL COMMUNITY DETECTION WITH MAPREDUCE FOR LARGE NETWORKS
SCALABLE LOCAL COMMUNITY DETECTION WITH MAPREDUCE FOR LARGE NETWORKSSCALABLE LOCAL COMMUNITY DETECTION WITH MAPREDUCE FOR LARGE NETWORKS
SCALABLE LOCAL COMMUNITY DETECTION WITH MAPREDUCE FOR LARGE NETWORKSIJDKP
 

Similar to Social Network Analysis (20)

Social network analysis (SNA) - Big data and social data - Telecommunications...
Social network analysis (SNA) - Big data and social data - Telecommunications...Social network analysis (SNA) - Big data and social data - Telecommunications...
Social network analysis (SNA) - Big data and social data - Telecommunications...
 
Least Cost Influence by Mapping Online Social Networks
Least Cost Influence by Mapping Online Social Networks Least Cost Influence by Mapping Online Social Networks
Least Cost Influence by Mapping Online Social Networks
 
02 Introduction to Social Networks and Health: Key Concepts and Overview
02 Introduction to Social Networks and Health: Key Concepts and Overview02 Introduction to Social Networks and Health: Key Concepts and Overview
02 Introduction to Social Networks and Health: Key Concepts and Overview
 
01 Introduction to Networks Methods and Measures (2016)
01 Introduction to Networks Methods and Measures (2016)01 Introduction to Networks Methods and Measures (2016)
01 Introduction to Networks Methods and Measures (2016)
 
Social Network Analysis (SNA) 2018
Social Network Analysis  (SNA) 2018Social Network Analysis  (SNA) 2018
Social Network Analysis (SNA) 2018
 
Sharma social networks
Sharma social networksSharma social networks
Sharma social networks
 
Sharma Social Networks (Tin180 Com)
Sharma Social Networks (Tin180 Com)Sharma Social Networks (Tin180 Com)
Sharma Social Networks (Tin180 Com)
 
Sharma social crear red
Sharma social crear redSharma social crear red
Sharma social crear red
 
Nm4881 a social network analysis week 6
Nm4881 a social network analysis week 6Nm4881 a social network analysis week 6
Nm4881 a social network analysis week 6
 
00 Introduction to SN&H: Key Concepts and Overview
00 Introduction to SN&H: Key Concepts and Overview00 Introduction to SN&H: Key Concepts and Overview
00 Introduction to SN&H: Key Concepts and Overview
 
SSRI_pt1.ppt
SSRI_pt1.pptSSRI_pt1.ppt
SSRI_pt1.ppt
 
Thinking in networks – #RENAschool
Thinking in networks – #RENAschoolThinking in networks – #RENAschool
Thinking in networks – #RENAschool
 
An improvised model for identifying influential nodes in multi parameter soci...
An improvised model for identifying influential nodes in multi parameter soci...An improvised model for identifying influential nodes in multi parameter soci...
An improvised model for identifying influential nodes in multi parameter soci...
 
2010 Catalyst Conference - Trends in Social Network Analysis
2010 Catalyst Conference - Trends in Social Network Analysis2010 Catalyst Conference - Trends in Social Network Analysis
2010 Catalyst Conference - Trends in Social Network Analysis
 
Sharma social networks
Sharma social networksSharma social networks
Sharma social networks
 
Social Network Analysis: An Overview
Social Network Analysis: An OverviewSocial Network Analysis: An Overview
Social Network Analysis: An Overview
 
Thinking in networks: what it means for policy makers
Thinking in networks: what it means for policy makersThinking in networks: what it means for policy makers
Thinking in networks: what it means for policy makers
 
Ona For Community Roundtable
Ona For Community RoundtableOna For Community Roundtable
Ona For Community Roundtable
 
Social Networking Analysis
Social Networking AnalysisSocial Networking Analysis
Social Networking Analysis
 
SCALABLE LOCAL COMMUNITY DETECTION WITH MAPREDUCE FOR LARGE NETWORKS
SCALABLE LOCAL COMMUNITY DETECTION WITH MAPREDUCE FOR LARGE NETWORKSSCALABLE LOCAL COMMUNITY DETECTION WITH MAPREDUCE FOR LARGE NETWORKS
SCALABLE LOCAL COMMUNITY DETECTION WITH MAPREDUCE FOR LARGE NETWORKS
 

Social Network Analysis

  • 1. Social Network Analysis: Practical Uses and Implementation
  • 2.
  • 3. Metrics and Implementation
  • 4. Social Network Analysis with Relationships
  • 5. Social Network Analysis with Transactions
  • 6.
  • 7. Definitions: Social Network Social Network: A social structure composed of individuals (or organizations) interconnected by one or more specific types of interdependencies such as friendship, kinship, financial exchanges, communication exchanges, etc.
  • 8. Definitions: Social Network Analysis Social Network Analysis: The application of graph theory to understand, categorize and quantify relationships in a social network. In the representation of a social network, nodes in a graph represent the individuals or organizations (actors) and edges in the graph represent interdependencies. Edges may be either directed or non-directed. Confidential - not for redistribution
  • 9.
  • 10. Formalized by J.A. Barnes 50+ years ago.
  • 11. Six degrees of separation small world phenomena.
  • 12. Stanley Milgram’s post mail experiments.
  • 13.
  • 14. Watts: Small Worlds: The Dynamics of Networks Berween Order and Randomness.
  • 15. Barabasi: Linked: The New Science of Networks
  • 16.
  • 17. Definitions: Graph Theory A scale-free network is a network whose degree distribution follows a power law, at least asymptotically. That is, the fraction P(K) of nodes in the network having k connections to other nodes goes for large values of k as P(K) ~ K-Y where Y is a constant whose value is typically in the range 2 < Y < 3, although occasionally it may lie outside these bounds. Node connectivity is defined by power law. Confidential - not for redistribution
  • 18.
  • 19. In-breeding of ideas: persons who only interact with each other share the same ideas and opportunities.
  • 20. Characterized by a (near) fully connected graph.
  • 21. “Open” social networks have loose ties (weak links) across multiple communities.
  • 22. More likely to introduce new ideas and opportunities to their members.
  • 23. Requires connector nodes to bridge across.Confidential - not for redistribution
  • 24.
  • 25. An N-Clique is a subgraph of N nodes (actors) which are fully connected (“closed” network).
  • 26. Maximum clique detection within a graph is an NP-complete computational problem.
  • 27. A K-plex is a less strict subset of the graph.
  • 28. A giant component is a connected subgraph that contains a majority of an entire graph’s nodes.Confidential - not for redistribution
  • 29.
  • 30. Count neighbours (degree).
  • 31. Count those in circle@
  • 33. Who have a product P,
  • 34. Who became customers after node A,
  • 35. …..
  • 36. Enrichnode label with these metrics.Confidential - not for redistribution A
  • 37.
  • 40. Count number of new subscribers in degree 1, degree 2, etc.
  • 41. Conclusion: Peak numbers between degree 5 and degree 7. Very few new subscribers after degree 8. Most subscribers are interconnected, rather than in discrete communities. Confidential - not for redistribution
  • 42. An example with real world data: 73,277From 5 to 22 nodes: Singletons- 320 communities. 15,666 2,658 653 - 1905 nodes. pairs triangles squares Large Component of 1.1M nodes (with off-network nodes = 3.6M) Confidential - not for redistribution Key Observation: Few Isolated Communities Exist in the Real World
  • 43.
  • 44. If you want to sell lots of stuff to your customers… do it in a viral way (target the “right” customers).
  • 45. Use social network analysis to understand more about your customers and their communities.
  • 46. Enhance existing reports, modelling tools, and methodologies with social metrics.Confidential - not for redistribution
  • 47.
  • 48. Information exchange between individuals within an online social network is extremely high.
  • 49. Difficult to keep control group “pure”.
  • 50. Need to understand behaviour across and within communities rather than focusing just on individuals.
  • 51. Leverage (and protect against) high velocity of information exchange within on-line social networks.Confidential - not for redistribution
  • 52.
  • 53. Influential user tells (and influences) his or her immediate contacts within the community.
  • 54. These immediate contacts tell their contacts.
  • 55.
  • 56. To influence these people.
  • 57. To monitor the behaviour of these people.Confidential - not for redistribution
  • 58. Roles in a social Network MalcomGladwell characterized key actors in a social network in his seminal work The Tipping Point: Connector: people who “link us up with the world … people with a special gift for bringing the world together”. Gladwell characterizes these individuals as having social networks of over one hundred people. Salesperson: people who are charismatic with powerful negotiation skills. They tend to have an indefinable trait that goes beyond what they say, which makes others want to agree with them. Maven: people who are “information specialists” or “people we rely upon to connect us with new information”. They accumulate knowledge, especially about the marketplace, and know how to share it with others. Confidential - not for redistribution
  • 59.
  • 63.
  • 64. Who influences whom, how much on churn?
  • 65. Who will acquire others?Confidential - not for redistribution The Social Network 1. There is no ‘general’ influencer! 2. Price John’s father John Technology
  • 66. Metrics andImplementation Confidential - not for redistribution
  • 67.
  • 68. Centrality is a key measure.
  • 69. “Social Degree” measures how well a node is connected.
  • 70. An “influencer” is a node that is well connected.
  • 71. Capable of propagating information to lots of people via Word-of-Mouth (Mouse).
  • 72. There exist many measures to identify the power to influence.
  • 73. Depending on your data, some might be easier to compute than others.
  • 74. Some might bring more useful information than others.Confidential - not for redistribution
  • 75.
  • 76.
  • 77. Describe each customer by its contacts.
  • 78.
  • 79.
  • 80.
  • 82. Target and control group creation.
  • 83. Measurement.Confidential - not for redistribution
  • 84.
  • 85. The Mater Edge defines that a communication exists, and is irrespective of the actual type.
  • 86. Of course, B can reciprocate communicate with A in various ways also: Voice, SMS or MMS. Thus, we allow a separate Edge for that too.
  • 87. That means from A’s perspective there could be a maximum of 8 Edges associated with A if all communication types are used and reciprocated with B.
  • 88. Edge IDs are unique system wide.Confidential - not for redistribution Master Out 8 Voice Out 6 SMS Out 1 MMS Out 1 A B MMS In 2 SMS In 3 Voice Out 20 Master Out 25 Performed for on-net and off-net numbers.
  • 89.
  • 90. Non-human numbers are identified and filtered.
  • 91. Service numbers are identified and filtered.
  • 92. Some links are trivial:
  • 93. Remove links that are infrequently called.
  • 94. Different filters can be applied for different metrics.Confidential - not for redistribution
  • 95. Data Preparation: Target Data Model Graph Theory concepts are the foundation of a good model for use in Social Network Analysis. Confidential - not for redistribution
  • 96.
  • 97. Social Network metrics describe nodes and edges, and attempt to give meaning to position.
  • 98. Metrics are typically calculated in-database.
  • 99. Metrics are created using scripts that use:
  • 100. SQL for simple metrics.
  • 101. UDFs for complex metrics.Confidential - not for redistribution
  • 102.
  • 103.
  • 110. Many more…Confidential - not for redistribution
  • 111. SN Metrics: Degree D1: Size of the degree 1 social circle. D2: Size of the degree 2 social circle. Confidential - not for redistribution Degree 1 Circle = 5 Degree 2 Circle = 7
  • 112.
  • 113.
  • 114. Similar to Google’s page rank.
  • 115. Bonacich Centrality measures the total number of paths starting from a node, with a decay factor favouring shorter paths over longer ones.
  • 116. C is vector of centralities
  • 117. A is graph matrix.
  • 118. Alpha is a scaling factor.
  • 119. Beta is decay factor between 0 and 1.
  • 120. C = alpha * SUM _ (k = 0 to infinity) Beta ^ k * A ^ (k + 1)
  • 121. If Beta = 0, this is degree count.
  • 122. If Beta = 1, this is eigenvalue centrality (page rank).Ideal for computation in parallel! Confidential - not for redistribution
  • 123. Examples of Bonacich Centrality(with decay factor of 0.5) Confidential - not for redistribution 0.64 0.64 1.12 1.12 11.28 0.76 0.76 1 1 1 0.76 0.76 1.77 1 1 1 0.76 0.73 1.30 0.73 1.30 1.46 0.73 0.73
  • 124. SN Metrics: Reciprocal Degree RD: Reciprocal Degree. - Communication in both directions. Confidential - not for redistribution Reciprocal Edge Reciprocal Degree = 2
  • 125. SN Metrics: In-Network Degree RDNetwork: Reciprocal Degree within the network. - Communication on-network in both directions. Confidential - not for redistribution Reciprocal Edge Network Reciprocal Degree within Network = 1
  • 126. SN Metrics: Triangles TRG: a count of the number of triangles within a social network involving a particular focus node. Degree of interconnectedness in the social network. Confidential - not for redistribution In this example, four triangles exist within the social network – three of which involve the focus node. Triangles = 3
  • 127. SN Metrics: Betweenness Betweenness: The number of node pairs that have only a direct link through the focus node. This is a simpler (faster) calculation than the more precise definition that involves an all node pair shortest path calculation. Betweenness is a measure of how essential the focus node is to facilitate communication within the social network. Confidential - not for redistribution Betweenness = 6 These subscribers do not.. These subscribers need the focus node to communicate with each other.
  • 128. SN Metrics: Density DEN: Density is the number of actual edges divided by the number of possible edges (n * ( n – 1 ) / 2) within a social network (simplified). How dense is the calling pattern within the calling circle? Low if many nodes in the calling circle are not connected. Usually low when calling circle is large. Inversely related to Betweenness. Confidential - not for redistribution Only three edges for a calling circle of five nodes. Density = 3/10
  • 129.
  • 130. Apply the inverse cascading model: Edges are modelled for the chance that a message or behaviour will be transmitted.
  • 131. Example types of models:
  • 132. Churn risk: how likely is churn spread from A to B?
  • 133. Product/service spread: if A uses product/service X, how likely is it to be taken up by B?
  • 134. Viral marketing: if we send A an offer, will they pass it to B?Confidential - not for redistribution
  • 135.
  • 136. He does not have product X.
  • 137. Has a non-trivial centrality score.
  • 139.
  • 140. He does not have product X.
  • 141. Has a non-trivial centrality score.
  • 143.
  • 144.
  • 145. The number and size of control groups will vary according to the effect being testing:
  • 146. Control group for direct take up.
  • 147. Control group for viral take up.
  • 148. Control groups for different messages.
  • 149. For example: to control for a X-sell message and model
  • 150. A group of high scoring customers should not be contacted ( control of message).
  • 151. A group of low scoring customers should be contacted (control of model).Confidential - not for redistribution
  • 152. Data Mining Using Social Network Analysis Confidential - not for redistribution
  • 153.
  • 158. Etc.
  • 159. SN Metrics along with traditional attributes are used to derive characteristics such as influence, but these should scored relative to specific topics (price, technology, churn, etc.)
  • 160. Analysis is often done in the context of specific domains…defining time horizon for the analysis, customer segments, types of call to consider, weekly vs weekend call patterns, filtering outliers calls, etc.Confidential - not for redistribution
  • 161. Social Network Analysis with Relationships Confidential - not for redistribution
  • 162.
  • 163. Householding, for example, is something that most sophisticated analytic organizations have been doing for years.
  • 164. Most common use cases:
  • 169. Householding is a very simple form of network analysis.Confidential - not for redistribution
  • 170.
  • 172.
  • 175. Derived ‘head of household’ variables.Used to construct new variables for the purpose of propensity scoring, risk scoring, segmentation, etc. Tracking of relationships over time to give visibility to life stage transitions. Confidential - not for redistribution
  • 176.
  • 182. Pressure.Confidential - not for redistribution
  • 183.
  • 184. Credit card accounts
  • 187. Frequent flyer accounts
  • 189. Many other possibilities…Confidential - not for redistribution
  • 190.
  • 191. Credit guarantor (co-signer) versus recipient on a loan or credit card.
  • 192. Custodian versus trustee on a financial account.
  • 193. Beneficiary versus owner on a life insurance policy.
  • 194. Insured versus payer on a driver’s insurance policy.
  • 195. Sponsor versus recipient for frequent flyer status.
  • 196. And so on…Confidential - not for redistribution
  • 197.
  • 202. Customer segmentation.Key concept: Derive new variables for analytic purposes based on characteristics and events related to a group of individuals (social network) rather than looking at individuals in isolation. Confidential - not for redistribution
  • 203. Marketing Analytics Use Cases Simple extension of model variables from an individual level to a household level gives significant uplift in predictive accuracy: Total customer value by product category Total number of accounts or purchases by product category Date of last account open or purchase by product category Date of first account open or purchase by product category Date of last account close or purchase by product category Date of first account close or purchase by product category Date of last inquiry Date of first inquiry Total number of inquiries in the last three months Total number of inquiries over customer lifetime Date of last complaint. Date of first complaint Total number of complaints in last three months Total number of complaints over customer lifetime Etc.. Confidential - not for redistribution
  • 204. Customer Retention by Identifying At-Risk for Defection Relationships Individual defection impacts household defection: When one individual closes all accounts or has a bad experience, all individuals in the household may be put at risk. Retention programs identifying these situations can be put into place to ‘save’ at-risk for defection customers. Broker defection impacts customer defection: If the broker for a customer of a financial or insurance company takes a job with the competition, the customer is likely to be highly at-risk for defection. Again, explicit retention programs can be used to ‘save’ these customers. Important note: roles in the relationships matter. Confidential - not for redistribution
  • 205.
  • 206. Scoring for commercial loans/collections based on supplier and/or customer relationships with insight related to industry or customer concentration as a measure of risk.Confidential - not for redistribution
  • 207.
  • 209. Terrorist networks.Confidential - not for redistribution
  • 210.
  • 211. Example of social network analysis.Confidential - not for redistribution
  • 212.
  • 213. Prioritizing vaccines and health education.Confidential - not for redistribution
  • 214. Confidential - not for redistribution Social Network Analysis with Transactions
  • 215.
  • 216. Messages (SMS, MMS, etc.)
  • 220. Physician referrals.Cardinality of transactions can be used to indicate intensity of the relationship. Confidential - not for redistribution
  • 221.
  • 226. How ‘connected’ is the employee to the company?
  • 227. If one employee leaves, what is the risk of defection for adjacent nodes in that employees social network.Combine SN Metrics with traditional metrics (salary, years of service, performance evaluations, commute distance, etc.) to build predictive models. Confidential - not for redistribution
  • 228.
  • 229. Messages (SMS, MMS, etc,.)
  • 233. What is the level (intensity) of communication between departments that should be cooperating?
  • 234. What is the richness’ and ‘diversity’ of the communications between departments?
  • 235. Always email with no face-to-face meetings or telephone conversations may indicate a problem.
  • 236. Are there a small number of connectors between the departments?
  • 237. At what level are they within the organization?Confidential - not for redistribution
  • 238. Social Network Analysis (SNA)in Telecommunications Social Network Analysis (SNA) is focused on the relations between subscribers (customers); traditional propensity or segmentation models are based on individual subscriber attributes. Map of ties among subscribers provide a useful framework to identify role played by each individual within the network. Ties between two subscribers can be identified using voice, calls, sms, mms, etc. SNA is often used to: Define targeted treatments based on network roles of an individual to encourage/discourage specific events (churn, acquisition, product adoption). Monitor new product adoption by studying diffusion within a social network. Identify unusual behaviours (fraud detection). Confidential - not for redistribution
  • 239.
  • 240. There are many communication channels/mediums; call data captures just a portion of communication among people.
  • 241. Data availability is quite good for mobile network operators who capture CDR dtaa – more data leads to better results.Confidential - not for redistribution
  • 242. Application of Social Network Analysis Critical success factors for effective social network analysis: Need a critical mass of mobile phone penetration within the country. Market share matters: New versus established operators. The flower pattern. Data collection: Need detailed and cleaned history data. Understand the profile of your customers segments (consumer, small business, corporate, pre-paid, post-paid, etc.) Confidential - not for redistribution
  • 243.
  • 244. Identify key parameters of measured call data (normalization, skew elimination).
  • 245. Separate random connections and weak connections.
  • 246. Understand the size and density of the social network.
  • 247. Understand the dynamics in the social network: stable versus volatile communities.
  • 248. Target selection, test/control groups, and measurement.
  • 249. Read correctly and understand the results of the Social Network Analysis.Confidential - not for redistribution
  • 250.
  • 251. Voice Network (Individual A calls Individual B on voice)
  • 252. SMS Network (Individual A sends a SMS to Individual B)
  • 253. MMS Network *Individual A sends a MMS to Individual B)
  • 254. All services Network (Individual A calls or sends SMS or MMS to B)
  • 256. At least 5 communications; duration at least 15 seconds.
  • 258. Interactions during this month, or week, or day…
  • 259. Directed or Un-directedUsing different definitions to calculate links gives different networks for different purposes.
  • 260. Network Structure Weak ties: Connection between communities; connection to the rest of the ‘World’. Strong ties: Communication ties with high call frequency and/or high call duration. Importance of ties from the perspective of: Information diffusion.. Networrk integrity. Kind of tie (driend, intimate, parent/child). Confidential - not for redistribution
  • 261.
  • 263. First Circle Statistics: counts, averages, proportions. Separate counts for nominal variables (gender, brand).
  • 264. Counts and ratios for neighbours on-network and off-network.
  • 265. Sums for link labels (total minutes between phones).
  • 266. Statistics for the community of a user (more than first circle).Confidential - not for redistribution
  • 267. Confidential - not for redistribution Conclusions
  • 268.
  • 269. Need to think differently about test and control groups.
  • 270. Viral marketing opportunities.Confidential - not for redistribution
  • 271. Conclusions on Social Network Analysis The success of marketing with techniques based on Social Network Analysis will depend on many factors: Success rates will be different in different cultures and demographic groups. What works in Europe will be different from what works in Asia or the United States. The answers are in your data! For marketing activities to have a viral component there has to be value to both the A and B nodes: Value can be in terms of prestige (true viral marketing) or can be financial. Most marketing messages have no viral component. Any viral marketing must have a fulfilment method to match. Product and offer characteristics can have a dramatic impact on effectiveness of program targeting. Confidential - not for redistribution
  • 272.
  • 273. Don’t under estimate the amount of work and time required to cleanse and understand the data.
  • 274. Want to combine event data with SN data to maximize impact.
  • 275.
  • 277. Lots of market confusion between social network analysis and social media analysis.
  • 278. Want to track how networks change over time.
  • 279. Measure, learn and improve.Confidential - not for redistribution
  • 280. Contact PEAK for more information You can reach me directly at WAEL@PEAKCONSULTING.EU or by calling one of our offices below. United StatesTel: +1 (212) 946 4824Fax: +1 (212) 946 280111 Penn Plaza, 5th floorNew York, NY 10001 Confidential - not for redistribution United KingdomTel: +44 (0)20 7849 3422Fax: +44 (0)20 7990 947890 Long Acre, Covent GardenLondon, WC2E 9RZ IndiaOffice 232, 2nd FloorKuber Complex, Opp. Laxmi Industrial EstatesAndheri Link Road, Andheri (W)Mumbai, Maharashtra, 400053 United Arab EmiratesUnit P12 Rimal, The WalkPO Box 487 177Dubai www.peakconsulting.eu
  • 281. Recommended Reading Gladwell, M. The Tipping Point. Little Brown, and Company. 2002. Green, H. The Rise of Niche Social Networks and that Money Question. Business Week. On-line Blog. March 15, 2007. Finkeldey, D. and V. Liu. User Survey Analysis: U.S. Social-Media Adoption Across Industries. Gartner Research Presentation. 2009. Pandit, S., D. Chau, S. Wang, and C. Faloutsos. NetProbe: A Fast and Scalable System for Fraud Detection in Online Auction Networks. Proceedings of WWW 2007. 2007. pp. 201-210. Confidential - not for redistribution