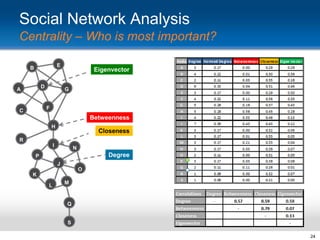
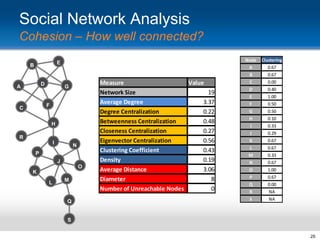
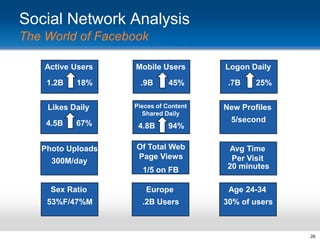
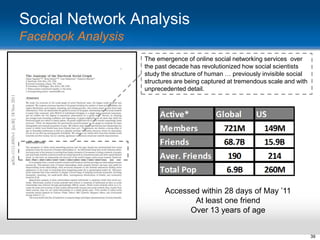
Mining and Analyzing
Social Media: Part 2
Dave King
HICSS 47 - January 2014
Agenda: Part 2

• Introduction to Social Network
Analysis Metrics
– Degrees of Separation
– Hooray for Bollywood

• Standard Measures
– Centrality
– Cohesion

• Levels of Social Network Analysis
– Facebook & Egocentric Analysis
– Searching for Cohesive Subgroups

2
Social Network Analysis
Analyzing Social Networks – The World of Metrics
Social scientists, physicists, computer
scientists, and mathematicians have
collaborated to create theories and

algorithms for calculating
novel measurements of social
networks and the people and
things that populate them.
These quantitative network metrics allow
analysts to systematically dissect the
social world, creating a basis on

which to compare networks,
track changes in a network
over time, and determine the
relative position of individuals
and clusters within a network.

3
Social Network Analysis
Wide Variety of Metrics Available

4
Social Network Analysis
Best Known Social Metric

5
Social Network Analysis
6 Degrees of Separation
A fascinating game grew out of this discussion. One of us
suggested performing the following experiment to prove that the
population of the Earth is closer together now than they have ever
been before. We should select any person from the 1.5 billion
inhabitants of the Earth—anyone, anywhere at all. He bet us that,
using no more than five individuals, one of whom is a personal
acquaintance, he could contact the selected individual using
nothing except the network of personal acquaintances.
Frigyes Karinthy , Chains, 1929

P1

I1

I2

I3

I4

I5

P2

Degrees of separation ~ Average Path Length ~ Distance
6
Social Network Analysis
Why the notoriety?
Frigyes Karinthy
1929

John Guare
1990

Stanley Milgram
1967

Duncan Watts
1998

Six Degrees of Kevin Bacon (1994)
7
Social Networks
The Oracle of Bacon

8
Social Network Analysis
Oracle of Bacon gone mainstream

9
Social Network Analysis
How the Oracle of Bacon Works

10
Social Network Analysis
Center of the Hollywood Universe

11
Social Network Analysis
of Bachchan

Aishwarya Rai
Bachchan

Amitabh Bachchan

Abhishek Bachchan
Social Network Analysis
There’s a new game in town

13
Social Network Analysis
The Center of Bollywood

Wikipedia Web Page

Relational DB – 627 Movies – 1061 Actors
(2010-2013)

HTML- Page Source

Pajek .NET File
14
Social Network Analysis
Bipartite Network – Movies and Actors

Pajek .NET File
15
Social Network Analysis
Analyzing Bollywood

16
Social Networks
Rules of Networks

• RULE 1: WE SHAPE OUR NETWORK
• RULE 2: OUR NETWORK SHAPES
US
• RULE 3: OUR FRIENDS AFFECT US
• RULE 4: OUR FRIENDS‟ FRIENDS‟
FRIENDS AFFECT US
• RULE 5: THE NETWORK HAS A LIFE
OF ITS OWN

17
Social Network Analysis
Bifurcated Methodology

Local
Measures

Global
Measures

18
Social Network Analysis
Walks and Paths
• Two points may be directly
connected or indirectly
connected thru a sequence of
lines called a walk.

• If points and lines are distinct it‟s
a path.
• The length of a path is the
number of edges (or lines) that
make it up.

• The shortest length is called the
distance or geodesic.

Undirected

Sample Walks
((C,A),(A,D))
((C,A),(A,B),(B,D))
((C,A),(A,D),(D,A),(A,D))

A
B

Sample Paths
((C,A),(A,D))
((C,A),(A,B),(B,D))

C
D
Directed

Sample Walks
((C,A),(A,D))
((C,A),(A,B),(B,D))

A

B

Sample Paths
((C,A),(A,D))
((C,A),(A,B),(B,D))

C

D
19
Social Network Analysis
Centrality – Who is most influential?
Measure
Degree

Definition
Number of edges or links. In
degree- links in, Out-degree - links
out

Interpretation
How connected is a node? How
many people can this person reach
directly?

Reasoning
Higher probability of receiving and transmitting
information flows in the network. Nodes considered
to have influence over larger number of nodes and or
are capable of communicating quickly with the nodes
in their neighborhood.

Betweenness

Number of times node or vertex
lies on shortest path between 2
nodes divided by number of all
the shortest paths

Degree to which node controls flow of information in
the network. Those with high betweenness function
as brokers. Useful where a network is vulnerable.

Closeness

1 over the average distance
between a node and every other
node in the network

How important is a node in terms
of connecting other nodes? How
likely is this person to be the most
direct route between two people
in the network?
How easily can a node reach other
nodes? How fast can this person
reach everyone in the network?

Eigenvector

Proporational to the sum of the
eigenvector centralities of all the
nodes directly connected to it.

Measure of reach. Importance based on how close a
node is located with respect to every other node in the
network. Nodes able to reach most or be reached by
most all other nodes in the network through geodesic
paths.
How important, central, or
Evaluates a player's popularity. Identifies centers of
influential are a node’s neighbors? large cliques. Node with more connections to higher
How well is this person connected scoring nodes is more important.
to other well-connected people?

20
Social Network Analysis
Cohesion – How well connected?
Cohesion

Definition

Interpretation

Reasoning

Density

Ratio of the number of edges in the
network over the total number of
possible edges between all pairs of
nodes

How well connected is the overall
network?

Perfectly connected network is called a "clique" and has a
density of 1.

Clustering

A node's clustering coefficient is the
density of it's 1.5 degree egocentric
network (ratio of connecting among
ego's alters). For entire network it is
the average of all the coefficients for
the individual nodes.

What proportion of ego's alters are
connected? More technically, how
many nodes form triangular
subgraphs with their adjacent
nodes?

Measures certain aspects of "cliquishness." Proportion of
you friends that are also friends with each other.
Another way to measure is to determine (in a undirected)
graph the ratio of the number of times that two links
eminating from the same node are also linked.

Average Path Length Average number of edges or links
(Distance)
between any two nodes (along the
shortest path)

On average, how far apart are any
two nodes?

This is synonymous with the "degrees of separation" in a
network.

Diameter

Longest (shortest path) between
any two nodes

At most, how long will it take to
reach any node in the network?
Sparse networks usually have
greater diameters.

Measure of the reach of the network

Centralization

Normalize ratio of the sum of the
Indicates how unequal the
variances of the centrality of each
distribution of centrality is in a
node from the most central node to network.
the maximum sum possible

Measures how much variance there is in the distribution
of centrality in a network. The measure applies to all
forms of centrality.

21
Social Network Analysis
Generic Example for
E

B

D

A

• For each of the nodes what
is it‟s

G

–
–
–
–

F

C

H
R
I

N

P
J
O
K
L

M

Q

S

Degree Centrality
Betweenness Centrality
Closeness Centrality
Eigenvector Centrality

• For the entire network what
is it‟s
–
–
–
–

Degree Centralization
Betweenness Centralization
Closeness Centralization
Eigenvector Centralization
22
Social Network Analysis
Visualizing and Analyzing with ORA

23
Social Network Analysis
Centrality – Who is most important?
E

B

D

A

Eigenvector
G

F

C

Betweenness
H

Closeness

R
I

N

Degree

P
J
O
K
L

M

Q

S
24
Social Network Analysis
Cohesion – How well connected?
E

B

D

A

G

F

C

H
R
I

N

P
J

O
K
L

M

Q

Measure
Value
Network Size
19
Average Degree
3.37
Degree Centralization
0.22
Betweenness Centralization
0.48
Closeness Centralization
0.27
Eigenvector Centralization
0.56
Clustering Coefficient
0.43
Density
0.19
Average Distance
3.06
Diameter
8
Number of Unreachable Nodes
0

Node
A
B
C
D
E
F
G
H
I
J
K
L
M
N
O
P
Q
R
S

Clustering
0.67
0.67
0.00
0.40
1.00
0.50
0.50
0.10
0.33
0.29
0.67
0.67
0.33
0.67
1.00
0.67
0.00
NA
NA

S
25
Social Network Analysis
The World of Facebook
Active Users
1.2B

18%

Likes Daily

4.5B

67%

Photo Uploads

Mobile Users
.9B

45%

Pieces of Content
Shared Daily

4.8B

94%

Of Total Web
Page Views

Logon Daily
.7B

25%

New Profiles
5/second

1/5 on FB

Avg Time
Per Visit
20 minutes

Sex Ratio

Europe

Age 24-34

53%F/47%M

.2B Users

30% of users

300M/day

26
Social Network Analysis
Facebook in the World

facebookstories.com/stories/1574/
#color=language-official&story=1&country=SA
27
Social Network Analysis
Your World of Facebook

app.thefacesoffacebook.com

apps.facebook.com/challenger_meurs/
?fb_source=appcenter&fb_appcenter=1

Geographical.cz/socialMap/

apps.facebook.com/touchgraph/
28
Social Network Analysis
Egocentric Network – Facebook Example

29
Social Network Analysis
Egocentric Network – Facebook Example

30
Social Network Analysis
Egocentric Network – Facebook Example
Netvizz v0.93

.gdf (GUESS) file format

One simple way to generate SNA data from Facebook
31
Social Network
Egocentric Network – Facebook Example
Cleansed-Augmented Guess .GDF File used for analysis

guess.wikispot.org/The_GUESS_.gdf_format
32
Social Network Analysis
Egocentric Networks – by Degree

1.5

1.0

2.0
Ego
(Ego‟s) Alter
Alter‟s Alter

33
Social Network Analysis
Egocentric Network – Facebook Example

34
Social Network Analysis
Egocentric Network – Facebook Example

Getting Started With The Gephi
Network Visualisation App
– My Facebook Network, Part I
blog.ouseful.info/2010/04/16
/getting-started-with-gephi-networkvisualisation-app-myfacebook-network-part-i/

35
Social Network Analysis
Egocentric Network – Facebook Example
Matrix Representation

Graph Representation

PL = N(N-1)/2 = 3081 Ego Density = L/PL = 312/3081 =.10

36
Social Network Analysis
Egocentric Network – Facebook Example
(Avg 7.9)

(Avg 32.0)

(Avg .26)

(Avg 2.7)

(Avg 7.9)

(Avg .66)

37
Social Network Analysis
Another Analytical Alternative - NodeXL

38
Social Network Analysis
Facebook Analysis
The emergence of online social networking services over
the past decade has revolutionized how social scientists
study the structure of human … previously invisible social
structures are being captured at tremendous scale and with
unprecedented detail.

Accessed within 28 days of May ‟11
At least one friend
Over 13 years of age

39
Social Network Analysis
•

Nearly fully connected, with 99.91% of
individuals belonging to a single large
connected component

•

Confirm „six degrees of separation‟
phenomenon on a global scale. Second, by
studying

•

While the Facebook graph as a whole is
clearly sparse, the graph neighborhoods of
users contain surprisingly dense

•

Clear degree assortativity.

•

Strong impact of age on friendship
preferences as well as a globally modular
community structure driven by nationality, but
no gender homophily.

40
Social Network Analysis
Facebook Analysis

14% for 100

Assortativity

P(F|F) = .52
P(F|M) = .51

41
Social Network Analysis
Facebook Analysis
Average
4.7

Average
4.3

World 92% 99.6%
US
96% 99.7%

42
Social Network Analysis
Looking for Cohesive Subgroups

43
Sociology
Cohesive Subgroups

Many individuals have large clusters of friends corresponding to well-defined
foci of interaction in their lives, such as their cluster of co-workers or the cluster
of people with whom they attended college. Since many people within these
clusters know each other, the clusters contain links of very high
embeddedness, even though they do not necessarily correspond to particularly
strong ties.
44
Social Network Analysis
Cohesive Subgroups
E

B

D

A

•
•

G

In a complete graph all the nodes are adjacent to
one another
A network is connected if every two nodes in the
network are connected by some path in the network

F

C

–
H

R
I

N

•

A graph G has components G1 and G2 if no
(undirected) path exists between any node in G1 to
any node of G2 (component is an isolated
subgraph)

•

P

A link is a bridge in a network if it‟s removal
increases the number of components in the network

J

O
K
L

A directed graph is strongly connected if and only if for
every pair of vertices x , y, there is a directed path from x to y
and a directed path from y to x between them. It is weakly
connected if there is at least an undirected path for every
pair of vertices.

M

Q

S
45
Social Network Analysis
Cohesive Subgroups
E

B

D

A

• A clique is a maximal complete subnetwork
containing three vertices or more.
G

• n-clique is a maximal subnetwork in which
the maximum path length for connection is
“n” (e.g. 2-clique has nodes connected by
paths of 1 or 2 lengths).

F

C

H
R
I

N

P
J

O
K
L

M

Q

• A k-core is a maximal subnetwork in which
each vertex has at least degree k within the
subnetwork (e.g. 3-core)

• Girvan-Newman Algorithm breaks
complex networks into “communities” by
removing edges (betweenness) resulting in
fragmentation

S
46
Social Network Analysis

47
Social Network Analysis
It’s a Small World after all, or is it?

6.0 vs. 4.7
48

Mining and analyzing social media part 2 - hicss47 tutorial - dave king

  • 1.
    Mining and Analyzing SocialMedia: Part 2 Dave King HICSS 47 - January 2014
  • 2.
    Agenda: Part 2 •Introduction to Social Network Analysis Metrics – Degrees of Separation – Hooray for Bollywood • Standard Measures – Centrality – Cohesion • Levels of Social Network Analysis – Facebook & Egocentric Analysis – Searching for Cohesive Subgroups 2
  • 3.
    Social Network Analysis AnalyzingSocial Networks – The World of Metrics Social scientists, physicists, computer scientists, and mathematicians have collaborated to create theories and algorithms for calculating novel measurements of social networks and the people and things that populate them. These quantitative network metrics allow analysts to systematically dissect the social world, creating a basis on which to compare networks, track changes in a network over time, and determine the relative position of individuals and clusters within a network. 3
  • 4.
    Social Network Analysis WideVariety of Metrics Available 4
  • 5.
    Social Network Analysis BestKnown Social Metric 5
  • 6.
    Social Network Analysis 6Degrees of Separation A fascinating game grew out of this discussion. One of us suggested performing the following experiment to prove that the population of the Earth is closer together now than they have ever been before. We should select any person from the 1.5 billion inhabitants of the Earth—anyone, anywhere at all. He bet us that, using no more than five individuals, one of whom is a personal acquaintance, he could contact the selected individual using nothing except the network of personal acquaintances. Frigyes Karinthy , Chains, 1929 P1 I1 I2 I3 I4 I5 P2 Degrees of separation ~ Average Path Length ~ Distance 6
  • 7.
    Social Network Analysis Whythe notoriety? Frigyes Karinthy 1929 John Guare 1990 Stanley Milgram 1967 Duncan Watts 1998 Six Degrees of Kevin Bacon (1994) 7
  • 8.
  • 9.
    Social Network Analysis Oracleof Bacon gone mainstream 9
  • 10.
    Social Network Analysis Howthe Oracle of Bacon Works 10
  • 11.
    Social Network Analysis Centerof the Hollywood Universe 11
  • 12.
    Social Network Analysis ofBachchan Aishwarya Rai Bachchan Amitabh Bachchan Abhishek Bachchan
  • 13.
    Social Network Analysis There’sa new game in town 13
  • 14.
    Social Network Analysis TheCenter of Bollywood Wikipedia Web Page Relational DB – 627 Movies – 1061 Actors (2010-2013) HTML- Page Source Pajek .NET File 14
  • 15.
    Social Network Analysis BipartiteNetwork – Movies and Actors Pajek .NET File 15
  • 16.
  • 17.
    Social Networks Rules ofNetworks • RULE 1: WE SHAPE OUR NETWORK • RULE 2: OUR NETWORK SHAPES US • RULE 3: OUR FRIENDS AFFECT US • RULE 4: OUR FRIENDS‟ FRIENDS‟ FRIENDS AFFECT US • RULE 5: THE NETWORK HAS A LIFE OF ITS OWN 17
  • 18.
    Social Network Analysis BifurcatedMethodology Local Measures Global Measures 18
  • 19.
    Social Network Analysis Walksand Paths • Two points may be directly connected or indirectly connected thru a sequence of lines called a walk. • If points and lines are distinct it‟s a path. • The length of a path is the number of edges (or lines) that make it up. • The shortest length is called the distance or geodesic. Undirected Sample Walks ((C,A),(A,D)) ((C,A),(A,B),(B,D)) ((C,A),(A,D),(D,A),(A,D)) A B Sample Paths ((C,A),(A,D)) ((C,A),(A,B),(B,D)) C D Directed Sample Walks ((C,A),(A,D)) ((C,A),(A,B),(B,D)) A B Sample Paths ((C,A),(A,D)) ((C,A),(A,B),(B,D)) C D 19
  • 20.
    Social Network Analysis Centrality– Who is most influential? Measure Degree Definition Number of edges or links. In degree- links in, Out-degree - links out Interpretation How connected is a node? How many people can this person reach directly? Reasoning Higher probability of receiving and transmitting information flows in the network. Nodes considered to have influence over larger number of nodes and or are capable of communicating quickly with the nodes in their neighborhood. Betweenness Number of times node or vertex lies on shortest path between 2 nodes divided by number of all the shortest paths Degree to which node controls flow of information in the network. Those with high betweenness function as brokers. Useful where a network is vulnerable. Closeness 1 over the average distance between a node and every other node in the network How important is a node in terms of connecting other nodes? How likely is this person to be the most direct route between two people in the network? How easily can a node reach other nodes? How fast can this person reach everyone in the network? Eigenvector Proporational to the sum of the eigenvector centralities of all the nodes directly connected to it. Measure of reach. Importance based on how close a node is located with respect to every other node in the network. Nodes able to reach most or be reached by most all other nodes in the network through geodesic paths. How important, central, or Evaluates a player's popularity. Identifies centers of influential are a node’s neighbors? large cliques. Node with more connections to higher How well is this person connected scoring nodes is more important. to other well-connected people? 20
  • 21.
    Social Network Analysis Cohesion– How well connected? Cohesion Definition Interpretation Reasoning Density Ratio of the number of edges in the network over the total number of possible edges between all pairs of nodes How well connected is the overall network? Perfectly connected network is called a "clique" and has a density of 1. Clustering A node's clustering coefficient is the density of it's 1.5 degree egocentric network (ratio of connecting among ego's alters). For entire network it is the average of all the coefficients for the individual nodes. What proportion of ego's alters are connected? More technically, how many nodes form triangular subgraphs with their adjacent nodes? Measures certain aspects of "cliquishness." Proportion of you friends that are also friends with each other. Another way to measure is to determine (in a undirected) graph the ratio of the number of times that two links eminating from the same node are also linked. Average Path Length Average number of edges or links (Distance) between any two nodes (along the shortest path) On average, how far apart are any two nodes? This is synonymous with the "degrees of separation" in a network. Diameter Longest (shortest path) between any two nodes At most, how long will it take to reach any node in the network? Sparse networks usually have greater diameters. Measure of the reach of the network Centralization Normalize ratio of the sum of the Indicates how unequal the variances of the centrality of each distribution of centrality is in a node from the most central node to network. the maximum sum possible Measures how much variance there is in the distribution of centrality in a network. The measure applies to all forms of centrality. 21
  • 22.
    Social Network Analysis GenericExample for E B D A • For each of the nodes what is it‟s G – – – – F C H R I N P J O K L M Q S Degree Centrality Betweenness Centrality Closeness Centrality Eigenvector Centrality • For the entire network what is it‟s – – – – Degree Centralization Betweenness Centralization Closeness Centralization Eigenvector Centralization 22
  • 23.
    Social Network Analysis Visualizingand Analyzing with ORA 23
  • 24.
    Social Network Analysis Centrality– Who is most important? E B D A Eigenvector G F C Betweenness H Closeness R I N Degree P J O K L M Q S 24
  • 25.
    Social Network Analysis Cohesion– How well connected? E B D A G F C H R I N P J O K L M Q Measure Value Network Size 19 Average Degree 3.37 Degree Centralization 0.22 Betweenness Centralization 0.48 Closeness Centralization 0.27 Eigenvector Centralization 0.56 Clustering Coefficient 0.43 Density 0.19 Average Distance 3.06 Diameter 8 Number of Unreachable Nodes 0 Node A B C D E F G H I J K L M N O P Q R S Clustering 0.67 0.67 0.00 0.40 1.00 0.50 0.50 0.10 0.33 0.29 0.67 0.67 0.33 0.67 1.00 0.67 0.00 NA NA S 25
  • 26.
    Social Network Analysis TheWorld of Facebook Active Users 1.2B 18% Likes Daily 4.5B 67% Photo Uploads Mobile Users .9B 45% Pieces of Content Shared Daily 4.8B 94% Of Total Web Page Views Logon Daily .7B 25% New Profiles 5/second 1/5 on FB Avg Time Per Visit 20 minutes Sex Ratio Europe Age 24-34 53%F/47%M .2B Users 30% of users 300M/day 26
  • 27.
    Social Network Analysis Facebookin the World facebookstories.com/stories/1574/ #color=language-official&story=1&country=SA 27
  • 28.
    Social Network Analysis YourWorld of Facebook app.thefacesoffacebook.com apps.facebook.com/challenger_meurs/ ?fb_source=appcenter&fb_appcenter=1 Geographical.cz/socialMap/ apps.facebook.com/touchgraph/ 28
  • 29.
    Social Network Analysis EgocentricNetwork – Facebook Example 29
  • 30.
    Social Network Analysis EgocentricNetwork – Facebook Example 30
  • 31.
    Social Network Analysis EgocentricNetwork – Facebook Example Netvizz v0.93 .gdf (GUESS) file format One simple way to generate SNA data from Facebook 31
  • 32.
    Social Network Egocentric Network– Facebook Example Cleansed-Augmented Guess .GDF File used for analysis guess.wikispot.org/The_GUESS_.gdf_format 32
  • 33.
    Social Network Analysis EgocentricNetworks – by Degree 1.5 1.0 2.0 Ego (Ego‟s) Alter Alter‟s Alter 33
  • 34.
    Social Network Analysis EgocentricNetwork – Facebook Example 34
  • 35.
    Social Network Analysis EgocentricNetwork – Facebook Example Getting Started With The Gephi Network Visualisation App – My Facebook Network, Part I blog.ouseful.info/2010/04/16 /getting-started-with-gephi-networkvisualisation-app-myfacebook-network-part-i/ 35
  • 36.
    Social Network Analysis EgocentricNetwork – Facebook Example Matrix Representation Graph Representation PL = N(N-1)/2 = 3081 Ego Density = L/PL = 312/3081 =.10 36
  • 37.
    Social Network Analysis EgocentricNetwork – Facebook Example (Avg 7.9) (Avg 32.0) (Avg .26) (Avg 2.7) (Avg 7.9) (Avg .66) 37
  • 38.
    Social Network Analysis AnotherAnalytical Alternative - NodeXL 38
  • 39.
    Social Network Analysis FacebookAnalysis The emergence of online social networking services over the past decade has revolutionized how social scientists study the structure of human … previously invisible social structures are being captured at tremendous scale and with unprecedented detail. Accessed within 28 days of May ‟11 At least one friend Over 13 years of age 39
  • 40.
    Social Network Analysis • Nearlyfully connected, with 99.91% of individuals belonging to a single large connected component • Confirm „six degrees of separation‟ phenomenon on a global scale. Second, by studying • While the Facebook graph as a whole is clearly sparse, the graph neighborhoods of users contain surprisingly dense • Clear degree assortativity. • Strong impact of age on friendship preferences as well as a globally modular community structure driven by nationality, but no gender homophily. 40
  • 41.
    Social Network Analysis FacebookAnalysis 14% for 100 Assortativity P(F|F) = .52 P(F|M) = .51 41
  • 42.
    Social Network Analysis FacebookAnalysis Average 4.7 Average 4.3 World 92% 99.6% US 96% 99.7% 42
  • 43.
    Social Network Analysis Lookingfor Cohesive Subgroups 43
  • 44.
    Sociology Cohesive Subgroups Many individualshave large clusters of friends corresponding to well-defined foci of interaction in their lives, such as their cluster of co-workers or the cluster of people with whom they attended college. Since many people within these clusters know each other, the clusters contain links of very high embeddedness, even though they do not necessarily correspond to particularly strong ties. 44
  • 45.
    Social Network Analysis CohesiveSubgroups E B D A • • G In a complete graph all the nodes are adjacent to one another A network is connected if every two nodes in the network are connected by some path in the network F C – H R I N • A graph G has components G1 and G2 if no (undirected) path exists between any node in G1 to any node of G2 (component is an isolated subgraph) • P A link is a bridge in a network if it‟s removal increases the number of components in the network J O K L A directed graph is strongly connected if and only if for every pair of vertices x , y, there is a directed path from x to y and a directed path from y to x between them. It is weakly connected if there is at least an undirected path for every pair of vertices. M Q S 45
  • 46.
    Social Network Analysis CohesiveSubgroups E B D A • A clique is a maximal complete subnetwork containing three vertices or more. G • n-clique is a maximal subnetwork in which the maximum path length for connection is “n” (e.g. 2-clique has nodes connected by paths of 1 or 2 lengths). F C H R I N P J O K L M Q • A k-core is a maximal subnetwork in which each vertex has at least degree k within the subnetwork (e.g. 3-core) • Girvan-Newman Algorithm breaks complex networks into “communities” by removing edges (betweenness) resulting in fragmentation S 46
  • 47.
  • 48.
    Social Network Analysis It’sa Small World after all, or is it? 6.0 vs. 4.7 48