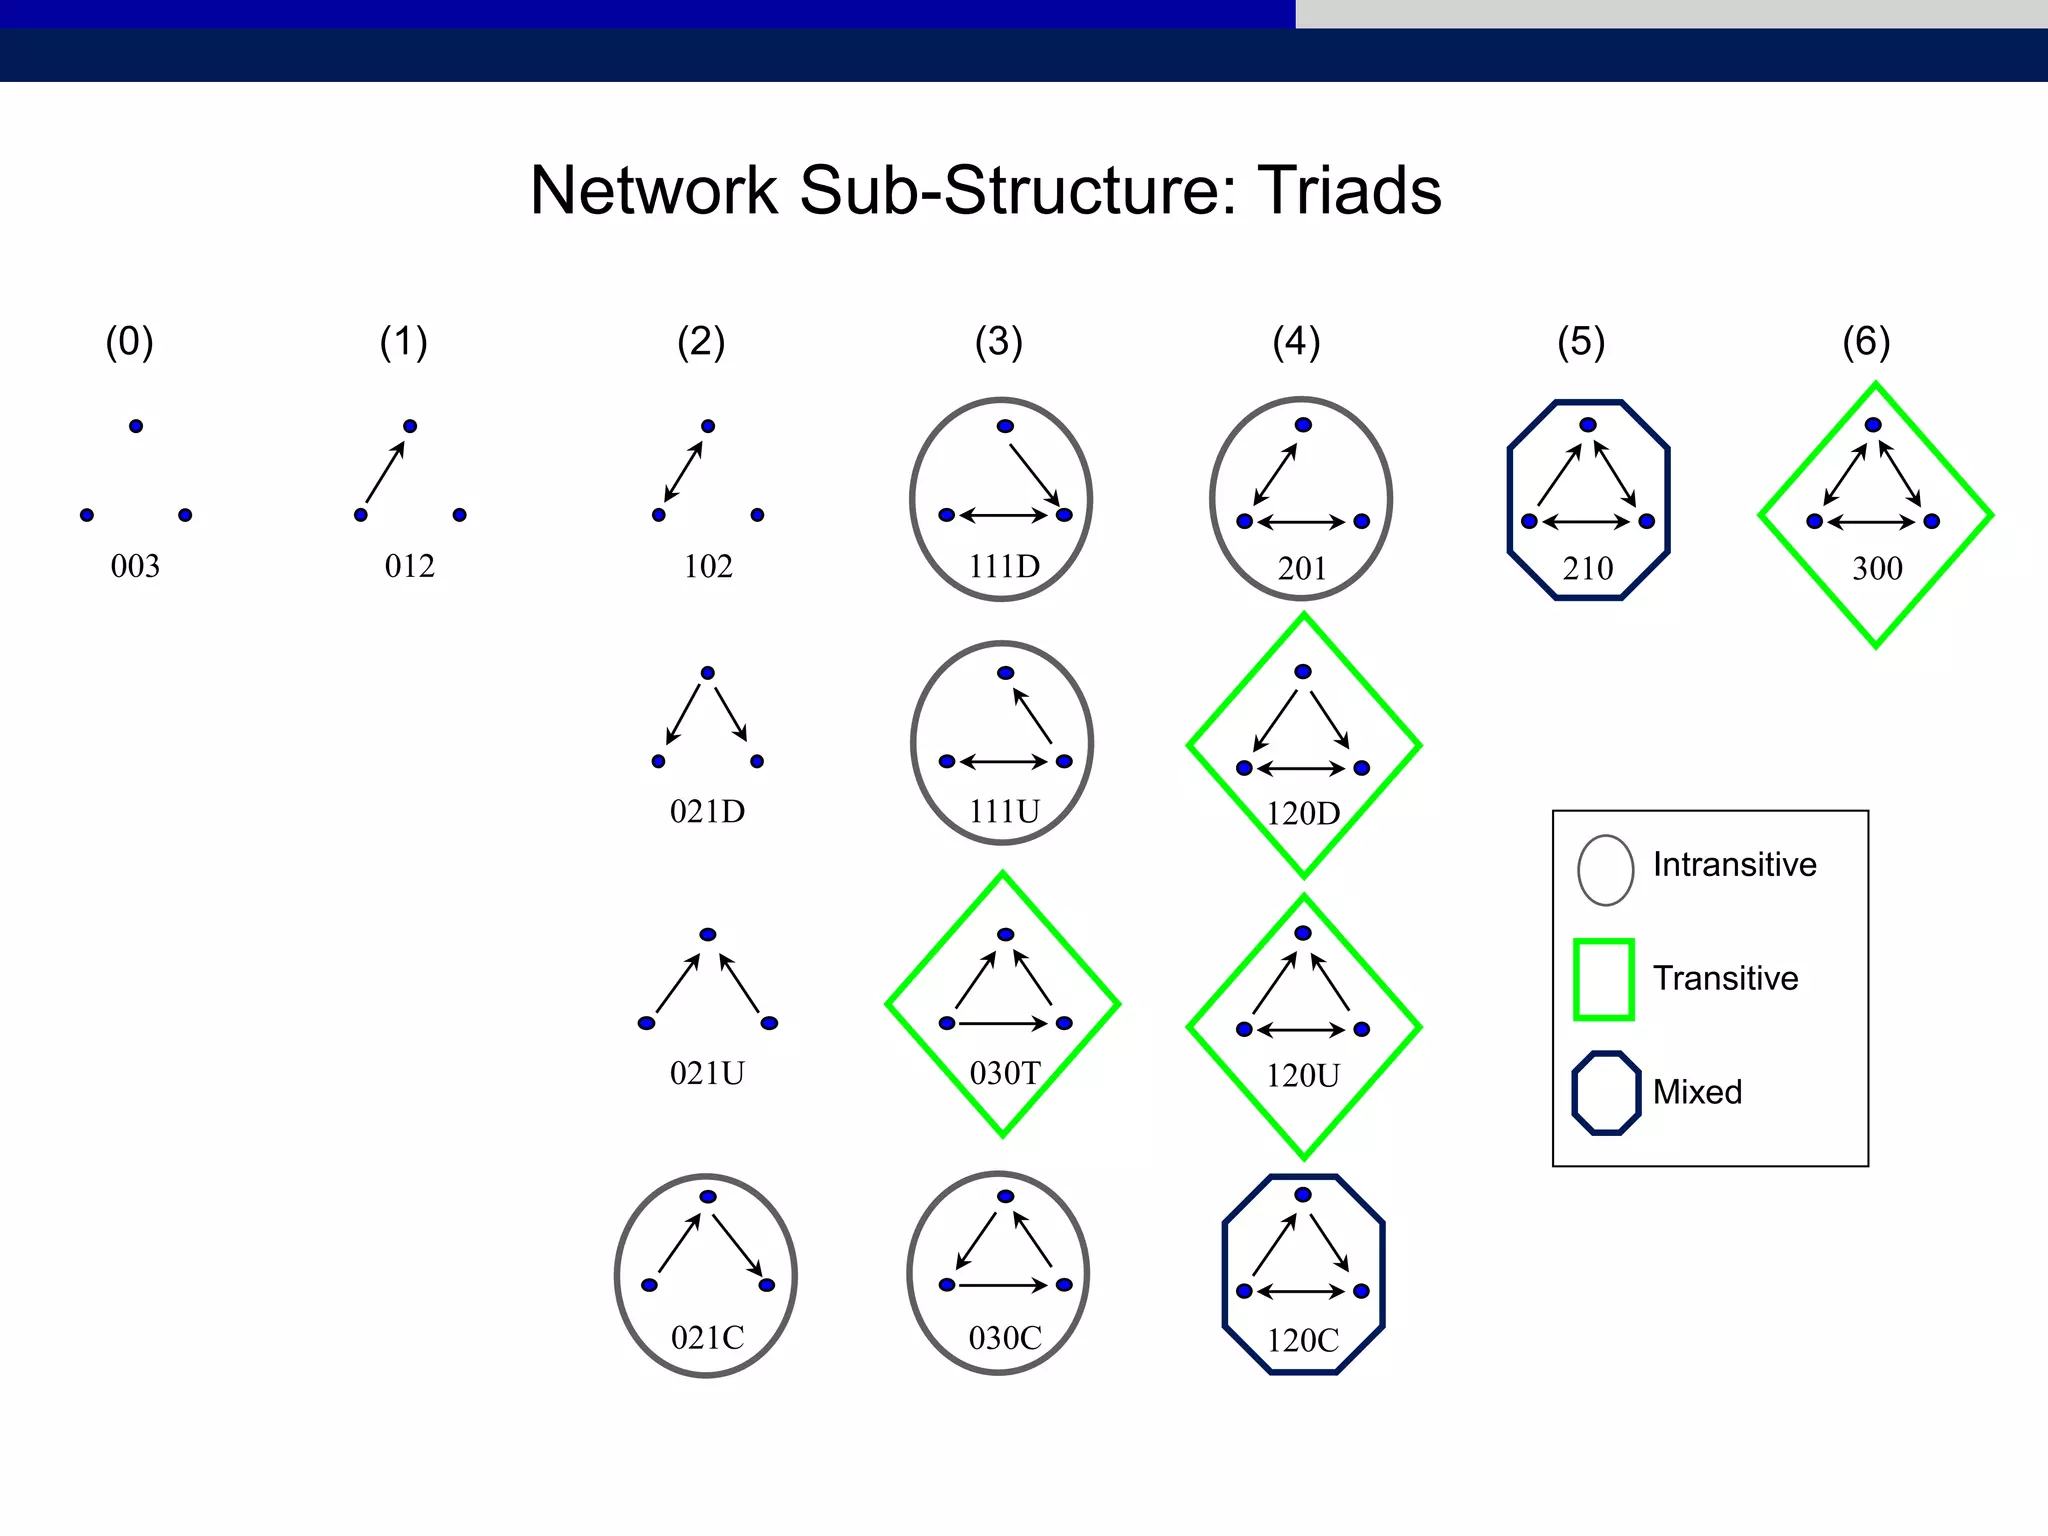
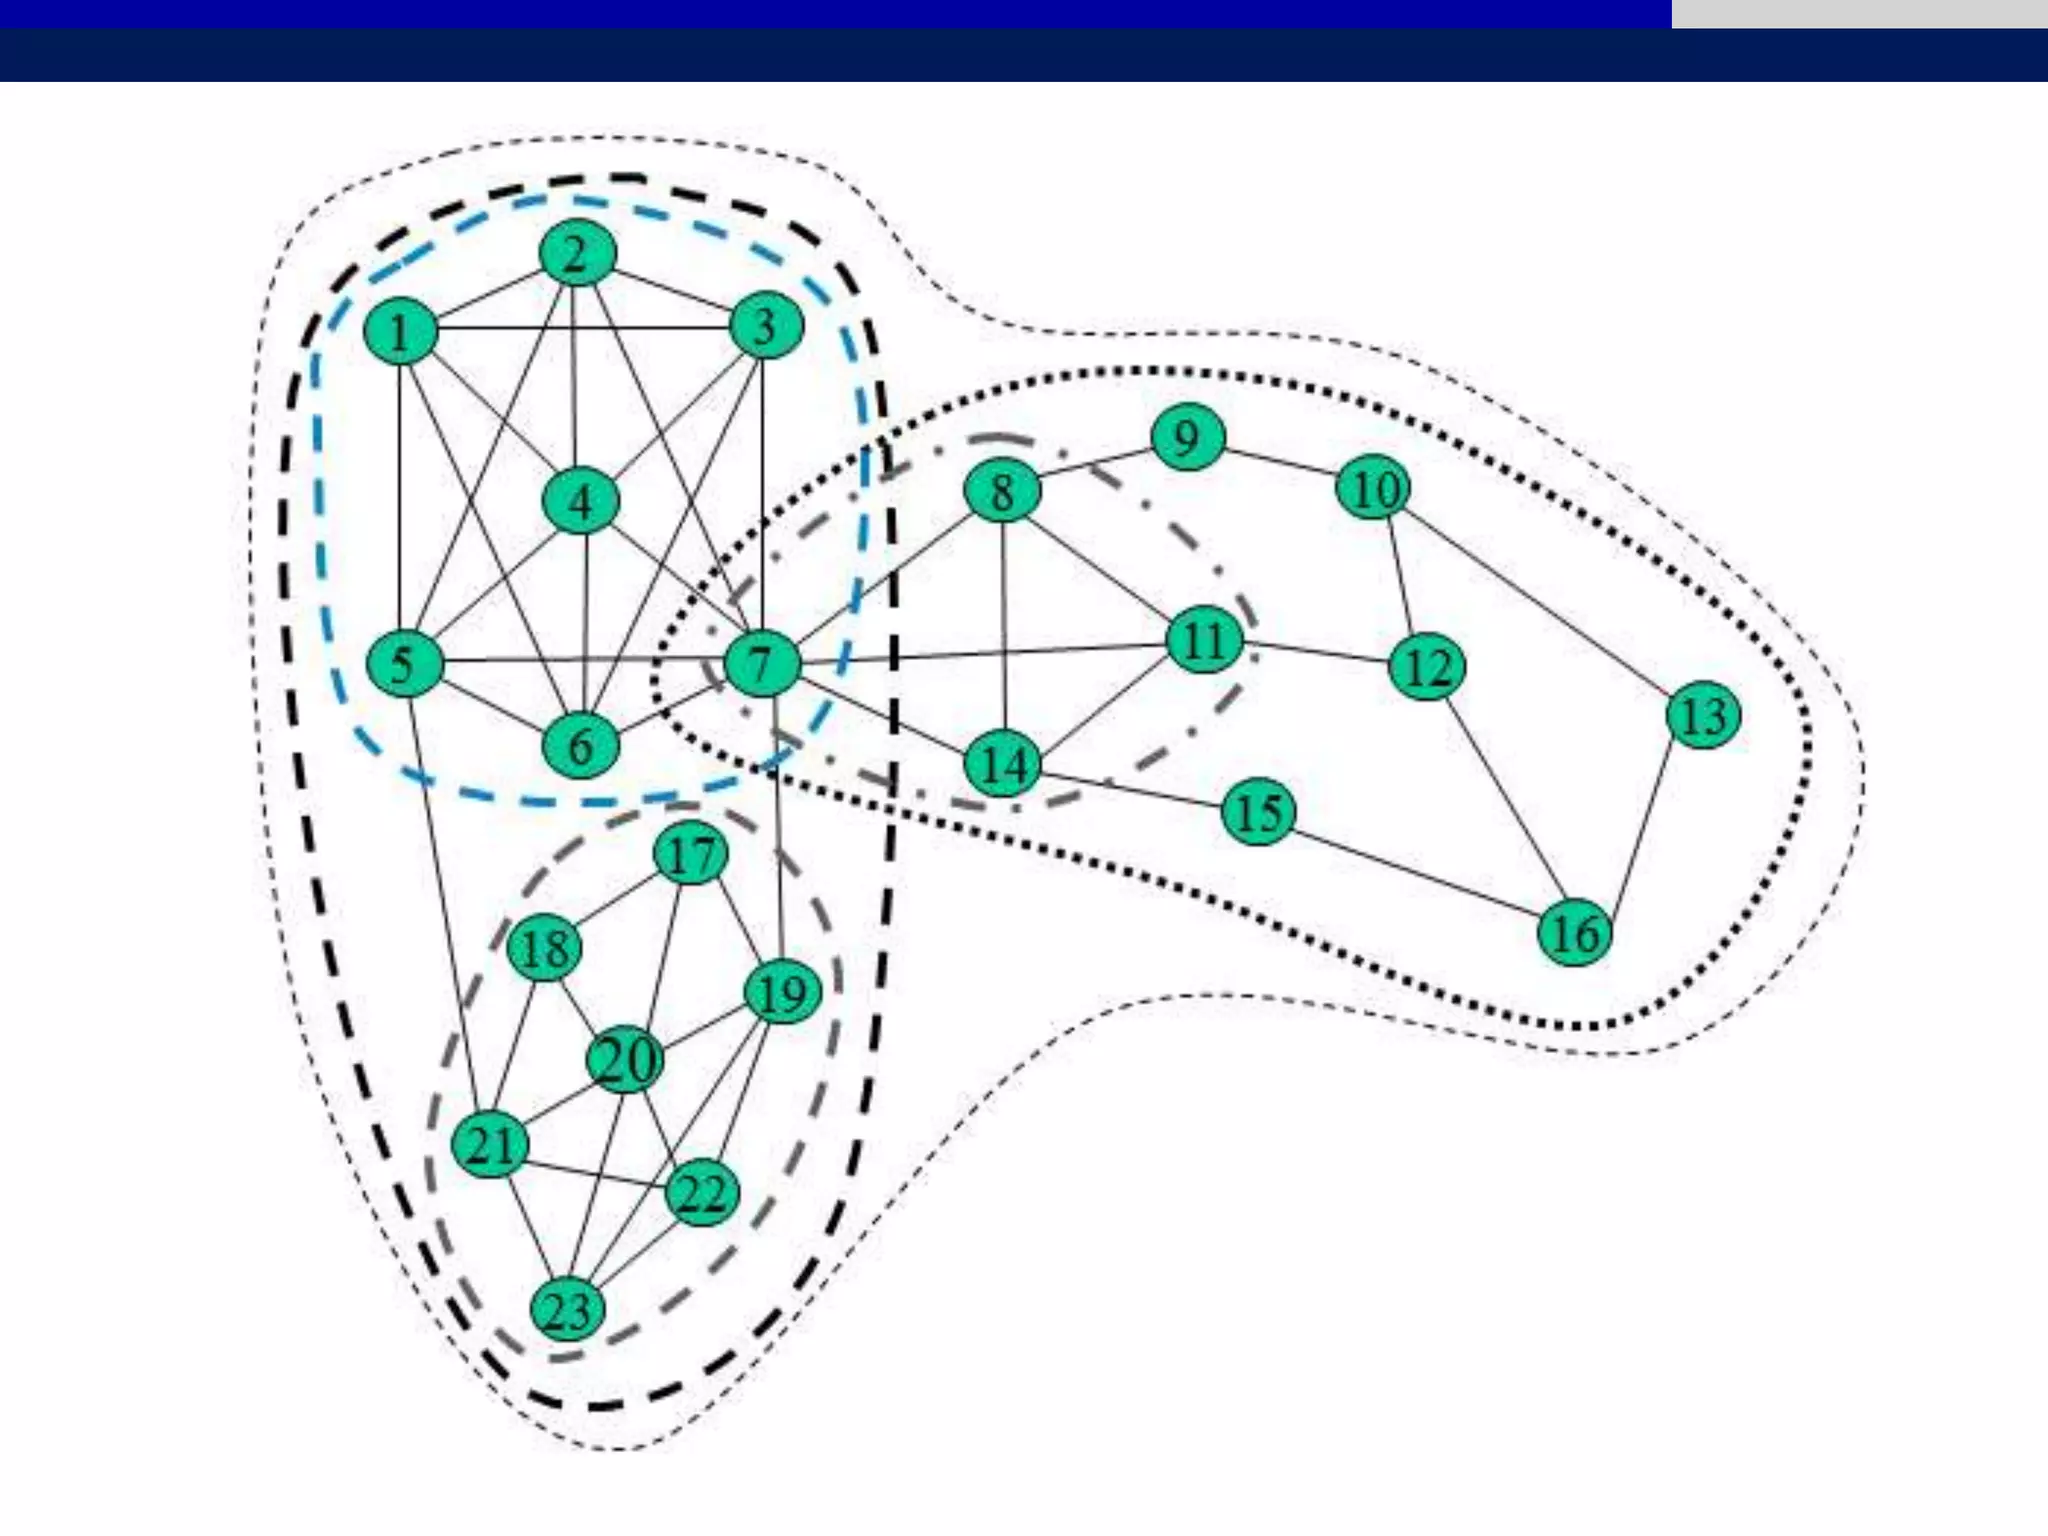
This document summarizes key concepts for describing networks, including centrality measures, connectivity, cohesion, and roles. It discusses measuring the importance of individual nodes through degrees, closeness, betweenness, and power centrality. It also covers sociocentric measures like degree distributions, centralization, and density. Additionally, it explores local connectivity through triads, transitivity, and clustering coefficients as well as structural cohesion through components and cut points.
Subscriber Churn Prediction Model using Social Network Analysis In Telecommun...BAINIDA
Subscriber Churn Prediction Model using Social Network Analysis In Telecommunication Industry โดย เชษฐพงศ์ ปัญญาชนกุล อาจารย์ ดร. อานนท์ ศักดิ์วรวิชญ์
ในงาน THE FIRST NIDA BUSINESS ANALYTICS AND DATA SCIENCES CONTEST/CONFERENCE จัดโดย คณะสถิติประยุกต์และ DATA SCIENCES THAILAND
How to conduct a social network analysis: A tool for empowering teams and wor...Jeromy Anglim
Slides and details available at: http://jeromyanglim.blogspot.com/2009/10/how-to-conduct-social-network-analysis.html
A talk on using social network analysis as a team development tool.
Social Network Analysis: What It Is, Why We Should Care, and What We Can Lear...Xiaohan Zeng
The advent of the social networks has completely changed our daily life. The deluge of data collected on Social Network Services (SNS) and recent developments in complex network theory have enabled many marvelous predictive analysis, which tells us many amazing stories.
Why do we often feel that "the world is so small?" Is the six-degree separation purely imagination or based on mathematical insights? Why are there just a few rockstars who enjoy extreme popularity while most of us stay unknown to the world? When science meets coffee shop knowledge, things are bound to be intriguing.
I will first briefly describe what social networks are, in the mathematical sense. Then I will introduce some ways to extract characteristics of networks, and how these analyses can explain many anecdotes in our life. Finally, I'll show an example of what we can learn from social network analysis, based on data from Groupon.
These slides are for my talk for the Somerville College Mathematics Reunion ("Somerville Maths Reunion", 6/24/17): http://www.some.ox.ac.uk/event/somerville-maths-reunion/
To have the ability to “think outside the box” is generally regarded as something positive. At a moment in time when resources are scarce, and the problems facing us are many, innovation and professional excellence becomes a requirement, rather than a matter of choice. At the core of our attempts to come up with new, and better solutions are the digital technologies. Within the structural engineering context, the different types of off-the-shelf packages for finite element analysis play a central role. These “black-box” types of software packages exemplify how user-friendliness may have harmful consequences within a field where knowledge and the successful mastery of relevant skills is key, and consequently- ignorance may lead to fatal results. These tools make any effort “venturing outside” difficult to achieve. A technical paradigm shift is called for- that places learning and creative, informed exploration at the heart of the user experience. Presented during the Knowledge Based Engineering session of the 19th IABSE congress entitled "Challenges in Design and Construction of an Innovative and Sustainable Built Environment" held in Stockholm, September 21-23, 2016.
To have the ability to “think outside the box” is generally regarded as something positive. At a moment in time when resources are scarce, and the problems facing us are many, innovation and professional excellence becomes a requirement, rather than a matter of choice. At the core of our attempts to come up with new, and better solutions are the digital technologies. Within the structural engineering context, the different types of off-the-shelf packages for finite element analysis play a central role. These “black-box” types of software packages exemplify how user-friendliness may have harmful consequences within a field where knowledge and the successful mastery of relevant skills is key, and consequently- ignorance may lead to fatal results. These tools make any effort “venturing outside” difficult to achieve. A technical paradigm shift is called for- that places learning and creative, informed exploration at the heart of the user experience. Presented during the Knowledge Based Engineering session of the 19th IABSE congress held in Stockholm, September 21-23, 2016.
Richard's aventures in two entangled wonderlandsRichard Gill
Since the loophole-free Bell experiments of 2020 and the Nobel prizes in physics of 2022, critics of Bell's work have retreated to the fortress of super-determinism. Now, super-determinism is a derogatory word - it just means "determinism". Palmer, Hance and Hossenfelder argue that quantum mechanics and determinism are not incompatible, using a sophisticated mathematical construction based on a subtle thinning of allowed states and measurements in quantum mechanics, such that what is left appears to make Bell's argument fail, without altering the empirical predictions of quantum mechanics. I think however that it is a smoke screen, and the slogan "lost in math" comes to my mind. I will discuss some other recent disproofs of Bell's theorem using the language of causality based on causal graphs. Causal thinking is also central to law and justice. I will mention surprising connections to my work on serial killer nurse cases, in particular the Dutch case of Lucia de Berk and the current UK case of Lucy Letby.
Slide 1: Title Slide
Extrachromosomal Inheritance
Slide 2: Introduction to Extrachromosomal Inheritance
Definition: Extrachromosomal inheritance refers to the transmission of genetic material that is not found within the nucleus.
Key Components: Involves genes located in mitochondria, chloroplasts, and plasmids.
Slide 3: Mitochondrial Inheritance
Mitochondria: Organelles responsible for energy production.
Mitochondrial DNA (mtDNA): Circular DNA molecule found in mitochondria.
Inheritance Pattern: Maternally inherited, meaning it is passed from mothers to all their offspring.
Diseases: Examples include Leber’s hereditary optic neuropathy (LHON) and mitochondrial myopathy.
Slide 4: Chloroplast Inheritance
Chloroplasts: Organelles responsible for photosynthesis in plants.
Chloroplast DNA (cpDNA): Circular DNA molecule found in chloroplasts.
Inheritance Pattern: Often maternally inherited in most plants, but can vary in some species.
Examples: Variegation in plants, where leaf color patterns are determined by chloroplast DNA.
Slide 5: Plasmid Inheritance
Plasmids: Small, circular DNA molecules found in bacteria and some eukaryotes.
Features: Can carry antibiotic resistance genes and can be transferred between cells through processes like conjugation.
Significance: Important in biotechnology for gene cloning and genetic engineering.
Slide 6: Mechanisms of Extrachromosomal Inheritance
Non-Mendelian Patterns: Do not follow Mendel’s laws of inheritance.
Cytoplasmic Segregation: During cell division, organelles like mitochondria and chloroplasts are randomly distributed to daughter cells.
Heteroplasmy: Presence of more than one type of organellar genome within a cell, leading to variation in expression.
Slide 7: Examples of Extrachromosomal Inheritance
Four O’clock Plant (Mirabilis jalapa): Shows variegated leaves due to different cpDNA in leaf cells.
Petite Mutants in Yeast: Result from mutations in mitochondrial DNA affecting respiration.
Slide 8: Importance of Extrachromosomal Inheritance
Evolution: Provides insight into the evolution of eukaryotic cells.
Medicine: Understanding mitochondrial inheritance helps in diagnosing and treating mitochondrial diseases.
Agriculture: Chloroplast inheritance can be used in plant breeding and genetic modification.
Slide 9: Recent Research and Advances
Gene Editing: Techniques like CRISPR-Cas9 are being used to edit mitochondrial and chloroplast DNA.
Therapies: Development of mitochondrial replacement therapy (MRT) for preventing mitochondrial diseases.
Slide 10: Conclusion
Summary: Extrachromosomal inheritance involves the transmission of genetic material outside the nucleus and plays a crucial role in genetics, medicine, and biotechnology.
Future Directions: Continued research and technological advancements hold promise for new treatments and applications.
Slide 11: Questions and Discussion
Invite Audience: Open the floor for any questions or further discussion on the topic.
A brief information about the SCOP protein database used in bioinformatics.
The Structural Classification of Proteins (SCOP) database is a comprehensive and authoritative resource for the structural and evolutionary relationships of proteins. It provides a detailed and curated classification of protein structures, grouping them into families, superfamilies, and folds based on their structural and sequence similarities.
Cancer cell metabolism: special Reference to Lactate PathwayAADYARAJPANDEY1
Normal Cell Metabolism:
Cellular respiration describes the series of steps that cells use to break down sugar and other chemicals to get the energy we need to function.
Energy is stored in the bonds of glucose and when glucose is broken down, much of that energy is released.
Cell utilize energy in the form of ATP.
The first step of respiration is called glycolysis. In a series of steps, glycolysis breaks glucose into two smaller molecules - a chemical called pyruvate. A small amount of ATP is formed during this process.
Most healthy cells continue the breakdown in a second process, called the Kreb's cycle. The Kreb's cycle allows cells to “burn” the pyruvates made in glycolysis to get more ATP.
The last step in the breakdown of glucose is called oxidative phosphorylation (Ox-Phos).
It takes place in specialized cell structures called mitochondria. This process produces a large amount of ATP. Importantly, cells need oxygen to complete oxidative phosphorylation.
If a cell completes only glycolysis, only 2 molecules of ATP are made per glucose. However, if the cell completes the entire respiration process (glycolysis - Kreb's - oxidative phosphorylation), about 36 molecules of ATP are created, giving it much more energy to use.
IN CANCER CELL:
Unlike healthy cells that "burn" the entire molecule of sugar to capture a large amount of energy as ATP, cancer cells are wasteful.
Cancer cells only partially break down sugar molecules. They overuse the first step of respiration, glycolysis. They frequently do not complete the second step, oxidative phosphorylation.
This results in only 2 molecules of ATP per each glucose molecule instead of the 36 or so ATPs healthy cells gain. As a result, cancer cells need to use a lot more sugar molecules to get enough energy to survive.
introduction to WARBERG PHENOMENA:
WARBURG EFFECT Usually, cancer cells are highly glycolytic (glucose addiction) and take up more glucose than do normal cells from outside.
Otto Heinrich Warburg (; 8 October 1883 – 1 August 1970) In 1931 was awarded the Nobel Prize in Physiology for his "discovery of the nature and mode of action of the respiratory enzyme.
WARNBURG EFFECT : cancer cells under aerobic (well-oxygenated) conditions to metabolize glucose to lactate (aerobic glycolysis) is known as the Warburg effect. Warburg made the observation that tumor slices consume glucose and secrete lactate at a higher rate than normal tissues.
4. Centrality: Individual Nodes
How can we distinguish “important” actors?
• Centrality:
• Who is at the ‘center’ of the network?
…but what is meant by ‘center’ gets complicated
5. How can we distinguish “important” actors?
Centrality: Individual Nodes
6. Centrality: Individual Nodes
How can we distinguish “important” actors?
• Centrality measurement approaches:
• Degrees
• Closeness
• Betweenness
• Information & Power
7. Centrality: Individual Nodes
• Choosing most useful measurement depends in part
on what is flowing through the network and how
• Different flow correspond with type of
power/prestige of position of interest, suggesting
measure of interest
9. Centrality: Individual Nodes
• Degree Centrality – number of ties
– Undirected
– Directed
• In-degrees
• Out-degrees
– Isolates
10. Centrality: Individual Nodes
• Kornienko et al.
2013:
Test salivary cortisol
(as an indicator of
stress) on in-degrees,
out-degrees, and ego-
network density. They
find significantly
higher cortisol for
those with low out-
degrees and a
protective effect of
average popularity.
11. Centrality: Individual Nodes
• But! Degree Centrality is a local measure:
– Can be deceiving
– Less appropriate
for non-local
questions
12. Centrality: Individual Nodes
• Closeness Centrality
– Actors considered important if close to all other
actors in the network
– Based in the inverse distance of each actor to
every other
• Often normalized by graph size to range 0-1
• Note: because closeness considers every actor, only get
measures in fully connected networks (or within
components)
1
1
),()(
g
j
jiic nndnC )1))((()('
gnCnC iCiC
13. Centrality: Individual Nodes
• Closeness Centrality - Beware: in R, different
packages measure closeness differently:
– High values = less distance (proximal nodes)
and small values = higher distance (far nodes)
OR
– High values = higher distance cost (far nodes)
and small values = less distance cost (proximal
nodes)
14. Centrality: Individual Nodes
• Betweenness Centrality
– Actor considered important if controls
information flow (or bridges relatively
disconnected portions of the network)
– Counts number of paths for actor j where j is on
the shortest path between actors i and k
kj
jkijkiB gngnC /)()(
15. Centrality: Individual Nodes
• Betweenness Centrality- number of paths for actor
j where j is on the shortest path between actors i
and k
16. Centrality: Individual Nodes
• Information Centrality
– Like betweenness, but not restricted to
geodesics; information can probably flow
through paths other than geodesics
Betweenness Information Centrality
17. Generally, the 3 centrality types will be positively correlated; When they are not
(low) correlated, it probably tells you something interesting about the network.
Low
Degree
Low
Closeness
Low
Betweenness
High Degree Embedded in cluster
that is far from the
rest of the network
Ego's connections
are redundant -
communication
bypasses him/her
High Closeness Key player tied to
important
important/active
alters
Probably multiple
paths in the
network, ego is near
many actors, but so
are many others
High
Betweenness
Ego's few ties are
crucial for network
flow
Very rare. Would
mean ego
monopolizes the ties
from a small # of
actors to many others.
Centrality: Individual Nodes – Comparing Measures
18. Low Degree/High Betweenness High Degree/Low Betweenness
(few ties crucial for network flow) (many redundant ties)
Centrality: Individual Nodes – Comparing Measures
19. Centrality: Individual Nodes
• Power- actors are important if tied to other
important actors
– Bonacich Power Centrality (prestige) – actors
tied to other important actors
– Eigenvector centrality – similar to Bonacich,
but without b
1)(),( 1
RRIC
bb
21. • Rather than considering important individual actors,
describing characteristics of the overall network
– Degree Distributions
– Centralization
– Density
Centrality: Sociocentric & Egocentric Networks
22. Centrality: Sociocentric & Egocentric Networks
• Translating individual actors degrees to whole
network measures:
• Degree Distribution – frequency distribution of
degree values of actors
– A simple random graph will have a Poisson
degree distribution, so variation from that
suggest non-random processes
– Egocentric network size
23.
24. Centrality: Sociocentric Networks
• Centralization – extent to which centrality is
concentrated in one/few actors; dispersion of
centrality in graph as a whole (Freeman
centralization)
)]2)(1[(
)()(1
*
gg
nCnC
C
g
i iDD
D
25. • Density – volume of relations in network - number
of ties relative to the number of possible ties
- Egocentric: conceptually, are ego’s alters also
connected to each other
Centrality: Sociocentric & Egocentric Networks
26.
27. Describing Sociocentric & Egocentric Networks
• Beyond centrality, consider structural arrangements
in combination with alter characteristics:
• Homophily – tendency for actors with similar
attributes to be more likely to be connected
• Assortativity, assortative/disassortative mixing
– Individual attributes: gender, same firm
– Structural attributes: same degree
28. Many More Measures
• Dyad level: reciprocity
• Peer Influence based measures (Friedkin and others). Based
on the assumed network autocorrelation model of peer
influence; variant of the eigenvector centrality measures
• Fragmentation centrality – Borgatti’s Key Player - nodes are
central if they can easily break up a network
• Removal Centrality – effect on the rest of the (graph for any
given statistic) with the removal of a given node; system-
contribution of a particular actor.
29. Connecting Measures to Mechanisms: Structural Holes
• Bridging Structural holes: connecting people who
otherwise would not be connected; social capital,
access to resources
• Redundancy (ties that connect ego to alters already
connected to) introduces constraint
• Power, brokerage by controlling info or resource by bridging
structural holes (tertius gaudens)
(Burt 1992)
30. Connecting Measures to Mechanisms: Structural Holes
• 4 related network features:
• Effective Size – (size – redundancy) – average degree of
ego network without counting alters’ ties to ego
• Efficiency – (effective size / observed size)
• Constraint – room to exploit structural holes or negotiate;
extent to which network alters are connected with each
other (direct/indirect, proportion of network ‘time & energy)
• Hierarchy – for Burt/structural holes, many measures of
hierarchy generally – extent to which constraint is
concentrated in one actor
32. Connectivity & Cohesion: Local Processes
• Dyadic – Reciprocity
• Triadic – Transitivity
• Characterize non-random social patterns in triad
connections with the triad census – counting
observed triads of each possible type
• Transitivity – where i j and j k, then i k
– With directed ties, observe transitive,
intransitive, vacuous triads
34. Connectivity & Cohesion: Clustering
• ‘Small World’ phenomenon:
• What’s the probability two
nodes are connected?
– Milgram’s packet
experiment – 6 step
average
– Watts – small local
changes can have big
effects on the global
network – a ‘small world
graph’ has relatively small
average path lengths and
relative large clusters
35. Connectivity & Cohesion: Clustering
• Clustering coefficient: 2 ways:
• Average local density (ego-network density/n)
• Transitivity ratio - # closed triads/total # triads
• Small world graphs occur when ‘shortcuts’ between
clusters dramatically reduce average path length
• Conceptually, small changes like ‘shortcuts’ can
have big effects on capacity for disease
transmission or other network features
36. Connectivity & Cohesion: Structural Cohesion
• Structural Cohesion conceptually – extent to which
networks or sub-groups within networks are ‘sticky’,
held together, interconnected, or resistant to
disruption
• Practically, very challenging to measure which
observable structures hold groups of any size
together
• Networks also vary in extent to which
connectedness flows through one or a few actors
– More paths linking network that don’t rely on
one actor = more cohesive
37. Connectivity & Cohesion: Structural Cohesion
• Reachability – actors i and j are reachable if any
path in the network connects them; more paths
linking (and re-linking actors in the group) increases
the ability of the group to ‘hold together’
• Pattern of ties, not just density
D = . 25 D = . 25
38. Node Connectivity
0 1 2 3
Same volume of ties, but graph on right has more independent
paths connecting network = more cohesive
Connectivity & Cohesion: Structural Cohesion
39. Connectivity & Cohesion: Components
• Component – maximal connected sub-graph -
connected graph where there is a path between
every node
• Cut-point – node whose removal would
disconnect the graph
– Cut-set – set of nodes necessary for keeping
graph connected
1
2
5
4 3
6
8
7
40. Connectivity & Cohesion: Components
• Formally defining Structural cohesion:
– Minimum number of actors, who if removed,
would disconnect the group
– Minimum number of independent paths linking
each pair of actors in the group
1
2
5
4 3
6
8
7
41. Connectivity & Cohesion: Components
• Features of components:
• k-components – maximal subset of actors linked
by at least k node-independent paths
– Every member must have at least k ties (but having k
ties doesn’t necessarily make a component)
– 2 k-components can only overlap by k-1 members (or
would be same component)
– Can be nested
• Embeddedness – identify cohesive groups
(blocks) in a network, then remove k-cutsets
identify successively deeper embedded groups
in graph
42.
43. Connectivity & Cohesion: Components
• Can consider components for ego-networks
• Different types of sub-structures in networks:
• Cliques – all members connected to all other
members
– n-clique – where n is number of steps greater than
direct tie, so can consider 2-clique, defined by 2-step
(friend of a friend) ties
• n-clans – members connected at distance n or
less, only through other members
• k-cores – members joined to at least k other
members, even if not connected to all other
members
45. Roles & Positions: Overall
• Measures that describe subsets
of actors/nodes who have
similarly structured relations
• Might expect different risks or
behaviors for actors occupying
similar positions or roles
46. Roles & Positions: Structural Equivalence
• Structural Equivalence:
• Actors are equivalent if they have the same ties to
the exact same people in the network
– Rare, maybe more restrictive than you want for
thinking about roles and positions in a network,
so can relax to:
• Regular Equivalence:
• Actors are equivalent if have ties to same types
(but not necessarily the exact same) of alters
47.
48. Roles & Positions: Equivalence Example
• Fujimoto & Valente (2012):
Examine adolescents’ exposure to drinking and
smoking based on network cohesion and structural
equivalence. They find exposure through structural
equivalence is a better predictor of drinking and
smoking, indicating being connected to the same types
of peers with the same types of behaviors matters
more than traditional measures of cohesion.
49. Describing Networks: Summary
• Many ways of describing networks or characterizing
nodes of interest within them
• Here: individual node properties, entire network
counterparts, then structures and sub-groups:
• Centrality
• Connectivity & Cohesion
• Roles
• Frame as micro/meso/macro
• Micro: individual nodes
• Meso: sub-groups, sub-graph structures, roles
• Macro: features of entire networks
50. Describing Networks: Summary
• Not considered here:
• Dynamics – stability over time, effects of changes,
etc.
• Bipartite networks
• Many more challenging concepts and additions in
describing networks:
• Blockmodeling
• Centrality or structural measures specific to
certain topics or processes
51. Resources
Borgatti, S. P. (2005). Centrality and network flow. Social networks, 27(1), 55-71.
Falci, C., & McNeely, C. (2009). Too Many Friends: Social Integration, Network Cohesion and
Adolescent Depressive Symptoms. Social Forces, 87(4), 2031–62.
Fujimoto, K., & Valente, T. W. (2012). Social network influences on adolescent substance use:
Disentangling structural equivalence from cohesion. Social Science and Medicine, 74(12), 1952–
1960.
Hawe P, Webster C, Shiell A. A glossary of terms for navigating the field of social network analysis.
Journal of Epidemiology & Community Health 2004;58:971-975.
Luke, D. A. & J. K. Harris. Network Analysis in Public Health: History, Methods, and Applications.
2007. Annual Review of Public Health. 28:69-93.
Kornienko, O., Clemans, K. H., Out, D., & Granger, D. A. (2013). Friendship network position and
salivary cortisol levels. Social Neuroscience, 8(4), 385–96. .
Moody, J. Slides from Social Networks Seminar, Duke, Spring 2015.
Morris, M., & Kretzschmar, M. (1995). Concurrent partnerships and transmission dynamics in
networks. Social Networks, 17(3–4), 299–318
O”Malley, A. J. & P. V. Marsden Health Serv Outcomes Res Methodol. 2008 Dec 1; 8(4): 222–269.
Scott, J. Social Network Analysis. 2012. SAGE.
Scott, J. & P. J. Carrington. The SAGE Handbook of Social Network Analysis. 2011.
Wasserman, S. & K. Faust. Social Network Analysis: Methods and Applications,. 1994 Cambridge.