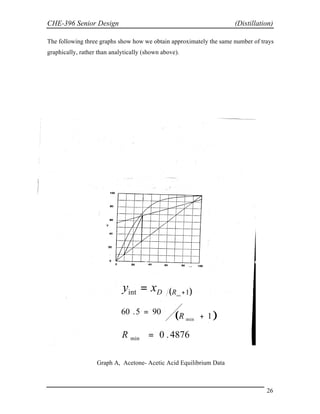
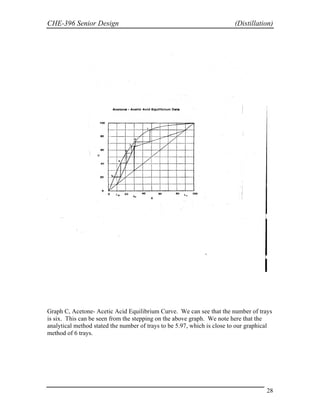
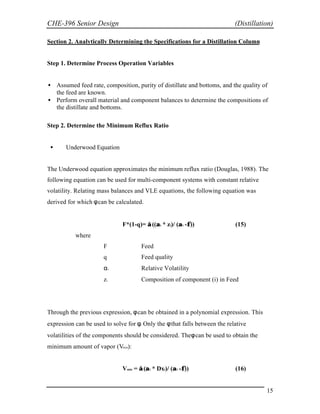
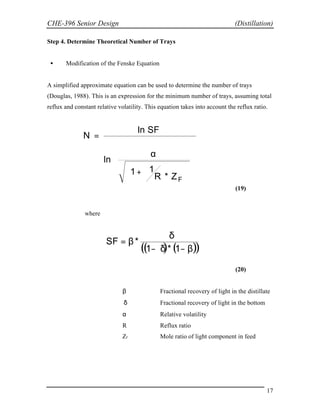
SlideShare a Scribd company logo
Distillation
Senior Design CHE 396
Andreas Linninger
Innovative Solutions
Michael Redel
Alycia Novoa
Tanya Goldina
Michelle Englert
CHE-396 Senior Design (Distillation)
2
Table of Contents
Introduction 3
Flowsheet 4
Limitations 5
Applicability 6
Theory 7
Case Study___________________________________________________24
Alternatives 288
References 309
CHE-396 Senior Design (Distillation)
3
Introduction
This report examines the distillation process. This will enable the reader to understand the
necessary components along with distillation calculations. Distillation is a process that
separates two or more components into an overhead distillate and bottoms. The bottoms
product is almost exclusively liquid, while the distillate may be liquid or a vapor or both.
The separation process requires three things. First, a second phase must be formed so that
both liquid and vapor phases are present and can contact each other on each stage within
a separation column. Secondly, the components have different volatilities so that they
will partition between the two phases to different extent. Lastly, the two phases can be
separated by gravity or other mechanical means. Distillation differs from absorption and
stripping in that the second phase is created by thermal means (Seader, 1998).
CHE-396 Senior Design (Distillation)
4
Flowsheet
The distillation column contains one feed stream and two product streams. The feed
contains a mole percent of the light component, ZF. The product stream exiting the top
has a composition of XD of the light component. The product stream leaving the bottom
contains a composition of Xb of the light component. The column is broken in two
sections. The top section is referred to as the rectifying section. The bottom section is
known as the stripping section.
The top product stream passes through a total condenser. This effectively condenses all of
the vapor distillate to liquid. The bottom product stream uses a partial reboiler. This
allows for the input of energy into our column.
CHE-396 Senior Design (Distillation)
5
Limitations
• Azeotropes: An azeotrope is a liquid mixture which when vaporized produces
the same composition as the liquid. If the mixture is azeotropic, then more
advanced types of separation must be considered. More information on
azeotropes maybe found in Douglas, Section 7.3.
• Solids: If the material to be separated is high in solids, or contains tars or
resins that could plug or foul a continuous unit, then a batch separation should
be considered (Perry’
s, 1997).
• Optimum Pressure (King, 1980):
1. Vacuum operation: Use of a vacuum should be considered for heat-
sensitive compounds or polymerizable materials. Vacuum is usually not
used unless required, e.g., a low bottoms temperature is needed to avoid
thermal decomposition.
2. Distillation column is above atmospheric pressure: Column shell should
be thicker to withstand pressure of the column.
3. If the column pressure required to accomplish overhead condensation with
cooling water is less than 250 lb/in
2
, then the column pressure should give
an average temperature driving force of 5-15*C in the overhead
condenser.
4. If the column pressure required accomplishing overhead condensation
with cooling water is greater than 250 lb/in2
, then consider an alternative
of using a refrigerant on the overhead and running the column at a lower
pressure.
CHE-396 Senior Design (Distillation)
6
• Optimum Temperature Differences in Reboilers and Condensers (King,
1980):
1. Reboiler temperatures should be kept low enough to avoid bottoms
degradation and/or fouling.
2. Common temperature differences used for heat exchange across reboilers
and condensers are shown in the following table:
Temp, K
Condenser:
Refrigeration 3-10
Cooling Water 6-20
Pressurized Fluid 10-20
Boiling Water 20-40
Air 20-50
Reboiler:
Process Fluid 10-20
Steam 10-60
Hot Oil 20-60
Applicability
• Distillation is the least expensive means of separating mixtures of liquids.
• If relative volatilities of components is less than 1.1, distillation becomes very
expensive (Douglas, 1988) and extraction or reactive distillation should be
considered.
CHE-396 Senior Design (Distillation)
7
Theory
Section 1. Graphical Determination of a Distillation Column Design
Step 1. Determine Process Operation Variables
• Assumed feed rate, composition, purity of distillate and bottoms, and the quality of
the feed are known.
• Perform overall material and component balances to determine the compositions of
the distillate and bottoms.
F*ZF=XD*D+XB*B (1)
F=D+B (2)
where
F Feed rate of input stream
ZF Composition of light component in feed
XD *Mole Fraction of light in distillate
XB *Mole Fraction of light in Bottom
D Total distillate amount
B Total bottom amount
*If more than two components, these values are the light-key and heavy-key component.
Step 2. Determine the Minimum Reflux Ratio
This graphical approach is determined using the McCabe-Thiele Method for binary
mixtures. The ratio of reflux flow to distillate flow is called the reflux ratio.
CHE-396 Senior Design (Distillation)
8
Assumptions
The following assumptions are implied when using this method (McCabe,
1993):
a. Constant Molal Overflow. The molar flow rates of the vapor and
liquid are nearly constant in each section of the column. This also
ensures the operating lines are straight lines.
b. Heat Effects are negligible. For example, heat losses to and from
the column are small and neglected.
c. For every mole of vapor condensed, another mole of liquid is
vaporized.
d. The liquid and vapor leaving the tray is in equilibrium with the
vapor and liquid entering the tray.
Procedure
If an equilibrium curve is not given, draw a y-x diagram (y representing the vapor
phase and x the liquid). The equilibrium curve can be obtained by relating the
relative volatility to the composition of the liquid:
y = α*x/(1+x(α-1)) (4)
This shows the bubble-point and dew point of a binary mixture at constant
pressure. An equilibrium line describes the compositions of the liquid and vapor
in equilibrium at a fixed pressure. The equilibrium line crossing the forty-five
degree line is an indication of an azeotropic mixture. An azeotrope is a liquid
mixture which when vaporized produces the same composition as the liquid. If
the mixture is azeotropic, then more advanced types of separation must be
considered.
CHE-396 Senior Design (Distillation)
9
• Forty Five Degree Line
1. Draw the diagonal line connecting the points (0.0,0.0) to (1.0,1.0).
This is your forty-five degree line.
• Feed Line (q-Line)
2. The feed line can be constructed by locating the point on the forty-
five degree line that corresponds to the feed composition. This
point can be extended with a slope ofq/(q-1) where q is the feed
quality. The feed line can be directly plotted through the following
equation:
y=q/(q-1)X - ZF/(q-1) (5)
• Upper Operating Line
3. Draw the operating line for the enriching section. First find the
desired top product composition (on the x-axis) and locate the
corresponding point on the forty-five degree line. Connect this
point to the point where the equilibrium cure and the feed line
CHE-396 Senior Design (Distillation)
10
intersect. This is the upper operating line. The y intercept of this
line is equal toXD/(R+1). The following equation can be used to
determine the minimum reflux:
Rmin=(XD/yintercept ) – 1 (6)
• Lower Operating Line
4. Draw the operating line for the stripping section. First find the
desired bottom product composition (on the x-axis) and locate the
corresponding point on the forty-five degree line. Draw a line from
this point to the intersection of the equilibrium curve and the feed
line. This is your lower operating line. The slope of this line is
equal to (Vbmin+1)/Vbmin where Vb is the boilup ratio. The
boilup ratio is the fractional amount of liquid that is boiled back
into the column to the amount of liquid leaving.
Step 3. Choose Actual Reflux Ratio:
As the reflux ratio increases, the number of trays and thus the capital cost of the column
decreases. However, as a trade-off, an increase in reflux ratio will also increase the vapor
rate within the tower, thus increasing expenses such as condensers and reboilers (4).
Most columns are designed to operate between 1.2 and 1.5 times the minimum reflux
ratio because this is approximately the region of minimum operating cost. Therefore,
based on first estimates, the operating reflux ratio is equated so that (Douglas, 1988):
Ractual =Rmin* 1.2 (7)
CHE-396 Senior Design (Distillation)
11
Step 4. Determine the Minimum Number of Trays
• Upper/Lower Operating Line at Actual Reflux
1. Redraw the upper and lower operating line using the actual reflux ratio. Plot the
point XD/(R+1) and draw a line to the XD. The equation of the upper operating line
is:
y=(R/R+1)*X+XD/(R+1) (8)
The equation for the lower operating line can be drawn by connecting the X
B to
the intersection of the feed line and the upper operating line. The equation of the
lower operating line is:
y=((VB+1)/VB)*X+XB/VB (9)
• Determine Number of Trays
2. Starting from composition of the distillate, a horizontal line is drawn to the
equilibrium curve. This line demonstrates the first tray.
3. From the previous intersection, drop vertically until the upper operating line is
obtained. Follow step two to determine next tray.
CHE-396 Senior Design (Distillation)
12
4. Continue stepping until the liquid composition ends equals the desired bottom
composition.
5. The total number of steps is equal to the theoretical number of trays.
6. When high conversions are desired, the stepping method may cause difficulties. In
these cases the Kremser equation should be used.
(10)
where
N Number of trays in unreadable region
m Slope of the line in unreadable region
V/L R/(R+1)
yin Conveniently chosen point below unreadable region
yout XD for rectifying section
ye,out m*XD+b (where b is the y intercept of new equil. line)
( )
( ) 











+
−
−






−
=
L
V
m
ln
L
V
m
y
y
y
y
*
L
V
m
1
ln
N
out
,
e
out
out
,
e
in
CHE-396 Senior Design (Distillation)
13
Step 5. Determine Actual Number of Trays
This is determined by taking the quotient of the number of theoretical trays to the tray
efficiency. Typical values for tray efficiency range from 0.5 to 0.7 (Douglas, 1988).
These values depend on the type of trays being used, as well as the internal liquid and
vapor flow rates.
Nactual = Ntheory /ε (11)
Step 6. Principal Dimensions of the Column (Diameter/Height):
• A design guideline that should be used is that the height of the column should
not be higher than 175 feet.
• Height-to-diameter ratio should be less than 20 to 30.
• Packed towers are used when the column has a small diameter (1.5 ft or less)
or area (1.77 ft2
or less) rather than plate towers.
• Either plate or packed towers may be used when the column diameter is
between 1.5-4.5 ft (or area, 1.77- 15.9 ft2
).
• If the tower is higher than 190 ft, then a design with smaller tray spacing
should be considered (Douglas, 1988).
The tower height can be related to the number of trays in the column. The following
formula assumes that a spacing of two feet between trays will be sufficient including
additional five to ten feet at both ends of the tower. This includes a fifteen percent excess
allowance of space (Douglas, 1988).
Htower = 2.3 Nactual (12)
CHE-396 Senior Design (Distillation)
14
Before we can determine the tower diameter, we need to determine the vapor velocity.
The vapor velocity can be derived from the flooding velocity. To limit our column from
flooding, we choose a velocity 50-80 percent of flooding velocity (Douglas, 1988):
(13)
where
V Vapor Velocity
ρG Density of the mixture
The diameter of the tower is relatively insensitive to changes in operating temperature or
pressure. The main determinant of the diameter is the vapor velocity. The desired vapor
velocity is dependent on the limitations of undesired column flooding.
(14)
where
DT Diameter of tower
V Vapor velocity
MG Molecular weight of gas
ρm Molar density
G
2
.
1
V
ρ
=
25
.
0
m
G
T
M
*
V
0164
.
D 







ρ
=
CHE-396 Senior Design (Distillation)
15
Section 2. Analytically Determining the Specifications for a Distillation Column
Step 1. Determine Process Operation Variables
• Assumed feed rate, composition, purity of distillate and bottoms, and the quality of
the feed are known.
• Perform overall material and component balances to determine the compositions of
the distillate and bottoms.
Step 2. Determine the Minimum Reflux Ratio
• Underwood Equation
The Underwood equation approximates the minimum reflux ratio (Douglas, 1988). The
following equation can be used for multi-component systems with constant relative
volatility. Relating mass balances and VLE equations, the following equation was
derived for whichφcan be calculated.
F*(1-q)= ∑ ((αi * zi)/ (αi -φ
)) (15)
where
F Feed
q Feed quality
αi Relative Volatility
zi Composition of component (i) in Feed
Through the previous expression, φcan be obtained in a polynomial expression. This
expression can be used to solve forφ
. Only the φthat falls between the relative
volatilities of the components should be considered. Theφcan be used to obtain the
minimum amount of vapor (Vmin):
Vmin = ∑ (αi * Dxi)/ (αi -φ
)) (16)
CHE-396 Senior Design (Distillation)
16
From a mass balance and the definition of reflux:
Lmin = Vmin – D
Rmin = Vmin / D (17)
Step 3. Choose Theoretical Reflux Ratio
As the reflux ratio increases, the number of trays and thus the capital cost of the column
decreases. However, as a trade-off, an increase in reflux ratio will also increase the vapor
rate within the tower, thus increasing expenses such as condensers and reboilers
(Douglas, 1988). Most columns are designed to operate between 1.2 and 1.5 times the
minimum reflux ratio because this is approximately the region of minimum operating
cost. Therefore, based on first estimates, the operating reflux ratio for the analytically
method is equated so that (Douglas, 1988):
RTheor = 1.2 *Rmin (18)
CHE-396 Senior Design (Distillation)
17
Step 4. Determine Theoretical Number of Trays
• Modification of the Fenske Equation
A simplified approximate equation can be used to determine the number of trays
(Douglas, 1988). This is an expression for the minimum number of trays, assuming total
reflux and constant relative volatility. This equation takes into account the reflux ratio.
(19)
where
(20)
β Fractional recovery of light in the distillate
δ Fractional recovery of light in the bottom
α Relative volatility
R Reflux ratio
ZF Mole ratio of light component in feed

















 +
α
=
F
Z
*
R
1
1
ln
SF
ln
N
( ) ( )
( )
β
−
δ
−
δ
β
=
1
*
1
*
SF
CHE-396 Senior Design (Distillation)
18
Step 5. Determine Actual Number of Trays:
This is determined by taking the quotient of the number of theoretical trays to the tray
efficiency. Typical values for tray efficiency range from 0.5 to 0.7 (Douglas, 1988).
These values depend on the type of trays being used, as well as the internal liquid and
vapor flow rates.
Nactual = N/ε (21)
Step 6. Principal Dimensions of the Column (Diameter/Height):
• A design guideline that should be used is that the height of the column should
not be higher than 175 feet.
• Height-to-diameter ratio should be less than 20 to 30.
• Packed towers are used when the column has a small diameter (1.5 ft or less)
or area (1.77 ft2
or less) rather than plate towers.
• Either plate or packed towers may be used when the column diameter is
between 1.5-4.5 ft (or area, 1.77-15.9 ft2
).
• If the tower is higher than 190 ft, then a design with smaller tray spacing
should be considered (Douglas, 1988).
• Height of Column
The tower height can be related to the number of trays in the column. The following
formula assumes that a spacing of two feet between trays will be sufficient including
additional five to ten feet at both ends of the tower. This includes a fifteen percent excess
allowance of space (Douglas, 1988).
Htower = 2.3 Nactual [ft] (22)
CHE-396 Senior Design (Distillation)
19
• Vapor Velocity
Before we can determine the tower diameter, we need to determine the vapor velocity.
The vapor velocity can be derived from the flooding velocity. To limit our column from
flooding, we chose a velocity 60 percent of flooding velocity (Douglas, 1988). This is
assumed in the following equation:
(23)
where
V Vapor Velocity
ρG Density of the Gas
• Diameter of Tower
The diameter of a tower is relatively insensitive to changes in operating temperature or
pressure. The main determinant of the diameter is the vapor velocity. The desired vapor
velocity is dependent on the limitations of undesired column flooding. This equation
allows for a twelve percent surplus in area (Douglas, 1998).
DT = .0164√(V) * (MG/ ρm )^.25 (24)
where
V Vapor Velocity
MG
ρm Molar density
G
2
.
1
V
ρ
=
CHE-396 Senior Design (Distillation)
20
Section 3. Determining the Cost of Column and Components
All cost estimates formulas were taken from (Douglas, 1988).
Step 1. Cost of Column
• Capital Cost
The following approximates installed cost and purchased cost for the shell and trays.
This cost relates the diameter, height, and design variables of the column. The design
variable is a correction used to allow specificity of the column pressure and material.
(25)
where
Cc Cost of shell and trays
Fc Design considerations for the column
DT Diameter of column
H Height of column
Step 2. Cost of the Reboiler
• Capital Cost
The installed cost of the reboiler heat exchanger is:
(26)
where
Cr Cost of reboiler
∆Hv Heat of vaporization of bottoms
V Rate of Boilup
( )
c
8
.
0
T
c F
218
*
H
*
D
120
*
280
S
&
M
C +






=
65
.
0
65
.
0
v
r V
*
11250
H
*
328
*
280
S
&
M
C 




 ∆






=
CHE-396 Senior Design (Distillation)
21
• Operating Cost
If we use steam to supply the heat for the reboiler, the temperature driving force must
be constrained to less than 30-45 F to prevent film boiling. We are also assuming a
high value of heat transfer coefficient because the heat transfer between a condensing
vapor and boiling liquid is high. The steam required is:
(27)
(28)
where
Ws Amount of steam needed
Cs Cost of steam
∆Hv Heat of vaporization
∆Hs Heat of saturation
V Mass flow rate
V
*
H
H
W
s
v
s 







∆
∆
=
( ) V
*
H
*
SteamCost
*
10
*
74
.
8
C V
3
s ∆
= −
CHE-396 Senior Design (Distillation)
22
Step 3. Cost of Condenser
• Capital Cost
If we assume the cooling water is available at 90 F and a heat transfer coefficient
of 100, the heat transfer area of the condenser heat exchanger is:
Ac=((∆Hv/3000)⋅
ln (Tb-90/Tb-120))⋅
V (29)
where
Ac Area of condenser heat exchanger
∆Hv Heat of vaporization
Tb Bubble point of distillate
V Mass flow rate
The installed cost of the heat exchanger for condensing:
Cc=(M&S/280)*101.3*(2.29+Fc)*Ac0.65
(30)
where
Cc Cost of condenser
Fc Design considerations correction factor
• Operating Cost
If we assume the cooling water is available at 90 F and a heat transfer coefficient
of 100, the amount of cooling water needed for the condenser and the associated
cost is:
Wc=(∆Hv/30)V (31)
Cc=3.26⋅
10-4
*(Cooling water cost)(∆Hv)(V) (32)
where
Wc Amount of cold water to condenser
Cc Cost of condenser
∆Hv Heat of vaporization
V Mass flow rate
CHE-396 Senior Design (Distillation)
23
Step 4. Total Cost of Column
The total annualized cost is the sum of capital cost divided by the payback period plus
the yearly operating cost.
TAC = Capital Cost / Payback Period + Operating Cost (33)
CHE-396 Senior Design (Distillation)
24
Section 4. Case Study
Feed Stream, Acetone/Acetic Acid F=100mole/hr
Light-Key Mole Fraction, ZF=0.30
Percentage of Light in Distillate XD=0.90
Percentage of Light in Bottoms XB=0.10
Quality of Feed Q=1
We can simultaneously solve equations (1) and (2), F*Z
F=XD*D+XB*B and F=D+B, to
obtain the amount of distillate and bottoms:
100*.3=.9*D+.1*B
100=D+B
B=75mole/hr D=25mole/hr
The reflux ratio and number of trays were calculated graphically. These graphs can be
viewed after this section. The minumum reflux ratio can be calculated through a variation
of the Underwood equation. When the quality is equal to one and in a binary mixture,
equation (15) reduces to: Rmin =(1/(α-1))*((XD/XF)-α*(1-XD)/(1-XF))
Rmin=(1/(4.36-1))*((.9/.7)-4.36*.1/.3)
Rmin=.716
CHE-396 Senior Design (Distillation)
25
The theoretical minimum reflux ratio is derived from equation (18), R
theory=1.2*Rmin:
Rtheory=.859
From the Fenske equation (19) we can determine the number of trays:
Nmin=ln(81)/ln(4.36/√(1+1/(.81*.3))
N=5.97 Trays
CHE-396 Senior Design (Distillation)
26
The following three graphs show how we obtain approximately the same number of trays
graphically, rather than analytically (shown above).
Graph A, Acetone- Acetic Acid Equilibrium Data
( )
1
90
5
.
60
min +
=
R
( )
1
int min
+
= R
D
x
y
4876
.
0
min =
R
CHE-396 Senior Design (Distillation)
27
Graph B, Acetone- Acetic Acid Equilibrium
5861
.
0
4876
.
0
*
2
.
1
*
2
.
1 min =
=
= R
R
78
.
56
)
1
5851
.
0
(
90
int =
+
=
y
CHE-396 Senior Design (Distillation)
28
Graph C, Acetone- Acetic Acid Equilibrium Curve. We can see that the number of trays
is six. This can be seen from the stepping on the above graph. We note here that the
analytical method stated the number of trays to be 5.97, which is close to our graphical
method of 6 trays.
CHE-396 Senior Design (Distillation)
29
Alternatives
• Extraction: A process where one or more solutes are removed from a liquid by
transferring the solute(s) into a second liquid phase. Liquids must be immiscible or
partially immiscible. Vaporization is not required, thus extraction can be done at low
temperatures and is a gentle process suitable for unstable molecules (Wankat, 1988).
• Adsorption: Involves the transfer and equilibrium distribution of one or more solutes
between a fluid phase and particles. Liquid mixture is brought into contact with a
microporous solid allowing adsorption of certain components in the mixture takes
place on the internal surface of the solid. The adsorbent (solid) is insoluble in the
liquid, and the components being adsorbed are called solutes (Perry’
s, 1997).
• Condensation: Occurs when a saturated vapor comes in contact with a surface whose
temperature is below the saturation temperature. Film-type condensation occurs
when a film layer of condensate is formed on the surface. Dropwise condensation
occurs when appears in many small droplets at various points on the surface (Perry’
s,
1997).
• Reactive Distillation: Works by adding an entrainer that reacts with one component in
a mixture that is difficult to separate if relative volatilities of two components are very
close (less than 1.1). In the first column, the entrainer will react with one component
to increase the relative volatility so that it may be separated while in a second column,
the reaction can be reversed so that the entrainer can be recycled (King, 1980).
• Extractive Distillation: This operation requires two distillation columns. A heavy
nonvolatile component is added near the top of the tower to modify the activity
coefficients between two components. A pure component in the overhead in the first
column is obtained while the other component is recovered in the overhead in the
second column (King, 1980).
CHE-396 Senior Design (Distillation)
30
References
1. Seader, J. and Henley, E. Separation Process Principles. John Wiley & Sons,
1998, Chapters 7 and 8.
2. McCabe, Warren. Unit Operations of Chemical Engineering, Fifth Edition.
McGraw-Hill, Inc, 1993, Chapters 18 and 19.
3. Distillation Column Design. Copyright 1997.
http://lorien.ncl.ac.uk/ming/distil/distil0.htm
4. Douglas, James. Conceptual Design of Chemical Processes. McGraw-Hill, Inc.,
1988, Section A.3.
5. King, C. Judson. Separation Processes, Second Edition. McGraw-Hill, Inc.,
1980, Chapters 4-6.

More Related Content

What's hot

Distillation
DistillationDistillation
Distillation
Akul Jain
 
McCABE-THIELE DESIGN METHOD
McCABE-THIELE DESIGN METHODMcCABE-THIELE DESIGN METHOD
McCABE-THIELE DESIGN METHOD
Meet Patel
 
Distillation Column Design
Distillation Column DesignDistillation Column Design
Distillation Column Design
EPIC Systems
 
Distillation column design
Distillation column designDistillation column design
Distillation column design
Faruk Eyigün
 
Design of Distillation Column.pptx
Design of Distillation Column.pptxDesign of Distillation Column.pptx
Design of Distillation Column.pptx
CrisaderSh
 
Plate hydraulic design
Plate hydraulic designPlate hydraulic design
Plate hydraulic design
Jibran Ghumro
 
2.4 Plate efficiencies
2.4 Plate efficiencies2.4 Plate efficiencies
Raoult’s law , dalton’s law , concept of volatility and relative volatility a...
Raoult’s law , dalton’s law , concept of volatility and relative volatility a...Raoult’s law , dalton’s law , concept of volatility and relative volatility a...
Raoult’s law , dalton’s law , concept of volatility and relative volatility a...
Sunny Chauhan
 
Distillation Basics(Done).ppt
Distillation Basics(Done).pptDistillation Basics(Done).ppt
Distillation Basics(Done).ppt
AshwaniSharma12978
 
distillation
distillationdistillation
distillation
guest22f059
 
Section 5 multistage separation processes
Section 5   multistage separation processesSection 5   multistage separation processes
Section 5 multistage separation processes
Amal Magdy
 
Heat exchanger
Heat exchanger Heat exchanger
Heat exchanger
U.E.T Lahore Pakistan
 
Evaporator
EvaporatorEvaporator
Evaporator
Man Fenix
 
Reactive distillation
Reactive distillationReactive distillation
Reactive distillation
Karnav Rana
 
1 reboilers types
1 reboilers types1 reboilers types
1 reboilers types
lesvit
 
Ethylene Glycol plant design
Ethylene Glycol plant designEthylene Glycol plant design
Ethylene Glycol plant design
Ahmed Kun
 
Crystalization (Mass Transfer)
Crystalization (Mass Transfer)Crystalization (Mass Transfer)
Crystalization (Mass Transfer)
KrishnaKantNayak2
 
2.2 McCabe-Thiele method
2.2 McCabe-Thiele method2.2 McCabe-Thiele method
Absorption stripping
Absorption strippingAbsorption stripping
Absorption stripping
jogeman
 
FLUIDIZATION
FLUIDIZATION FLUIDIZATION
FLUIDIZATION
Rajan Kakadiya
 

What's hot (20)

Distillation
DistillationDistillation
Distillation
 
McCABE-THIELE DESIGN METHOD
McCABE-THIELE DESIGN METHODMcCABE-THIELE DESIGN METHOD
McCABE-THIELE DESIGN METHOD
 
Distillation Column Design
Distillation Column DesignDistillation Column Design
Distillation Column Design
 
Distillation column design
Distillation column designDistillation column design
Distillation column design
 
Design of Distillation Column.pptx
Design of Distillation Column.pptxDesign of Distillation Column.pptx
Design of Distillation Column.pptx
 
Plate hydraulic design
Plate hydraulic designPlate hydraulic design
Plate hydraulic design
 
2.4 Plate efficiencies
2.4 Plate efficiencies2.4 Plate efficiencies
2.4 Plate efficiencies
 
Raoult’s law , dalton’s law , concept of volatility and relative volatility a...
Raoult’s law , dalton’s law , concept of volatility and relative volatility a...Raoult’s law , dalton’s law , concept of volatility and relative volatility a...
Raoult’s law , dalton’s law , concept of volatility and relative volatility a...
 
Distillation Basics(Done).ppt
Distillation Basics(Done).pptDistillation Basics(Done).ppt
Distillation Basics(Done).ppt
 
distillation
distillationdistillation
distillation
 
Section 5 multistage separation processes
Section 5   multistage separation processesSection 5   multistage separation processes
Section 5 multistage separation processes
 
Heat exchanger
Heat exchanger Heat exchanger
Heat exchanger
 
Evaporator
EvaporatorEvaporator
Evaporator
 
Reactive distillation
Reactive distillationReactive distillation
Reactive distillation
 
1 reboilers types
1 reboilers types1 reboilers types
1 reboilers types
 
Ethylene Glycol plant design
Ethylene Glycol plant designEthylene Glycol plant design
Ethylene Glycol plant design
 
Crystalization (Mass Transfer)
Crystalization (Mass Transfer)Crystalization (Mass Transfer)
Crystalization (Mass Transfer)
 
2.2 McCabe-Thiele method
2.2 McCabe-Thiele method2.2 McCabe-Thiele method
2.2 McCabe-Thiele method
 
Absorption stripping
Absorption strippingAbsorption stripping
Absorption stripping
 
FLUIDIZATION
FLUIDIZATION FLUIDIZATION
FLUIDIZATION
 

Similar to distillation design.pdf

Distillation Column Design.pdf
Distillation  Column Design.pdfDistillation  Column Design.pdf
Distillation Column Design.pdf
KAhmedRehman
 
McCabe Thiele graphical design method .ppt
McCabe Thiele graphical design method .pptMcCabe Thiele graphical design method .ppt
McCabe Thiele graphical design method .ppt
HussamElddinKhasawne
 
distillation
distillationdistillation
distillation
Govind Manglani
 
Assignment 1
Assignment 1Assignment 1
Assignment 1
ayimsevenfold
 
Dc lab 5
Dc lab 5Dc lab 5
Dc lab 5
ykhan60
 
Chapter_4_distillation.pptx
Chapter_4_distillation.pptxChapter_4_distillation.pptx
Chapter_4_distillation.pptx
GirishGupta87
 
Microsoft PowerPoint - Ch90279.PDF
Microsoft PowerPoint - Ch90279.PDFMicrosoft PowerPoint - Ch90279.PDF
Microsoft PowerPoint - Ch90279.PDF
hesam ahmadian
 
L09-Separations and Column Simulation.pptx
L09-Separations and Column Simulation.pptxL09-Separations and Column Simulation.pptx
L09-Separations and Column Simulation.pptx
KAhmedRehman
 
gas absorption
gas absorptiongas absorption
gas absorption
Abhijit Panchmatiya
 
10 synthesis of reaction separation system lec 10 homogenous separation
10 synthesis of reaction separation system lec 10 homogenous separation10 synthesis of reaction separation system lec 10 homogenous separation
10 synthesis of reaction separation system lec 10 homogenous separation
ayimsevenfold
 
Combustion tutorial ( Eddy Break up Model) , CFD
Combustion tutorial ( Eddy Break up Model) , CFDCombustion tutorial ( Eddy Break up Model) , CFD
Combustion tutorial ( Eddy Break up Model) , CFD
A.S.M. Abdul Hye
 
Chapter-8-Production-of-Power.pptx
Chapter-8-Production-of-Power.pptxChapter-8-Production-of-Power.pptx
Chapter-8-Production-of-Power.pptx
BiancaMnl
 
4 modeling and control of distillation column in a petroleum process
4 modeling and control of distillation column in a petroleum process4 modeling and control of distillation column in a petroleum process
4 modeling and control of distillation column in a petroleum process
nazir1988
 
Section 4 multistage separation processes
Section 4   multistage separation processesSection 4   multistage separation processes
Section 4 multistage separation processes
Amal Magdy
 
Flash distillation
Flash distillationFlash distillation
Flash distillation
Nirbhay Miglani
 
Microsoft PowerPoint - Ch91092.PDF
Microsoft PowerPoint - Ch91092.PDFMicrosoft PowerPoint - Ch91092.PDF
Microsoft PowerPoint - Ch91092.PDF
hesam ahmadian
 
Continuous Rectification
Continuous RectificationContinuous Rectification
Continuous Rectification
Alexander Nootens
 
Batch distillation employing cyclic rectification and stripping operations
Batch distillation employing cyclic rectification and stripping operationsBatch distillation employing cyclic rectification and stripping operations
Batch distillation employing cyclic rectification and stripping operations
ISA Interchange
 
1-1 lecture absorption...#.pptx
1-1 lecture absorption...#.pptx1-1 lecture absorption...#.pptx
1-1 lecture absorption...#.pptx
FarahTalib4
 
1-1 lecture absorption...#.pptx
1-1 lecture absorption...#.pptx1-1 lecture absorption...#.pptx
1-1 lecture absorption...#.pptx
FarahTalib4
 

Similar to distillation design.pdf (20)

Distillation Column Design.pdf
Distillation  Column Design.pdfDistillation  Column Design.pdf
Distillation Column Design.pdf
 
McCabe Thiele graphical design method .ppt
McCabe Thiele graphical design method .pptMcCabe Thiele graphical design method .ppt
McCabe Thiele graphical design method .ppt
 
distillation
distillationdistillation
distillation
 
Assignment 1
Assignment 1Assignment 1
Assignment 1
 
Dc lab 5
Dc lab 5Dc lab 5
Dc lab 5
 
Chapter_4_distillation.pptx
Chapter_4_distillation.pptxChapter_4_distillation.pptx
Chapter_4_distillation.pptx
 
Microsoft PowerPoint - Ch90279.PDF
Microsoft PowerPoint - Ch90279.PDFMicrosoft PowerPoint - Ch90279.PDF
Microsoft PowerPoint - Ch90279.PDF
 
L09-Separations and Column Simulation.pptx
L09-Separations and Column Simulation.pptxL09-Separations and Column Simulation.pptx
L09-Separations and Column Simulation.pptx
 
gas absorption
gas absorptiongas absorption
gas absorption
 
10 synthesis of reaction separation system lec 10 homogenous separation
10 synthesis of reaction separation system lec 10 homogenous separation10 synthesis of reaction separation system lec 10 homogenous separation
10 synthesis of reaction separation system lec 10 homogenous separation
 
Combustion tutorial ( Eddy Break up Model) , CFD
Combustion tutorial ( Eddy Break up Model) , CFDCombustion tutorial ( Eddy Break up Model) , CFD
Combustion tutorial ( Eddy Break up Model) , CFD
 
Chapter-8-Production-of-Power.pptx
Chapter-8-Production-of-Power.pptxChapter-8-Production-of-Power.pptx
Chapter-8-Production-of-Power.pptx
 
4 modeling and control of distillation column in a petroleum process
4 modeling and control of distillation column in a petroleum process4 modeling and control of distillation column in a petroleum process
4 modeling and control of distillation column in a petroleum process
 
Section 4 multistage separation processes
Section 4   multistage separation processesSection 4   multistage separation processes
Section 4 multistage separation processes
 
Flash distillation
Flash distillationFlash distillation
Flash distillation
 
Microsoft PowerPoint - Ch91092.PDF
Microsoft PowerPoint - Ch91092.PDFMicrosoft PowerPoint - Ch91092.PDF
Microsoft PowerPoint - Ch91092.PDF
 
Continuous Rectification
Continuous RectificationContinuous Rectification
Continuous Rectification
 
Batch distillation employing cyclic rectification and stripping operations
Batch distillation employing cyclic rectification and stripping operationsBatch distillation employing cyclic rectification and stripping operations
Batch distillation employing cyclic rectification and stripping operations
 
1-1 lecture absorption...#.pptx
1-1 lecture absorption...#.pptx1-1 lecture absorption...#.pptx
1-1 lecture absorption...#.pptx
 
1-1 lecture absorption...#.pptx
1-1 lecture absorption...#.pptx1-1 lecture absorption...#.pptx
1-1 lecture absorption...#.pptx
 

Recently uploaded

DEEP LEARNING FOR SMART GRID INTRUSION DETECTION: A HYBRID CNN-LSTM-BASED MODEL
DEEP LEARNING FOR SMART GRID INTRUSION DETECTION: A HYBRID CNN-LSTM-BASED MODELDEEP LEARNING FOR SMART GRID INTRUSION DETECTION: A HYBRID CNN-LSTM-BASED MODEL
DEEP LEARNING FOR SMART GRID INTRUSION DETECTION: A HYBRID CNN-LSTM-BASED MODEL
gerogepatton
 
basic-wireline-operations-course-mahmoud-f-radwan.pdf
basic-wireline-operations-course-mahmoud-f-radwan.pdfbasic-wireline-operations-course-mahmoud-f-radwan.pdf
basic-wireline-operations-course-mahmoud-f-radwan.pdf
NidhalKahouli2
 
A review on techniques and modelling methodologies used for checking electrom...
A review on techniques and modelling methodologies used for checking electrom...A review on techniques and modelling methodologies used for checking electrom...
A review on techniques and modelling methodologies used for checking electrom...
nooriasukmaningtyas
 
Heat Resistant Concrete Presentation ppt
Heat Resistant Concrete Presentation pptHeat Resistant Concrete Presentation ppt
Heat Resistant Concrete Presentation ppt
mamunhossenbd75
 
digital fundamental by Thomas L.floydl.pdf
digital fundamental by Thomas L.floydl.pdfdigital fundamental by Thomas L.floydl.pdf
digital fundamental by Thomas L.floydl.pdf
drwaing
 
Exception Handling notes in java exception
Exception Handling notes in java exceptionException Handling notes in java exception
Exception Handling notes in java exception
Ratnakar Mikkili
 
Understanding Inductive Bias in Machine Learning
Understanding Inductive Bias in Machine LearningUnderstanding Inductive Bias in Machine Learning
Understanding Inductive Bias in Machine Learning
SUTEJAS
 
bank management system in java and mysql report1.pdf
bank management system in java and mysql report1.pdfbank management system in java and mysql report1.pdf
bank management system in java and mysql report1.pdf
Divyam548318
 
Iron and Steel Technology Roadmap - Towards more sustainable steelmaking.pdf
Iron and Steel Technology Roadmap - Towards more sustainable steelmaking.pdfIron and Steel Technology Roadmap - Towards more sustainable steelmaking.pdf
Iron and Steel Technology Roadmap - Towards more sustainable steelmaking.pdf
RadiNasr
 
PPT on GRP pipes manufacturing and testing
PPT on GRP pipes manufacturing and testingPPT on GRP pipes manufacturing and testing
PPT on GRP pipes manufacturing and testing
anoopmanoharan2
 
Generative AI leverages algorithms to create various forms of content
Generative AI leverages algorithms to create various forms of contentGenerative AI leverages algorithms to create various forms of content
Generative AI leverages algorithms to create various forms of content
Hitesh Mohapatra
 
Harnessing WebAssembly for Real-time Stateless Streaming Pipelines
Harnessing WebAssembly for Real-time Stateless Streaming PipelinesHarnessing WebAssembly for Real-time Stateless Streaming Pipelines
Harnessing WebAssembly for Real-time Stateless Streaming Pipelines
Christina Lin
 
Advanced control scheme of doubly fed induction generator for wind turbine us...
Advanced control scheme of doubly fed induction generator for wind turbine us...Advanced control scheme of doubly fed induction generator for wind turbine us...
Advanced control scheme of doubly fed induction generator for wind turbine us...
IJECEIAES
 
Recycled Concrete Aggregate in Construction Part III
Recycled Concrete Aggregate in Construction Part IIIRecycled Concrete Aggregate in Construction Part III
Recycled Concrete Aggregate in Construction Part III
Aditya Rajan Patra
 
哪里办理(csu毕业证书)查尔斯特大学毕业证硕士学历原版一模一样
哪里办理(csu毕业证书)查尔斯特大学毕业证硕士学历原版一模一样哪里办理(csu毕业证书)查尔斯特大学毕业证硕士学历原版一模一样
哪里办理(csu毕业证书)查尔斯特大学毕业证硕士学历原版一模一样
insn4465
 
ML Based Model for NIDS MSc Updated Presentation.v2.pptx
ML Based Model for NIDS MSc Updated Presentation.v2.pptxML Based Model for NIDS MSc Updated Presentation.v2.pptx
ML Based Model for NIDS MSc Updated Presentation.v2.pptx
JamalHussainArman
 
New techniques for characterising damage in rock slopes.pdf
New techniques for characterising damage in rock slopes.pdfNew techniques for characterising damage in rock slopes.pdf
New techniques for characterising damage in rock slopes.pdf
wisnuprabawa3
 
International Conference on NLP, Artificial Intelligence, Machine Learning an...
International Conference on NLP, Artificial Intelligence, Machine Learning an...International Conference on NLP, Artificial Intelligence, Machine Learning an...
International Conference on NLP, Artificial Intelligence, Machine Learning an...
gerogepatton
 
Wearable antenna for antenna applications
Wearable antenna for antenna applicationsWearable antenna for antenna applications
Wearable antenna for antenna applications
Madhumitha Jayaram
 
KuberTENes Birthday Bash Guadalajara - K8sGPT first impressions
KuberTENes Birthday Bash Guadalajara - K8sGPT first impressionsKuberTENes Birthday Bash Guadalajara - K8sGPT first impressions
KuberTENes Birthday Bash Guadalajara - K8sGPT first impressions
Victor Morales
 

Recently uploaded (20)

DEEP LEARNING FOR SMART GRID INTRUSION DETECTION: A HYBRID CNN-LSTM-BASED MODEL
DEEP LEARNING FOR SMART GRID INTRUSION DETECTION: A HYBRID CNN-LSTM-BASED MODELDEEP LEARNING FOR SMART GRID INTRUSION DETECTION: A HYBRID CNN-LSTM-BASED MODEL
DEEP LEARNING FOR SMART GRID INTRUSION DETECTION: A HYBRID CNN-LSTM-BASED MODEL
 
basic-wireline-operations-course-mahmoud-f-radwan.pdf
basic-wireline-operations-course-mahmoud-f-radwan.pdfbasic-wireline-operations-course-mahmoud-f-radwan.pdf
basic-wireline-operations-course-mahmoud-f-radwan.pdf
 
A review on techniques and modelling methodologies used for checking electrom...
A review on techniques and modelling methodologies used for checking electrom...A review on techniques and modelling methodologies used for checking electrom...
A review on techniques and modelling methodologies used for checking electrom...
 
Heat Resistant Concrete Presentation ppt
Heat Resistant Concrete Presentation pptHeat Resistant Concrete Presentation ppt
Heat Resistant Concrete Presentation ppt
 
digital fundamental by Thomas L.floydl.pdf
digital fundamental by Thomas L.floydl.pdfdigital fundamental by Thomas L.floydl.pdf
digital fundamental by Thomas L.floydl.pdf
 
Exception Handling notes in java exception
Exception Handling notes in java exceptionException Handling notes in java exception
Exception Handling notes in java exception
 
Understanding Inductive Bias in Machine Learning
Understanding Inductive Bias in Machine LearningUnderstanding Inductive Bias in Machine Learning
Understanding Inductive Bias in Machine Learning
 
bank management system in java and mysql report1.pdf
bank management system in java and mysql report1.pdfbank management system in java and mysql report1.pdf
bank management system in java and mysql report1.pdf
 
Iron and Steel Technology Roadmap - Towards more sustainable steelmaking.pdf
Iron and Steel Technology Roadmap - Towards more sustainable steelmaking.pdfIron and Steel Technology Roadmap - Towards more sustainable steelmaking.pdf
Iron and Steel Technology Roadmap - Towards more sustainable steelmaking.pdf
 
PPT on GRP pipes manufacturing and testing
PPT on GRP pipes manufacturing and testingPPT on GRP pipes manufacturing and testing
PPT on GRP pipes manufacturing and testing
 
Generative AI leverages algorithms to create various forms of content
Generative AI leverages algorithms to create various forms of contentGenerative AI leverages algorithms to create various forms of content
Generative AI leverages algorithms to create various forms of content
 
Harnessing WebAssembly for Real-time Stateless Streaming Pipelines
Harnessing WebAssembly for Real-time Stateless Streaming PipelinesHarnessing WebAssembly for Real-time Stateless Streaming Pipelines
Harnessing WebAssembly for Real-time Stateless Streaming Pipelines
 
Advanced control scheme of doubly fed induction generator for wind turbine us...
Advanced control scheme of doubly fed induction generator for wind turbine us...Advanced control scheme of doubly fed induction generator for wind turbine us...
Advanced control scheme of doubly fed induction generator for wind turbine us...
 
Recycled Concrete Aggregate in Construction Part III
Recycled Concrete Aggregate in Construction Part IIIRecycled Concrete Aggregate in Construction Part III
Recycled Concrete Aggregate in Construction Part III
 
哪里办理(csu毕业证书)查尔斯特大学毕业证硕士学历原版一模一样
哪里办理(csu毕业证书)查尔斯特大学毕业证硕士学历原版一模一样哪里办理(csu毕业证书)查尔斯特大学毕业证硕士学历原版一模一样
哪里办理(csu毕业证书)查尔斯特大学毕业证硕士学历原版一模一样
 
ML Based Model for NIDS MSc Updated Presentation.v2.pptx
ML Based Model for NIDS MSc Updated Presentation.v2.pptxML Based Model for NIDS MSc Updated Presentation.v2.pptx
ML Based Model for NIDS MSc Updated Presentation.v2.pptx
 
New techniques for characterising damage in rock slopes.pdf
New techniques for characterising damage in rock slopes.pdfNew techniques for characterising damage in rock slopes.pdf
New techniques for characterising damage in rock slopes.pdf
 
International Conference on NLP, Artificial Intelligence, Machine Learning an...
International Conference on NLP, Artificial Intelligence, Machine Learning an...International Conference on NLP, Artificial Intelligence, Machine Learning an...
International Conference on NLP, Artificial Intelligence, Machine Learning an...
 
Wearable antenna for antenna applications
Wearable antenna for antenna applicationsWearable antenna for antenna applications
Wearable antenna for antenna applications
 
KuberTENes Birthday Bash Guadalajara - K8sGPT first impressions
KuberTENes Birthday Bash Guadalajara - K8sGPT first impressionsKuberTENes Birthday Bash Guadalajara - K8sGPT first impressions
KuberTENes Birthday Bash Guadalajara - K8sGPT first impressions
 

distillation design.pdf

  • 1. Distillation Senior Design CHE 396 Andreas Linninger Innovative Solutions Michael Redel Alycia Novoa Tanya Goldina Michelle Englert
  • 2. CHE-396 Senior Design (Distillation) 2 Table of Contents Introduction 3 Flowsheet 4 Limitations 5 Applicability 6 Theory 7 Case Study___________________________________________________24 Alternatives 288 References 309
  • 3. CHE-396 Senior Design (Distillation) 3 Introduction This report examines the distillation process. This will enable the reader to understand the necessary components along with distillation calculations. Distillation is a process that separates two or more components into an overhead distillate and bottoms. The bottoms product is almost exclusively liquid, while the distillate may be liquid or a vapor or both. The separation process requires three things. First, a second phase must be formed so that both liquid and vapor phases are present and can contact each other on each stage within a separation column. Secondly, the components have different volatilities so that they will partition between the two phases to different extent. Lastly, the two phases can be separated by gravity or other mechanical means. Distillation differs from absorption and stripping in that the second phase is created by thermal means (Seader, 1998).
  • 4. CHE-396 Senior Design (Distillation) 4 Flowsheet The distillation column contains one feed stream and two product streams. The feed contains a mole percent of the light component, ZF. The product stream exiting the top has a composition of XD of the light component. The product stream leaving the bottom contains a composition of Xb of the light component. The column is broken in two sections. The top section is referred to as the rectifying section. The bottom section is known as the stripping section. The top product stream passes through a total condenser. This effectively condenses all of the vapor distillate to liquid. The bottom product stream uses a partial reboiler. This allows for the input of energy into our column.
  • 5. CHE-396 Senior Design (Distillation) 5 Limitations • Azeotropes: An azeotrope is a liquid mixture which when vaporized produces the same composition as the liquid. If the mixture is azeotropic, then more advanced types of separation must be considered. More information on azeotropes maybe found in Douglas, Section 7.3. • Solids: If the material to be separated is high in solids, or contains tars or resins that could plug or foul a continuous unit, then a batch separation should be considered (Perry’ s, 1997). • Optimum Pressure (King, 1980): 1. Vacuum operation: Use of a vacuum should be considered for heat- sensitive compounds or polymerizable materials. Vacuum is usually not used unless required, e.g., a low bottoms temperature is needed to avoid thermal decomposition. 2. Distillation column is above atmospheric pressure: Column shell should be thicker to withstand pressure of the column. 3. If the column pressure required to accomplish overhead condensation with cooling water is less than 250 lb/in 2 , then the column pressure should give an average temperature driving force of 5-15*C in the overhead condenser. 4. If the column pressure required accomplishing overhead condensation with cooling water is greater than 250 lb/in2 , then consider an alternative of using a refrigerant on the overhead and running the column at a lower pressure.
  • 6. CHE-396 Senior Design (Distillation) 6 • Optimum Temperature Differences in Reboilers and Condensers (King, 1980): 1. Reboiler temperatures should be kept low enough to avoid bottoms degradation and/or fouling. 2. Common temperature differences used for heat exchange across reboilers and condensers are shown in the following table: Temp, K Condenser: Refrigeration 3-10 Cooling Water 6-20 Pressurized Fluid 10-20 Boiling Water 20-40 Air 20-50 Reboiler: Process Fluid 10-20 Steam 10-60 Hot Oil 20-60 Applicability • Distillation is the least expensive means of separating mixtures of liquids. • If relative volatilities of components is less than 1.1, distillation becomes very expensive (Douglas, 1988) and extraction or reactive distillation should be considered.
  • 7. CHE-396 Senior Design (Distillation) 7 Theory Section 1. Graphical Determination of a Distillation Column Design Step 1. Determine Process Operation Variables • Assumed feed rate, composition, purity of distillate and bottoms, and the quality of the feed are known. • Perform overall material and component balances to determine the compositions of the distillate and bottoms. F*ZF=XD*D+XB*B (1) F=D+B (2) where F Feed rate of input stream ZF Composition of light component in feed XD *Mole Fraction of light in distillate XB *Mole Fraction of light in Bottom D Total distillate amount B Total bottom amount *If more than two components, these values are the light-key and heavy-key component. Step 2. Determine the Minimum Reflux Ratio This graphical approach is determined using the McCabe-Thiele Method for binary mixtures. The ratio of reflux flow to distillate flow is called the reflux ratio.
  • 8. CHE-396 Senior Design (Distillation) 8 Assumptions The following assumptions are implied when using this method (McCabe, 1993): a. Constant Molal Overflow. The molar flow rates of the vapor and liquid are nearly constant in each section of the column. This also ensures the operating lines are straight lines. b. Heat Effects are negligible. For example, heat losses to and from the column are small and neglected. c. For every mole of vapor condensed, another mole of liquid is vaporized. d. The liquid and vapor leaving the tray is in equilibrium with the vapor and liquid entering the tray. Procedure If an equilibrium curve is not given, draw a y-x diagram (y representing the vapor phase and x the liquid). The equilibrium curve can be obtained by relating the relative volatility to the composition of the liquid: y = α*x/(1+x(α-1)) (4) This shows the bubble-point and dew point of a binary mixture at constant pressure. An equilibrium line describes the compositions of the liquid and vapor in equilibrium at a fixed pressure. The equilibrium line crossing the forty-five degree line is an indication of an azeotropic mixture. An azeotrope is a liquid mixture which when vaporized produces the same composition as the liquid. If the mixture is azeotropic, then more advanced types of separation must be considered.
  • 9. CHE-396 Senior Design (Distillation) 9 • Forty Five Degree Line 1. Draw the diagonal line connecting the points (0.0,0.0) to (1.0,1.0). This is your forty-five degree line. • Feed Line (q-Line) 2. The feed line can be constructed by locating the point on the forty- five degree line that corresponds to the feed composition. This point can be extended with a slope ofq/(q-1) where q is the feed quality. The feed line can be directly plotted through the following equation: y=q/(q-1)X - ZF/(q-1) (5) • Upper Operating Line 3. Draw the operating line for the enriching section. First find the desired top product composition (on the x-axis) and locate the corresponding point on the forty-five degree line. Connect this point to the point where the equilibrium cure and the feed line
  • 10. CHE-396 Senior Design (Distillation) 10 intersect. This is the upper operating line. The y intercept of this line is equal toXD/(R+1). The following equation can be used to determine the minimum reflux: Rmin=(XD/yintercept ) – 1 (6) • Lower Operating Line 4. Draw the operating line for the stripping section. First find the desired bottom product composition (on the x-axis) and locate the corresponding point on the forty-five degree line. Draw a line from this point to the intersection of the equilibrium curve and the feed line. This is your lower operating line. The slope of this line is equal to (Vbmin+1)/Vbmin where Vb is the boilup ratio. The boilup ratio is the fractional amount of liquid that is boiled back into the column to the amount of liquid leaving. Step 3. Choose Actual Reflux Ratio: As the reflux ratio increases, the number of trays and thus the capital cost of the column decreases. However, as a trade-off, an increase in reflux ratio will also increase the vapor rate within the tower, thus increasing expenses such as condensers and reboilers (4). Most columns are designed to operate between 1.2 and 1.5 times the minimum reflux ratio because this is approximately the region of minimum operating cost. Therefore, based on first estimates, the operating reflux ratio is equated so that (Douglas, 1988): Ractual =Rmin* 1.2 (7)
  • 11. CHE-396 Senior Design (Distillation) 11 Step 4. Determine the Minimum Number of Trays • Upper/Lower Operating Line at Actual Reflux 1. Redraw the upper and lower operating line using the actual reflux ratio. Plot the point XD/(R+1) and draw a line to the XD. The equation of the upper operating line is: y=(R/R+1)*X+XD/(R+1) (8) The equation for the lower operating line can be drawn by connecting the X B to the intersection of the feed line and the upper operating line. The equation of the lower operating line is: y=((VB+1)/VB)*X+XB/VB (9) • Determine Number of Trays 2. Starting from composition of the distillate, a horizontal line is drawn to the equilibrium curve. This line demonstrates the first tray. 3. From the previous intersection, drop vertically until the upper operating line is obtained. Follow step two to determine next tray.
  • 12. CHE-396 Senior Design (Distillation) 12 4. Continue stepping until the liquid composition ends equals the desired bottom composition. 5. The total number of steps is equal to the theoretical number of trays. 6. When high conversions are desired, the stepping method may cause difficulties. In these cases the Kremser equation should be used. (10) where N Number of trays in unreadable region m Slope of the line in unreadable region V/L R/(R+1) yin Conveniently chosen point below unreadable region yout XD for rectifying section ye,out m*XD+b (where b is the y intercept of new equil. line) ( ) ( )             + − −       − = L V m ln L V m y y y y * L V m 1 ln N out , e out out , e in
  • 13. CHE-396 Senior Design (Distillation) 13 Step 5. Determine Actual Number of Trays This is determined by taking the quotient of the number of theoretical trays to the tray efficiency. Typical values for tray efficiency range from 0.5 to 0.7 (Douglas, 1988). These values depend on the type of trays being used, as well as the internal liquid and vapor flow rates. Nactual = Ntheory /ε (11) Step 6. Principal Dimensions of the Column (Diameter/Height): • A design guideline that should be used is that the height of the column should not be higher than 175 feet. • Height-to-diameter ratio should be less than 20 to 30. • Packed towers are used when the column has a small diameter (1.5 ft or less) or area (1.77 ft2 or less) rather than plate towers. • Either plate or packed towers may be used when the column diameter is between 1.5-4.5 ft (or area, 1.77- 15.9 ft2 ). • If the tower is higher than 190 ft, then a design with smaller tray spacing should be considered (Douglas, 1988). The tower height can be related to the number of trays in the column. The following formula assumes that a spacing of two feet between trays will be sufficient including additional five to ten feet at both ends of the tower. This includes a fifteen percent excess allowance of space (Douglas, 1988). Htower = 2.3 Nactual (12)
  • 14. CHE-396 Senior Design (Distillation) 14 Before we can determine the tower diameter, we need to determine the vapor velocity. The vapor velocity can be derived from the flooding velocity. To limit our column from flooding, we choose a velocity 50-80 percent of flooding velocity (Douglas, 1988): (13) where V Vapor Velocity ρG Density of the mixture The diameter of the tower is relatively insensitive to changes in operating temperature or pressure. The main determinant of the diameter is the vapor velocity. The desired vapor velocity is dependent on the limitations of undesired column flooding. (14) where DT Diameter of tower V Vapor velocity MG Molecular weight of gas ρm Molar density G 2 . 1 V ρ = 25 . 0 m G T M * V 0164 . D         ρ =
  • 15. CHE-396 Senior Design (Distillation) 15 Section 2. Analytically Determining the Specifications for a Distillation Column Step 1. Determine Process Operation Variables • Assumed feed rate, composition, purity of distillate and bottoms, and the quality of the feed are known. • Perform overall material and component balances to determine the compositions of the distillate and bottoms. Step 2. Determine the Minimum Reflux Ratio • Underwood Equation The Underwood equation approximates the minimum reflux ratio (Douglas, 1988). The following equation can be used for multi-component systems with constant relative volatility. Relating mass balances and VLE equations, the following equation was derived for whichφcan be calculated. F*(1-q)= ∑ ((αi * zi)/ (αi -φ )) (15) where F Feed q Feed quality αi Relative Volatility zi Composition of component (i) in Feed Through the previous expression, φcan be obtained in a polynomial expression. This expression can be used to solve forφ . Only the φthat falls between the relative volatilities of the components should be considered. Theφcan be used to obtain the minimum amount of vapor (Vmin): Vmin = ∑ (αi * Dxi)/ (αi -φ )) (16)
  • 16. CHE-396 Senior Design (Distillation) 16 From a mass balance and the definition of reflux: Lmin = Vmin – D Rmin = Vmin / D (17) Step 3. Choose Theoretical Reflux Ratio As the reflux ratio increases, the number of trays and thus the capital cost of the column decreases. However, as a trade-off, an increase in reflux ratio will also increase the vapor rate within the tower, thus increasing expenses such as condensers and reboilers (Douglas, 1988). Most columns are designed to operate between 1.2 and 1.5 times the minimum reflux ratio because this is approximately the region of minimum operating cost. Therefore, based on first estimates, the operating reflux ratio for the analytically method is equated so that (Douglas, 1988): RTheor = 1.2 *Rmin (18)
  • 17. CHE-396 Senior Design (Distillation) 17 Step 4. Determine Theoretical Number of Trays • Modification of the Fenske Equation A simplified approximate equation can be used to determine the number of trays (Douglas, 1988). This is an expression for the minimum number of trays, assuming total reflux and constant relative volatility. This equation takes into account the reflux ratio. (19) where (20) β Fractional recovery of light in the distillate δ Fractional recovery of light in the bottom α Relative volatility R Reflux ratio ZF Mole ratio of light component in feed                   + α = F Z * R 1 1 ln SF ln N ( ) ( ) ( ) β − δ − δ β = 1 * 1 * SF
  • 18. CHE-396 Senior Design (Distillation) 18 Step 5. Determine Actual Number of Trays: This is determined by taking the quotient of the number of theoretical trays to the tray efficiency. Typical values for tray efficiency range from 0.5 to 0.7 (Douglas, 1988). These values depend on the type of trays being used, as well as the internal liquid and vapor flow rates. Nactual = N/ε (21) Step 6. Principal Dimensions of the Column (Diameter/Height): • A design guideline that should be used is that the height of the column should not be higher than 175 feet. • Height-to-diameter ratio should be less than 20 to 30. • Packed towers are used when the column has a small diameter (1.5 ft or less) or area (1.77 ft2 or less) rather than plate towers. • Either plate or packed towers may be used when the column diameter is between 1.5-4.5 ft (or area, 1.77-15.9 ft2 ). • If the tower is higher than 190 ft, then a design with smaller tray spacing should be considered (Douglas, 1988). • Height of Column The tower height can be related to the number of trays in the column. The following formula assumes that a spacing of two feet between trays will be sufficient including additional five to ten feet at both ends of the tower. This includes a fifteen percent excess allowance of space (Douglas, 1988). Htower = 2.3 Nactual [ft] (22)
  • 19. CHE-396 Senior Design (Distillation) 19 • Vapor Velocity Before we can determine the tower diameter, we need to determine the vapor velocity. The vapor velocity can be derived from the flooding velocity. To limit our column from flooding, we chose a velocity 60 percent of flooding velocity (Douglas, 1988). This is assumed in the following equation: (23) where V Vapor Velocity ρG Density of the Gas • Diameter of Tower The diameter of a tower is relatively insensitive to changes in operating temperature or pressure. The main determinant of the diameter is the vapor velocity. The desired vapor velocity is dependent on the limitations of undesired column flooding. This equation allows for a twelve percent surplus in area (Douglas, 1998). DT = .0164√(V) * (MG/ ρm )^.25 (24) where V Vapor Velocity MG ρm Molar density G 2 . 1 V ρ =
  • 20. CHE-396 Senior Design (Distillation) 20 Section 3. Determining the Cost of Column and Components All cost estimates formulas were taken from (Douglas, 1988). Step 1. Cost of Column • Capital Cost The following approximates installed cost and purchased cost for the shell and trays. This cost relates the diameter, height, and design variables of the column. The design variable is a correction used to allow specificity of the column pressure and material. (25) where Cc Cost of shell and trays Fc Design considerations for the column DT Diameter of column H Height of column Step 2. Cost of the Reboiler • Capital Cost The installed cost of the reboiler heat exchanger is: (26) where Cr Cost of reboiler ∆Hv Heat of vaporization of bottoms V Rate of Boilup ( ) c 8 . 0 T c F 218 * H * D 120 * 280 S & M C +       = 65 . 0 65 . 0 v r V * 11250 H * 328 * 280 S & M C       ∆       =
  • 21. CHE-396 Senior Design (Distillation) 21 • Operating Cost If we use steam to supply the heat for the reboiler, the temperature driving force must be constrained to less than 30-45 F to prevent film boiling. We are also assuming a high value of heat transfer coefficient because the heat transfer between a condensing vapor and boiling liquid is high. The steam required is: (27) (28) where Ws Amount of steam needed Cs Cost of steam ∆Hv Heat of vaporization ∆Hs Heat of saturation V Mass flow rate V * H H W s v s         ∆ ∆ = ( ) V * H * SteamCost * 10 * 74 . 8 C V 3 s ∆ = −
  • 22. CHE-396 Senior Design (Distillation) 22 Step 3. Cost of Condenser • Capital Cost If we assume the cooling water is available at 90 F and a heat transfer coefficient of 100, the heat transfer area of the condenser heat exchanger is: Ac=((∆Hv/3000)⋅ ln (Tb-90/Tb-120))⋅ V (29) where Ac Area of condenser heat exchanger ∆Hv Heat of vaporization Tb Bubble point of distillate V Mass flow rate The installed cost of the heat exchanger for condensing: Cc=(M&S/280)*101.3*(2.29+Fc)*Ac0.65 (30) where Cc Cost of condenser Fc Design considerations correction factor • Operating Cost If we assume the cooling water is available at 90 F and a heat transfer coefficient of 100, the amount of cooling water needed for the condenser and the associated cost is: Wc=(∆Hv/30)V (31) Cc=3.26⋅ 10-4 *(Cooling water cost)(∆Hv)(V) (32) where Wc Amount of cold water to condenser Cc Cost of condenser ∆Hv Heat of vaporization V Mass flow rate
  • 23. CHE-396 Senior Design (Distillation) 23 Step 4. Total Cost of Column The total annualized cost is the sum of capital cost divided by the payback period plus the yearly operating cost. TAC = Capital Cost / Payback Period + Operating Cost (33)
  • 24. CHE-396 Senior Design (Distillation) 24 Section 4. Case Study Feed Stream, Acetone/Acetic Acid F=100mole/hr Light-Key Mole Fraction, ZF=0.30 Percentage of Light in Distillate XD=0.90 Percentage of Light in Bottoms XB=0.10 Quality of Feed Q=1 We can simultaneously solve equations (1) and (2), F*Z F=XD*D+XB*B and F=D+B, to obtain the amount of distillate and bottoms: 100*.3=.9*D+.1*B 100=D+B B=75mole/hr D=25mole/hr The reflux ratio and number of trays were calculated graphically. These graphs can be viewed after this section. The minumum reflux ratio can be calculated through a variation of the Underwood equation. When the quality is equal to one and in a binary mixture, equation (15) reduces to: Rmin =(1/(α-1))*((XD/XF)-α*(1-XD)/(1-XF)) Rmin=(1/(4.36-1))*((.9/.7)-4.36*.1/.3) Rmin=.716
  • 25. CHE-396 Senior Design (Distillation) 25 The theoretical minimum reflux ratio is derived from equation (18), R theory=1.2*Rmin: Rtheory=.859 From the Fenske equation (19) we can determine the number of trays: Nmin=ln(81)/ln(4.36/√(1+1/(.81*.3)) N=5.97 Trays
  • 26. CHE-396 Senior Design (Distillation) 26 The following three graphs show how we obtain approximately the same number of trays graphically, rather than analytically (shown above). Graph A, Acetone- Acetic Acid Equilibrium Data ( ) 1 90 5 . 60 min + = R ( ) 1 int min + = R D x y 4876 . 0 min = R
  • 27. CHE-396 Senior Design (Distillation) 27 Graph B, Acetone- Acetic Acid Equilibrium 5861 . 0 4876 . 0 * 2 . 1 * 2 . 1 min = = = R R 78 . 56 ) 1 5851 . 0 ( 90 int = + = y
  • 28. CHE-396 Senior Design (Distillation) 28 Graph C, Acetone- Acetic Acid Equilibrium Curve. We can see that the number of trays is six. This can be seen from the stepping on the above graph. We note here that the analytical method stated the number of trays to be 5.97, which is close to our graphical method of 6 trays.
  • 29. CHE-396 Senior Design (Distillation) 29 Alternatives • Extraction: A process where one or more solutes are removed from a liquid by transferring the solute(s) into a second liquid phase. Liquids must be immiscible or partially immiscible. Vaporization is not required, thus extraction can be done at low temperatures and is a gentle process suitable for unstable molecules (Wankat, 1988). • Adsorption: Involves the transfer and equilibrium distribution of one or more solutes between a fluid phase and particles. Liquid mixture is brought into contact with a microporous solid allowing adsorption of certain components in the mixture takes place on the internal surface of the solid. The adsorbent (solid) is insoluble in the liquid, and the components being adsorbed are called solutes (Perry’ s, 1997). • Condensation: Occurs when a saturated vapor comes in contact with a surface whose temperature is below the saturation temperature. Film-type condensation occurs when a film layer of condensate is formed on the surface. Dropwise condensation occurs when appears in many small droplets at various points on the surface (Perry’ s, 1997). • Reactive Distillation: Works by adding an entrainer that reacts with one component in a mixture that is difficult to separate if relative volatilities of two components are very close (less than 1.1). In the first column, the entrainer will react with one component to increase the relative volatility so that it may be separated while in a second column, the reaction can be reversed so that the entrainer can be recycled (King, 1980). • Extractive Distillation: This operation requires two distillation columns. A heavy nonvolatile component is added near the top of the tower to modify the activity coefficients between two components. A pure component in the overhead in the first column is obtained while the other component is recovered in the overhead in the second column (King, 1980).
  • 30. CHE-396 Senior Design (Distillation) 30 References 1. Seader, J. and Henley, E. Separation Process Principles. John Wiley & Sons, 1998, Chapters 7 and 8. 2. McCabe, Warren. Unit Operations of Chemical Engineering, Fifth Edition. McGraw-Hill, Inc, 1993, Chapters 18 and 19. 3. Distillation Column Design. Copyright 1997. http://lorien.ncl.ac.uk/ming/distil/distil0.htm 4. Douglas, James. Conceptual Design of Chemical Processes. McGraw-Hill, Inc., 1988, Section A.3. 5. King, C. Judson. Separation Processes, Second Edition. McGraw-Hill, Inc., 1980, Chapters 4-6.