Downloaded 22 times
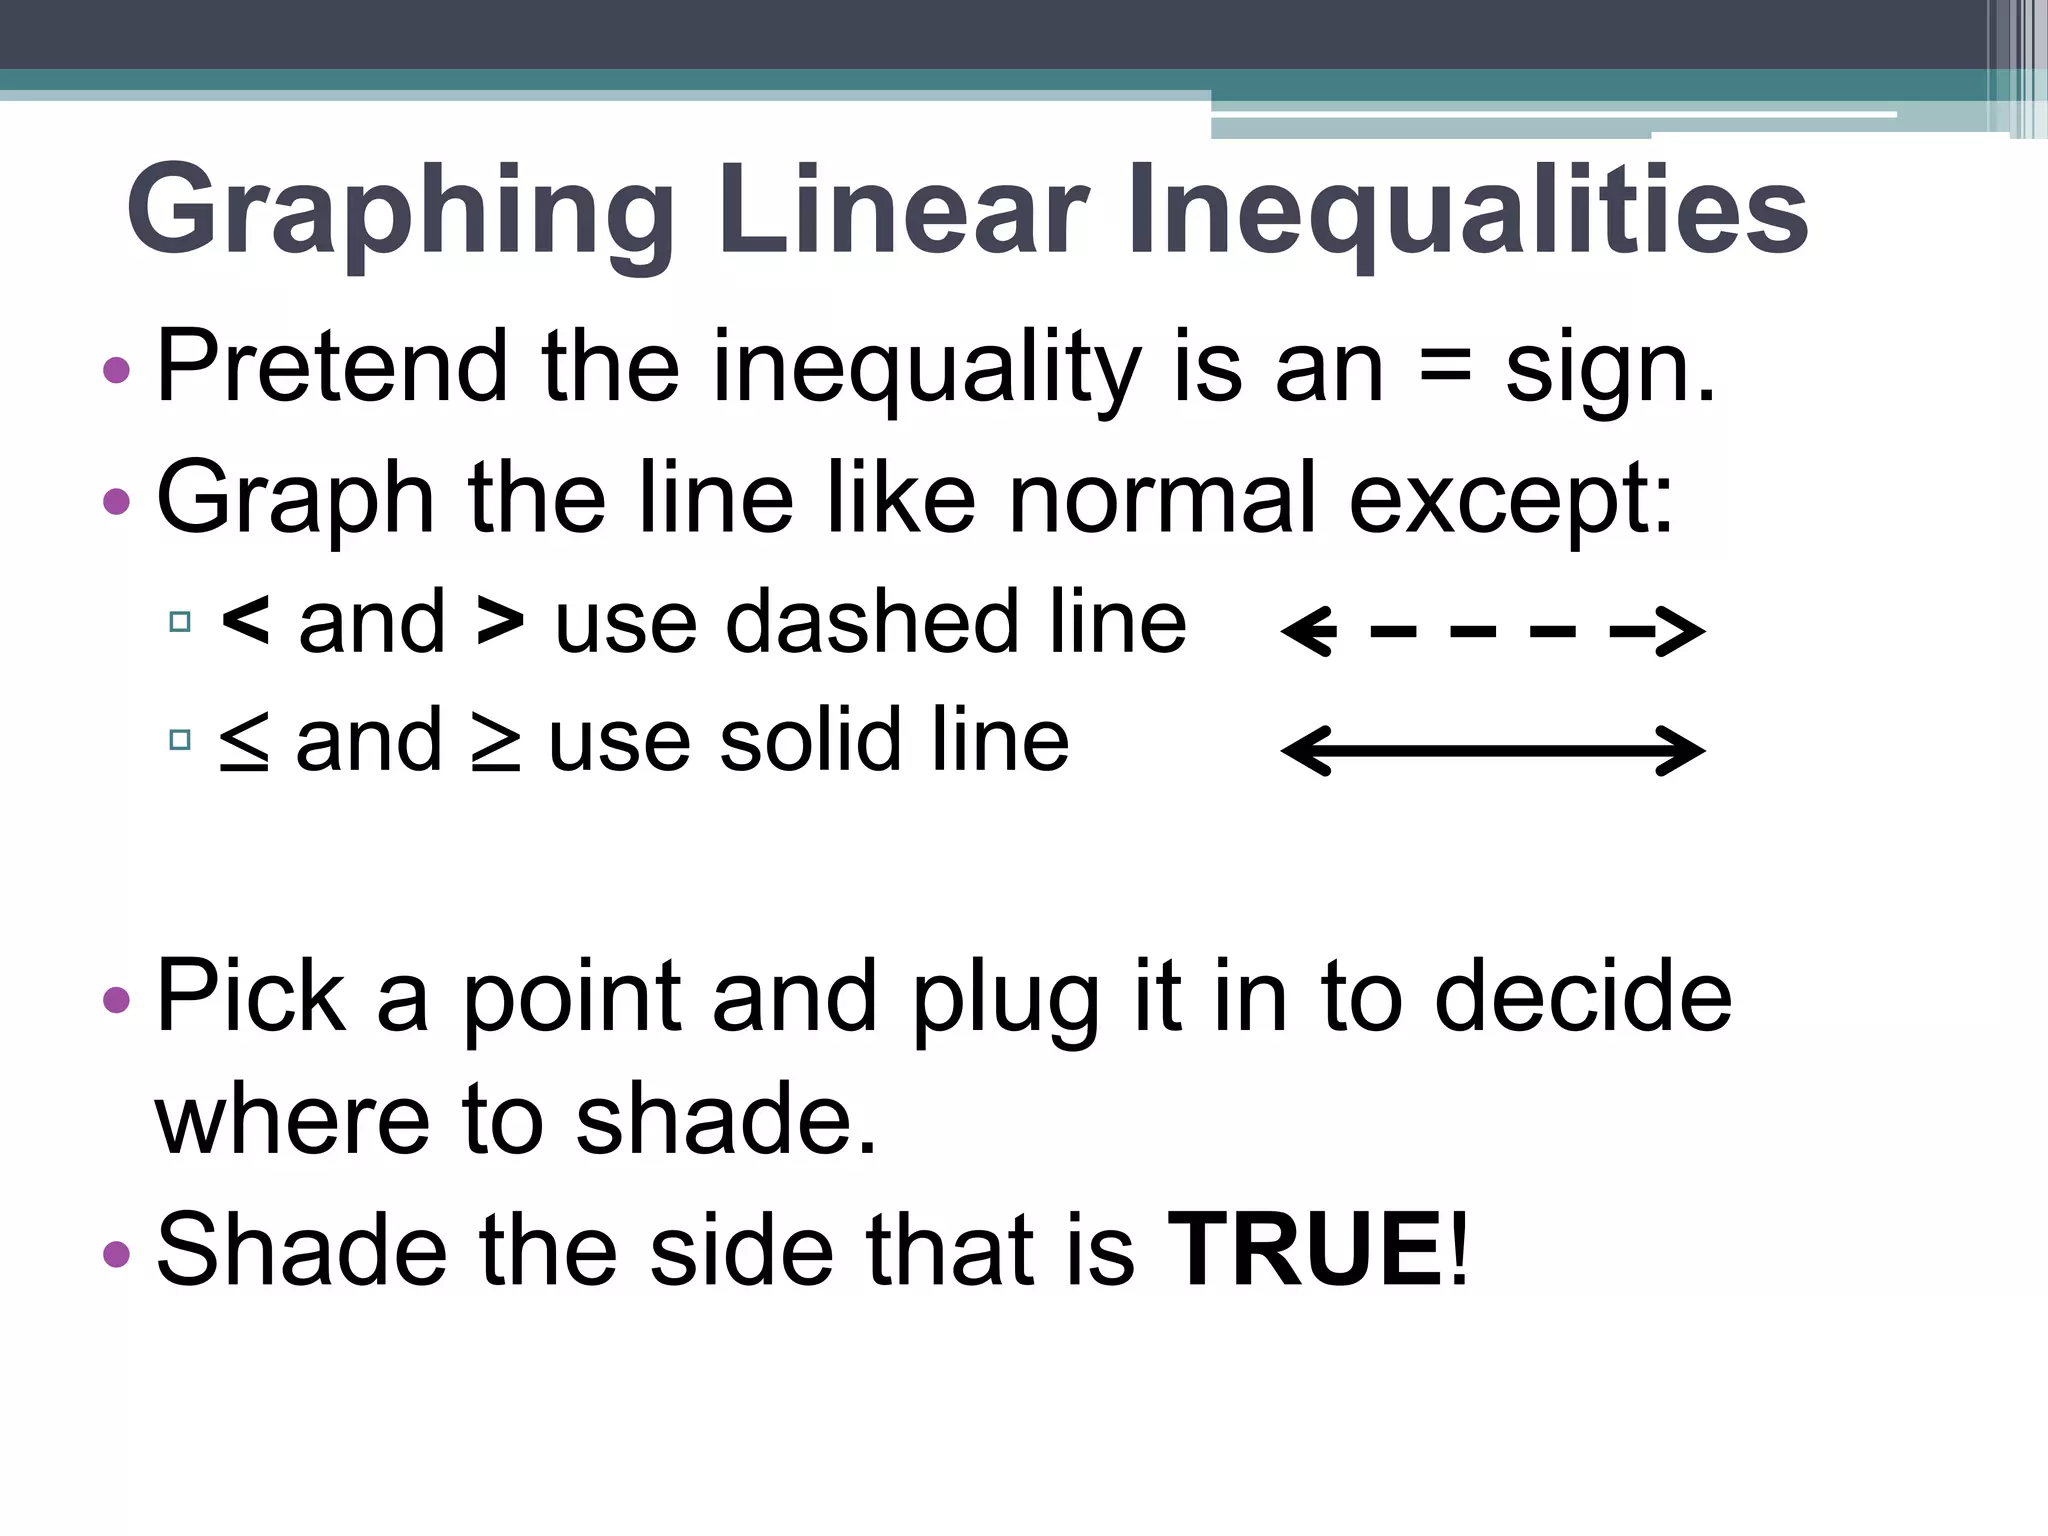
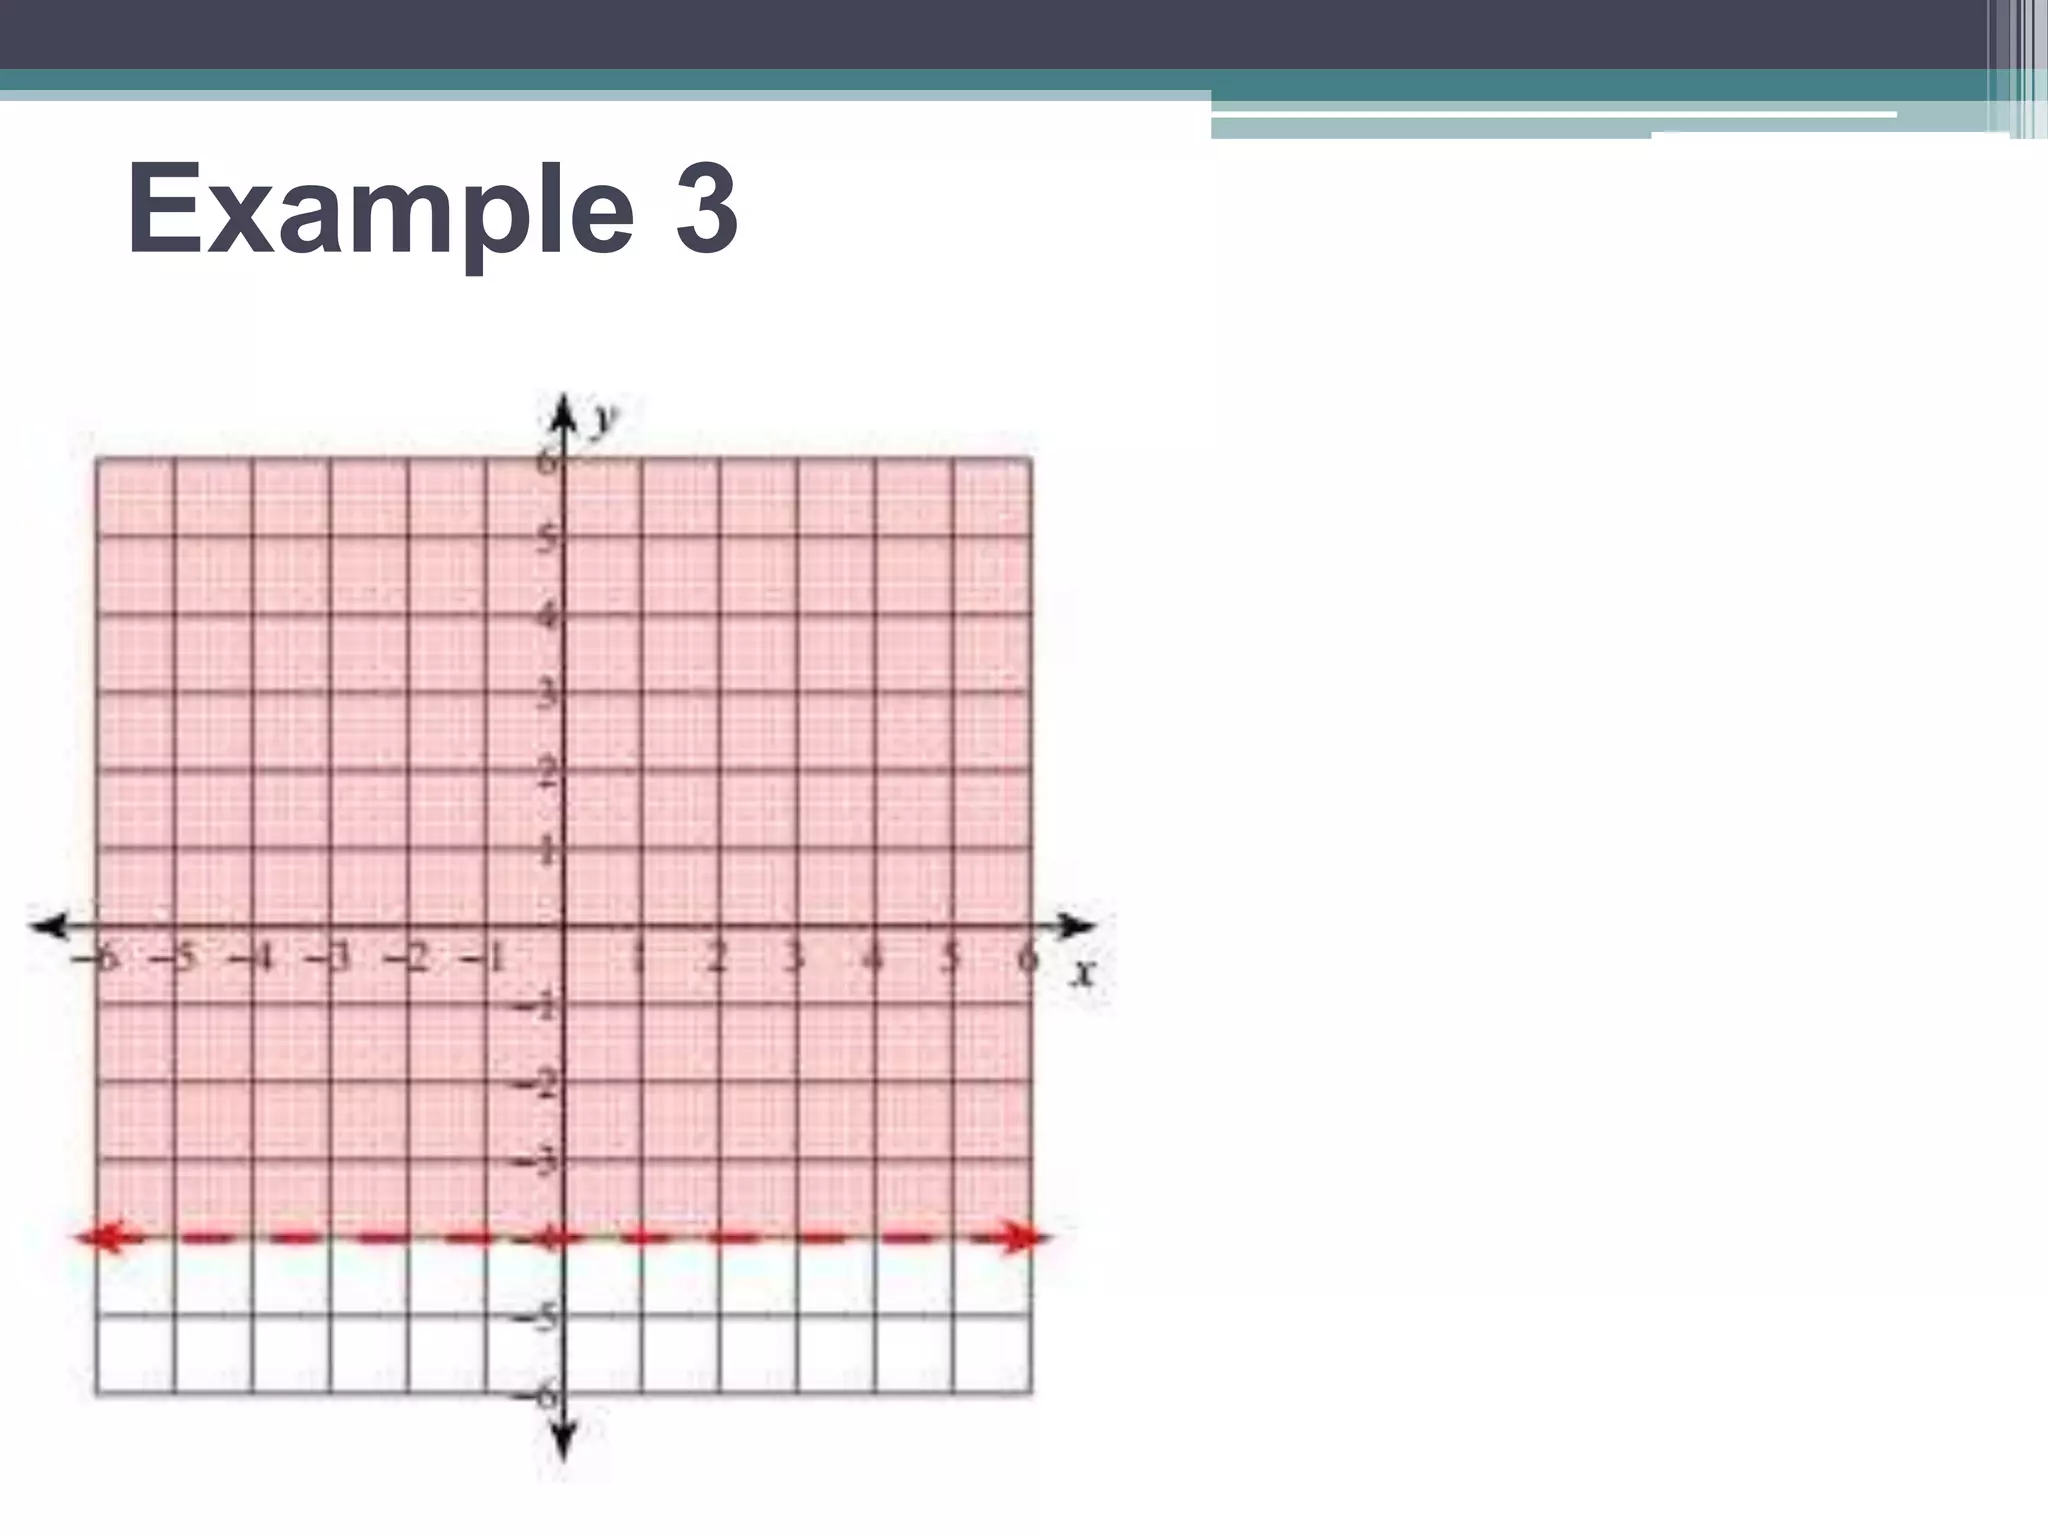
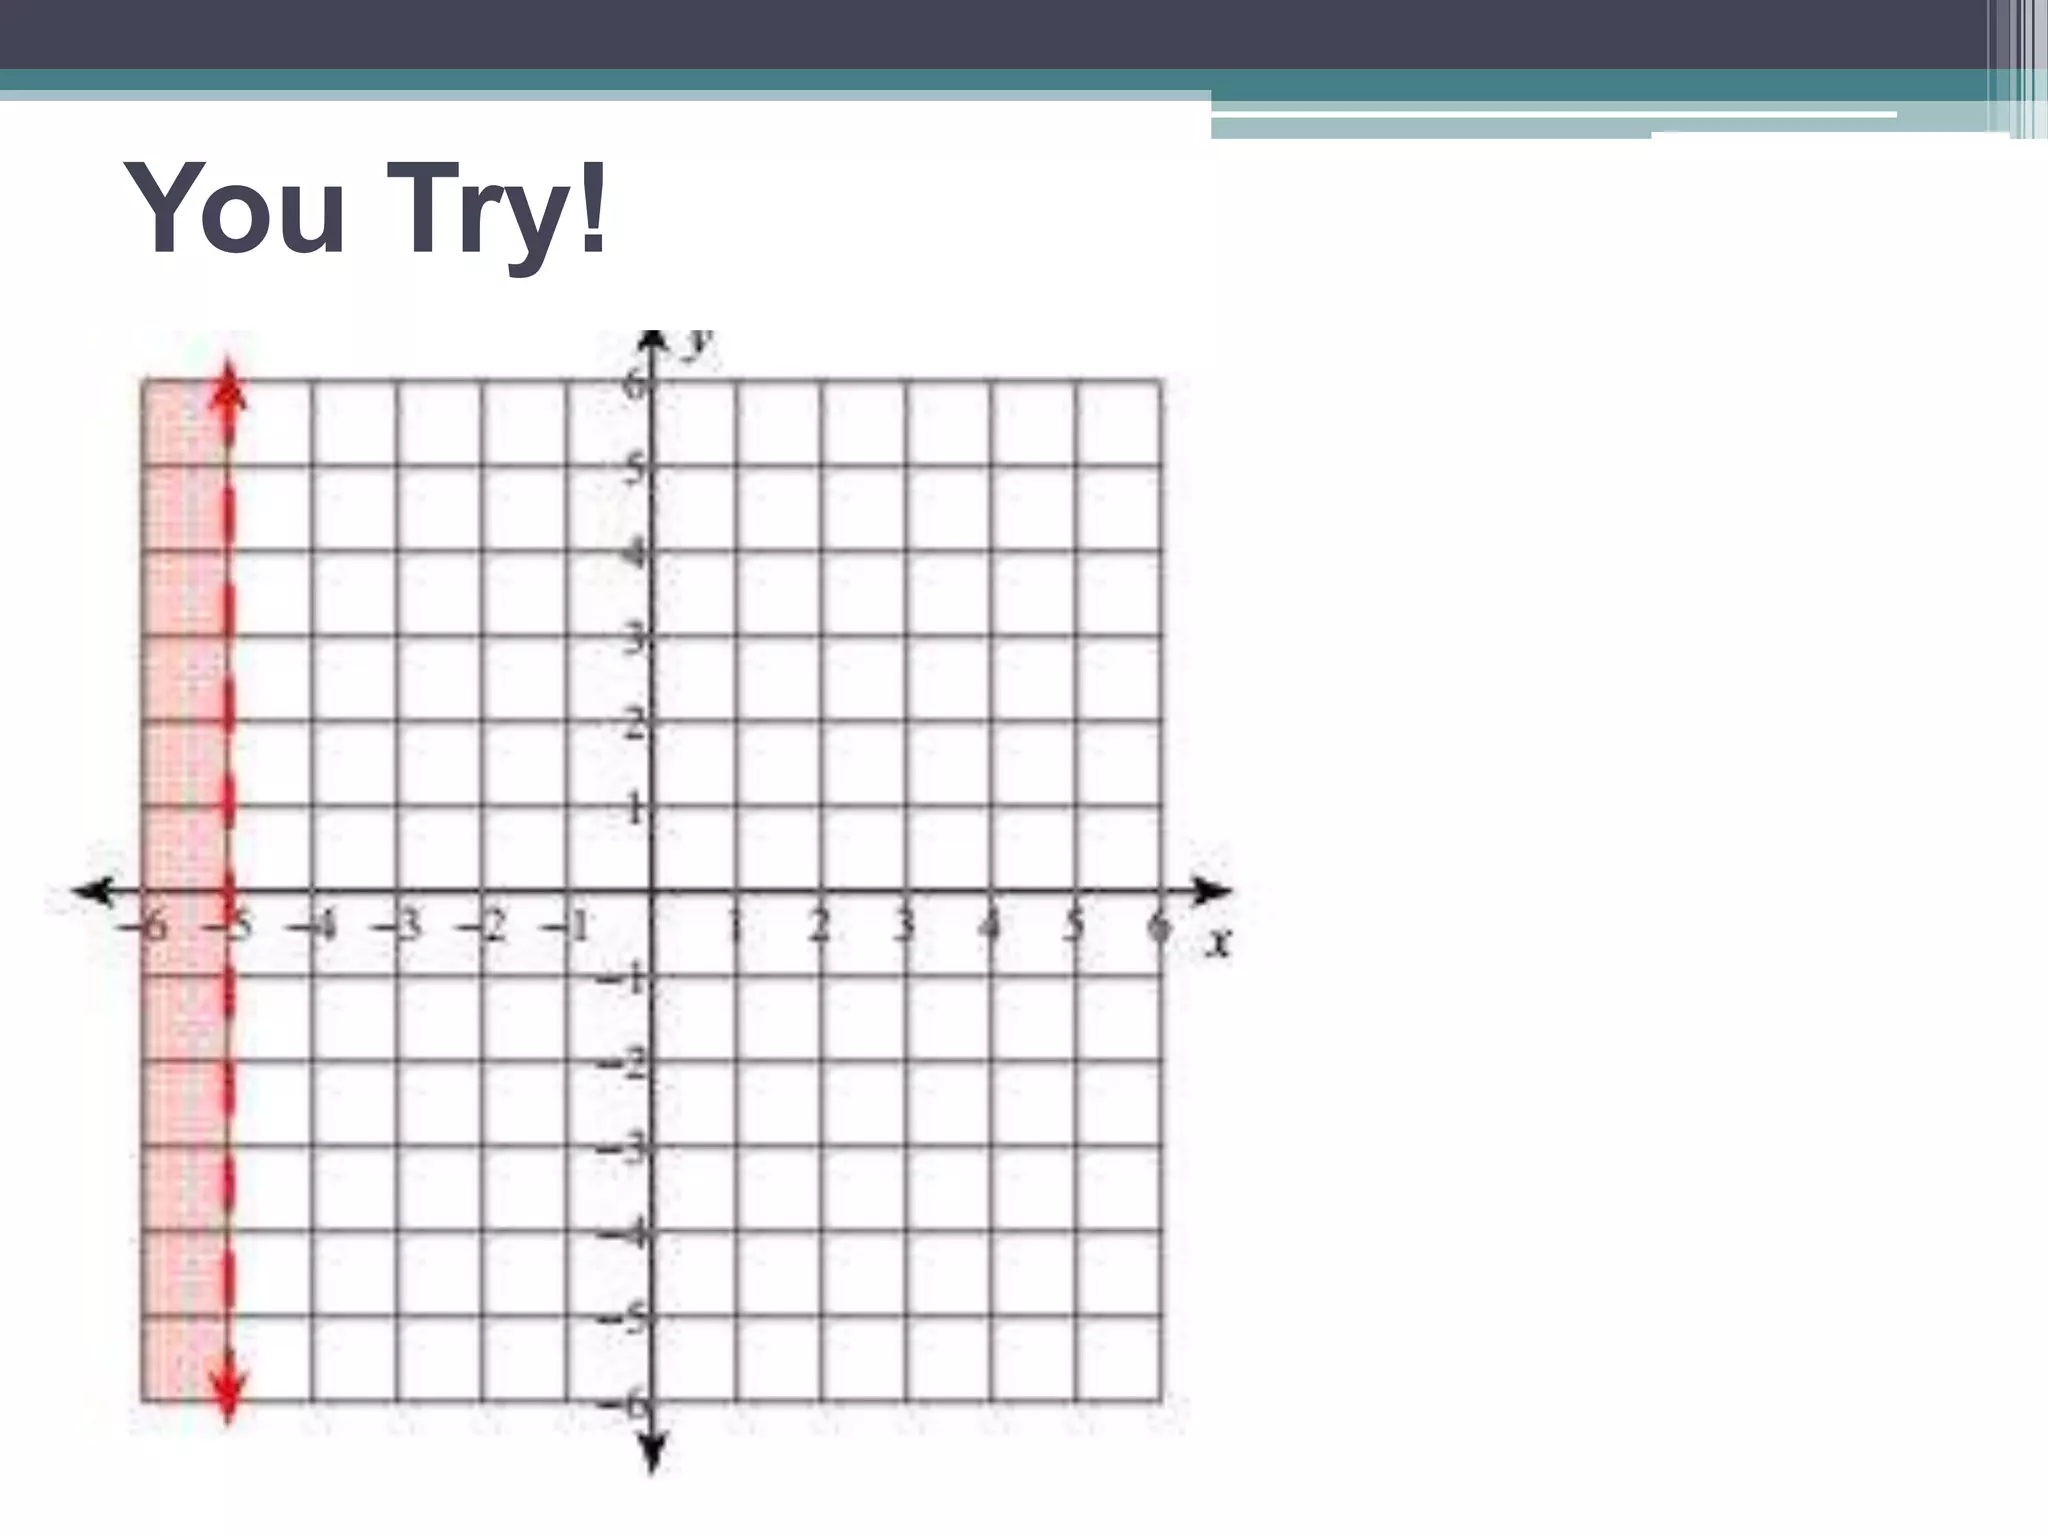
This document discusses linear inequalities and how to graph them. It introduces linear inequalities as expressions with inequality symbols like <, >, ≥, or ≤ instead of equals signs. Solutions to inequalities are ordered pairs that make the statement true. It explains how to check if a point is a solution, and how to graph inequalities by treating them as equalities and shading the correct side based on the inequality symbol and a test point. The document contains examples of graphing various one-variable and two-variable inequalities.


![Linear Equations Slide Share Version Exploded[1]](https://cdn.slidesharecdn.com/ss_thumbnails/linear-equations-slide-share-version-exploded1-8331-thumbnail.jpg?width=640&height=640&fit=bounds)


