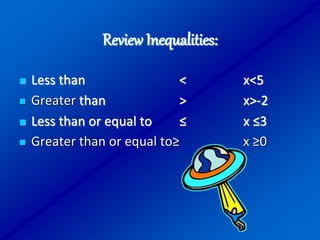
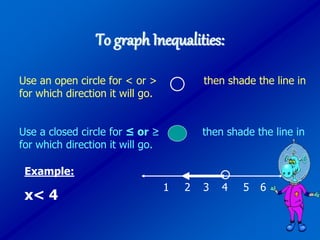
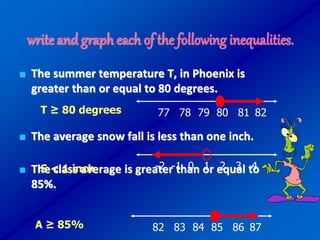
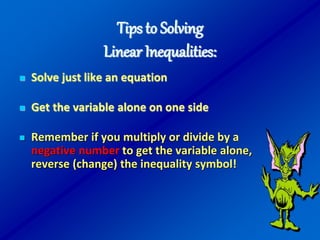
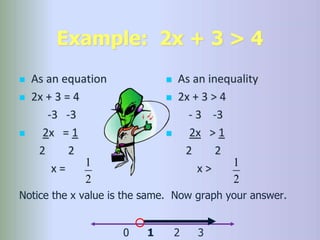
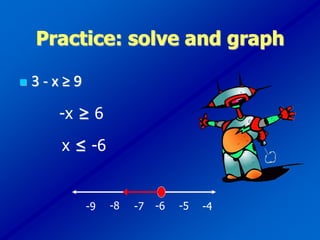
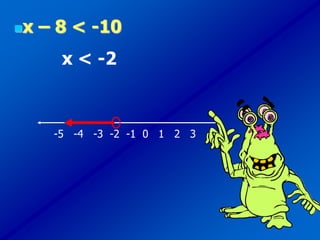
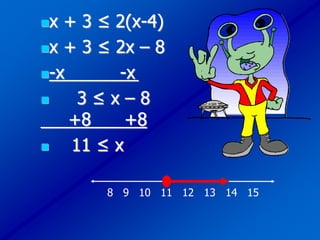
Solving Inequalities in one variable
Graph linear inequalities in one variable
Solve linear inequalities in one variable
Review Inequalities:
 Less than < x<5
 Greater than > x>-2
 Less than or equal to ≤ x ≤3
 Greater than or equal to≥ x ≥0
To graph Inequalities:
Use an open circle for < or > then shade the line in
for which direction it will go.
Use a closed circle for ≤ or ≥ then shade the line in
for which direction it will go.
Example:
x< 4
1 2 3 4 5 6
write and graph each of the following inequalities.
 The summer temperature T, in Phoenix is
greater than or equal to 80 degrees.
 The average snow fall is less than one inch.
 The class average is greater than or equal to
85%.
T ≥ 80 degrees 77 78 79 80 81 82
S < 1 inch -2 -1 0 1 2 3 4
A ≥ 85% 82 83 84 85 86 87
Tips to Solving
Linear Inequalities:
 Solve just like an equation
 Get the variable alone on one side
 Remember if you multiply or divide by a
negative number to get the variable alone,
reverse (change) the inequality symbol!
Example: 2x + 3 > 4
 As an equation
 2x + 3 = 4
-3 -3
 2x = 1
2 2
x =
 As an inequality
 2x + 3 > 4
- 3 -3
 2x > 1
2 2
x >
2
1
2
1
Notice the x value is the same. Now graph your answer.
1
0 2 3
Practice: solve and graph
 3 - x ≥ 9
x ≤ -6
-9 -4
-5
-6
-7
-8
-x ≥ 6
x – 8 < -10
x < -2
-5 -4 -3 -2 -1 0 1 2 3
x + 3 ≤ 2(x-4)
x + 3 ≤ 2x – 8
-x -x
 3 ≤ x – 8
+8 +8
 11 ≤ x
8 9 10 11 12 13 14 15

GRADE 1O FMATHS WEEK 5 Powerpoint p.pptx

  • 1.
    Solving Inequalities inone variable Graph linear inequalities in one variable Solve linear inequalities in one variable
  • 2.
    Review Inequalities:  Lessthan < x<5  Greater than > x>-2  Less than or equal to ≤ x ≤3  Greater than or equal to≥ x ≥0
  • 3.
    To graph Inequalities: Usean open circle for < or > then shade the line in for which direction it will go. Use a closed circle for ≤ or ≥ then shade the line in for which direction it will go. Example: x< 4 1 2 3 4 5 6
  • 4.
    write and grapheach of the following inequalities.  The summer temperature T, in Phoenix is greater than or equal to 80 degrees.  The average snow fall is less than one inch.  The class average is greater than or equal to 85%. T ≥ 80 degrees 77 78 79 80 81 82 S < 1 inch -2 -1 0 1 2 3 4 A ≥ 85% 82 83 84 85 86 87
  • 5.
    Tips to Solving LinearInequalities:  Solve just like an equation  Get the variable alone on one side  Remember if you multiply or divide by a negative number to get the variable alone, reverse (change) the inequality symbol!
  • 6.
    Example: 2x +3 > 4  As an equation  2x + 3 = 4 -3 -3  2x = 1 2 2 x =  As an inequality  2x + 3 > 4 - 3 -3  2x > 1 2 2 x > 2 1 2 1 Notice the x value is the same. Now graph your answer. 1 0 2 3
  • 7.
    Practice: solve andgraph  3 - x ≥ 9 x ≤ -6 -9 -4 -5 -6 -7 -8 -x ≥ 6
  • 8.
    x – 8< -10 x < -2 -5 -4 -3 -2 -1 0 1 2 3
  • 9.
    x + 3≤ 2(x-4) x + 3 ≤ 2x – 8 -x -x  3 ≤ x – 8 +8 +8  11 ≤ x 8 9 10 11 12 13 14 15