The document discusses linear inequalities and their properties, explaining how to solve them similarly to linear equations while noting the importance of reversing the inequality sign when multiplying or dividing by a negative. It differentiates between strict and slack inequalities, as well as providing examples of solving and graphing these inequalities on a number line. The document concludes with a presentation of graphical solutions and emphasizes the significance of shading regions corresponding to solutions.
Ch-6
Linear Inequalities
Submitted by-Lucky Choudhary
Submitted To – Mr. N.K Rai Sir
Date – 8th Sept. 2014
3.
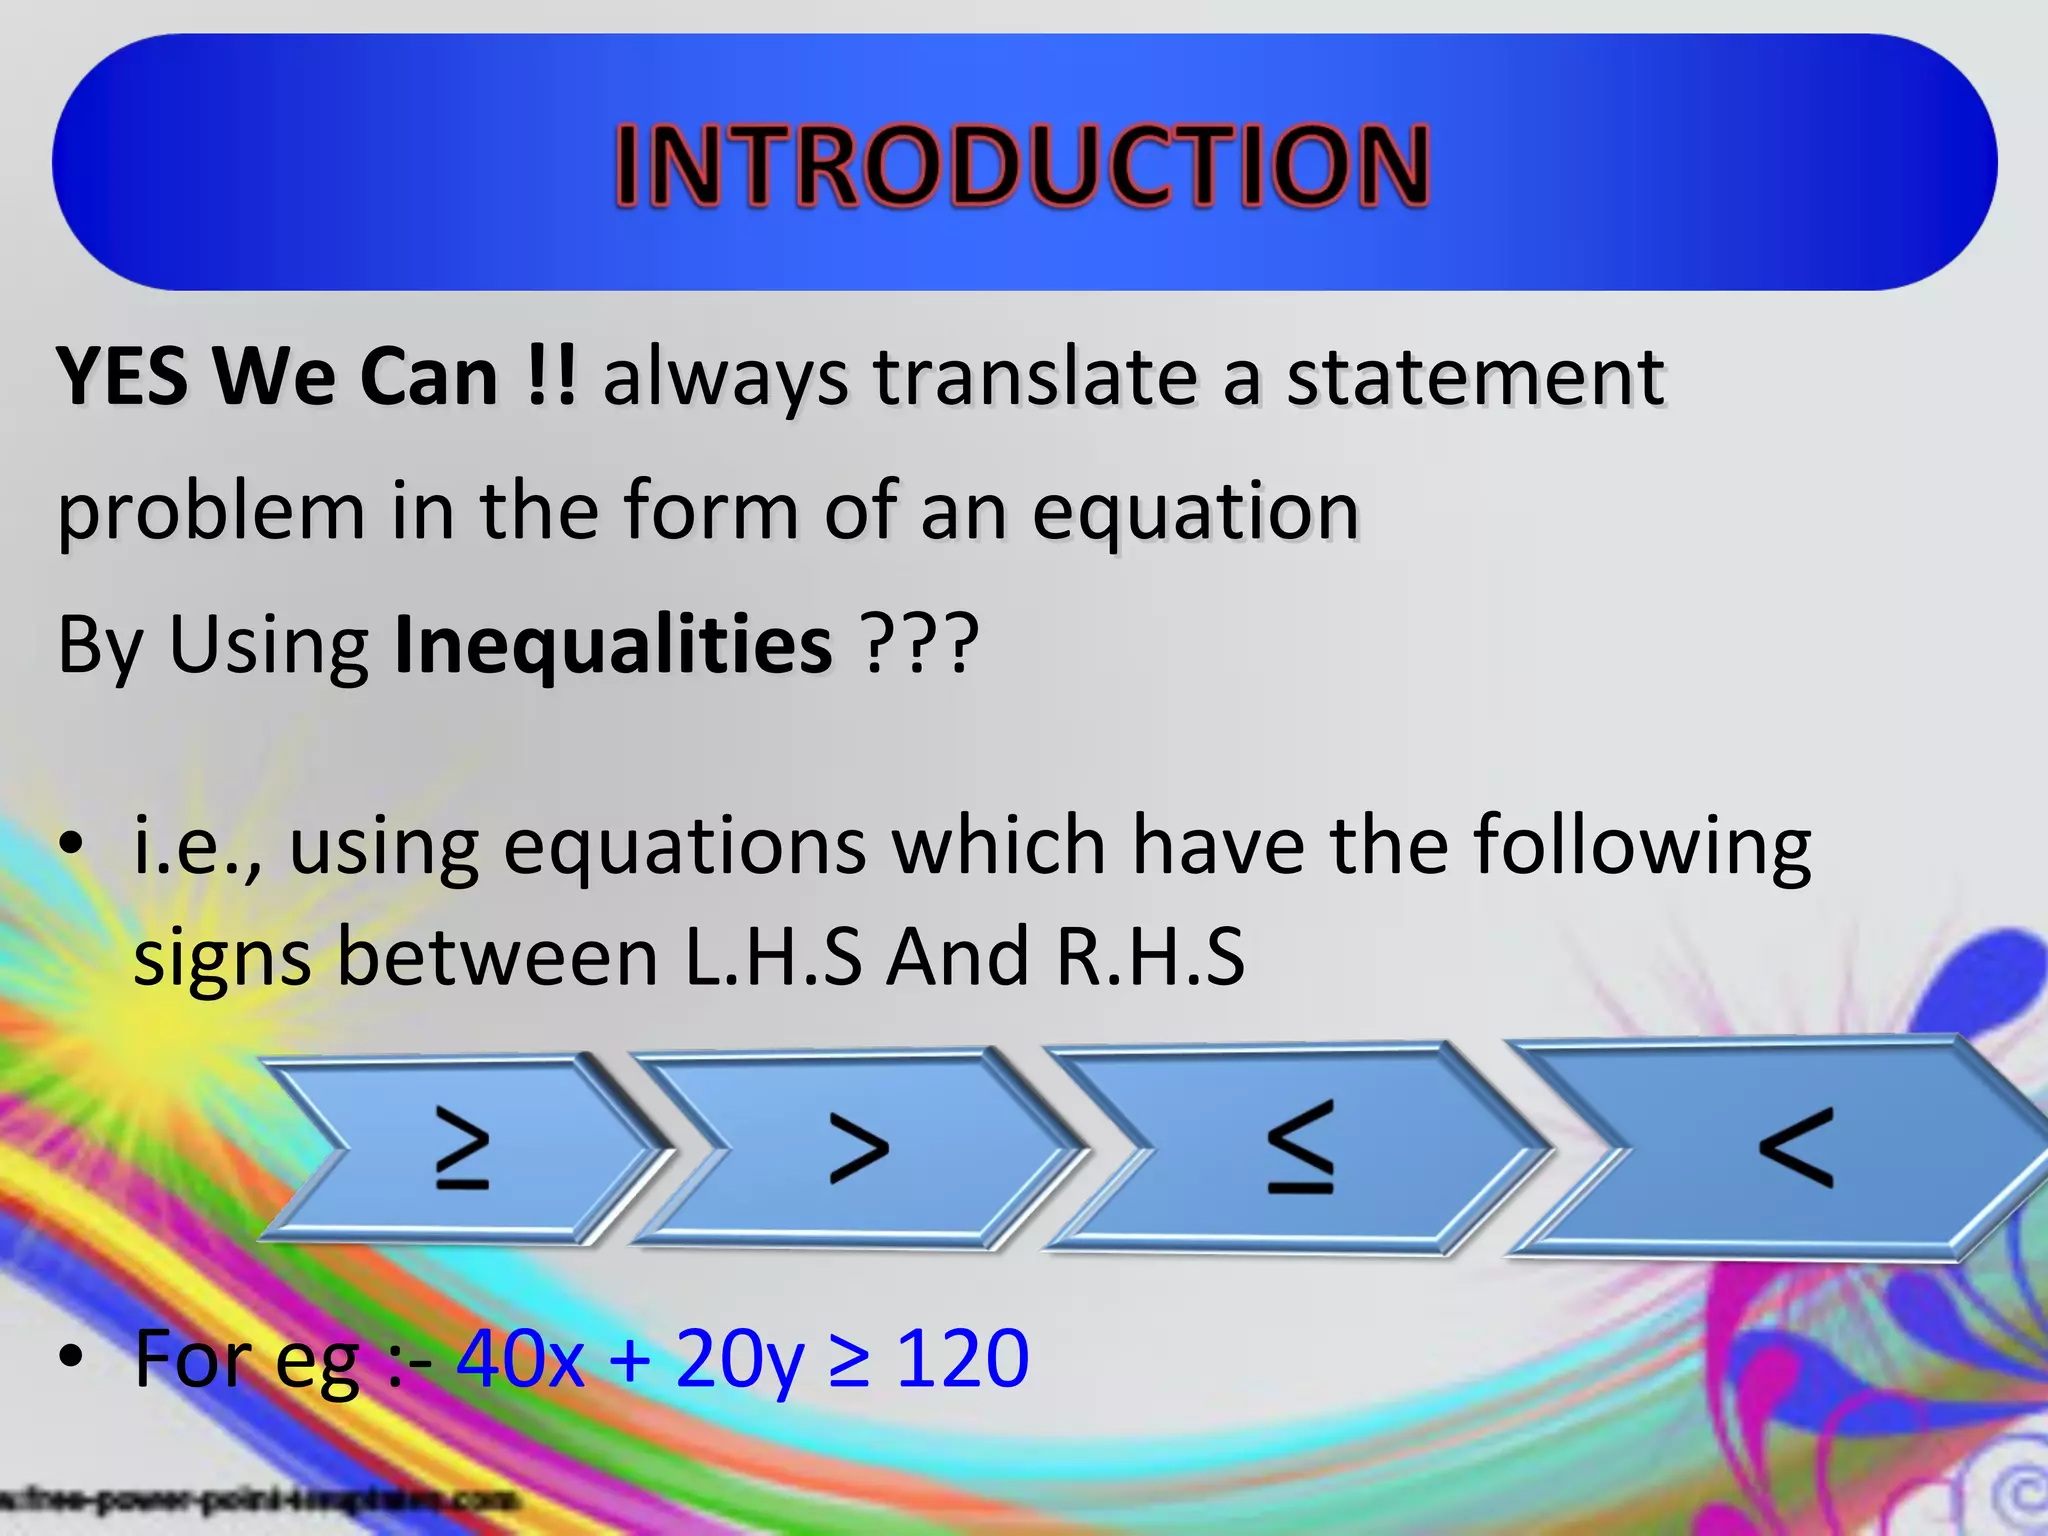
YYEESS WWee CCaann!!!! aallwwaayyss ttrraannssllaattee aa ssttaatteemmeenntt
pprroobblleemm iinn tthhee ffoorrmm ooff aann eeqquuaattiioonn
By Using IInneeqquuaalliittiieess ???
• i.e., using equations which have the following
signs between L.H.S And R.H.S
• For eg :- 40x + 20y ≥ 120
4.
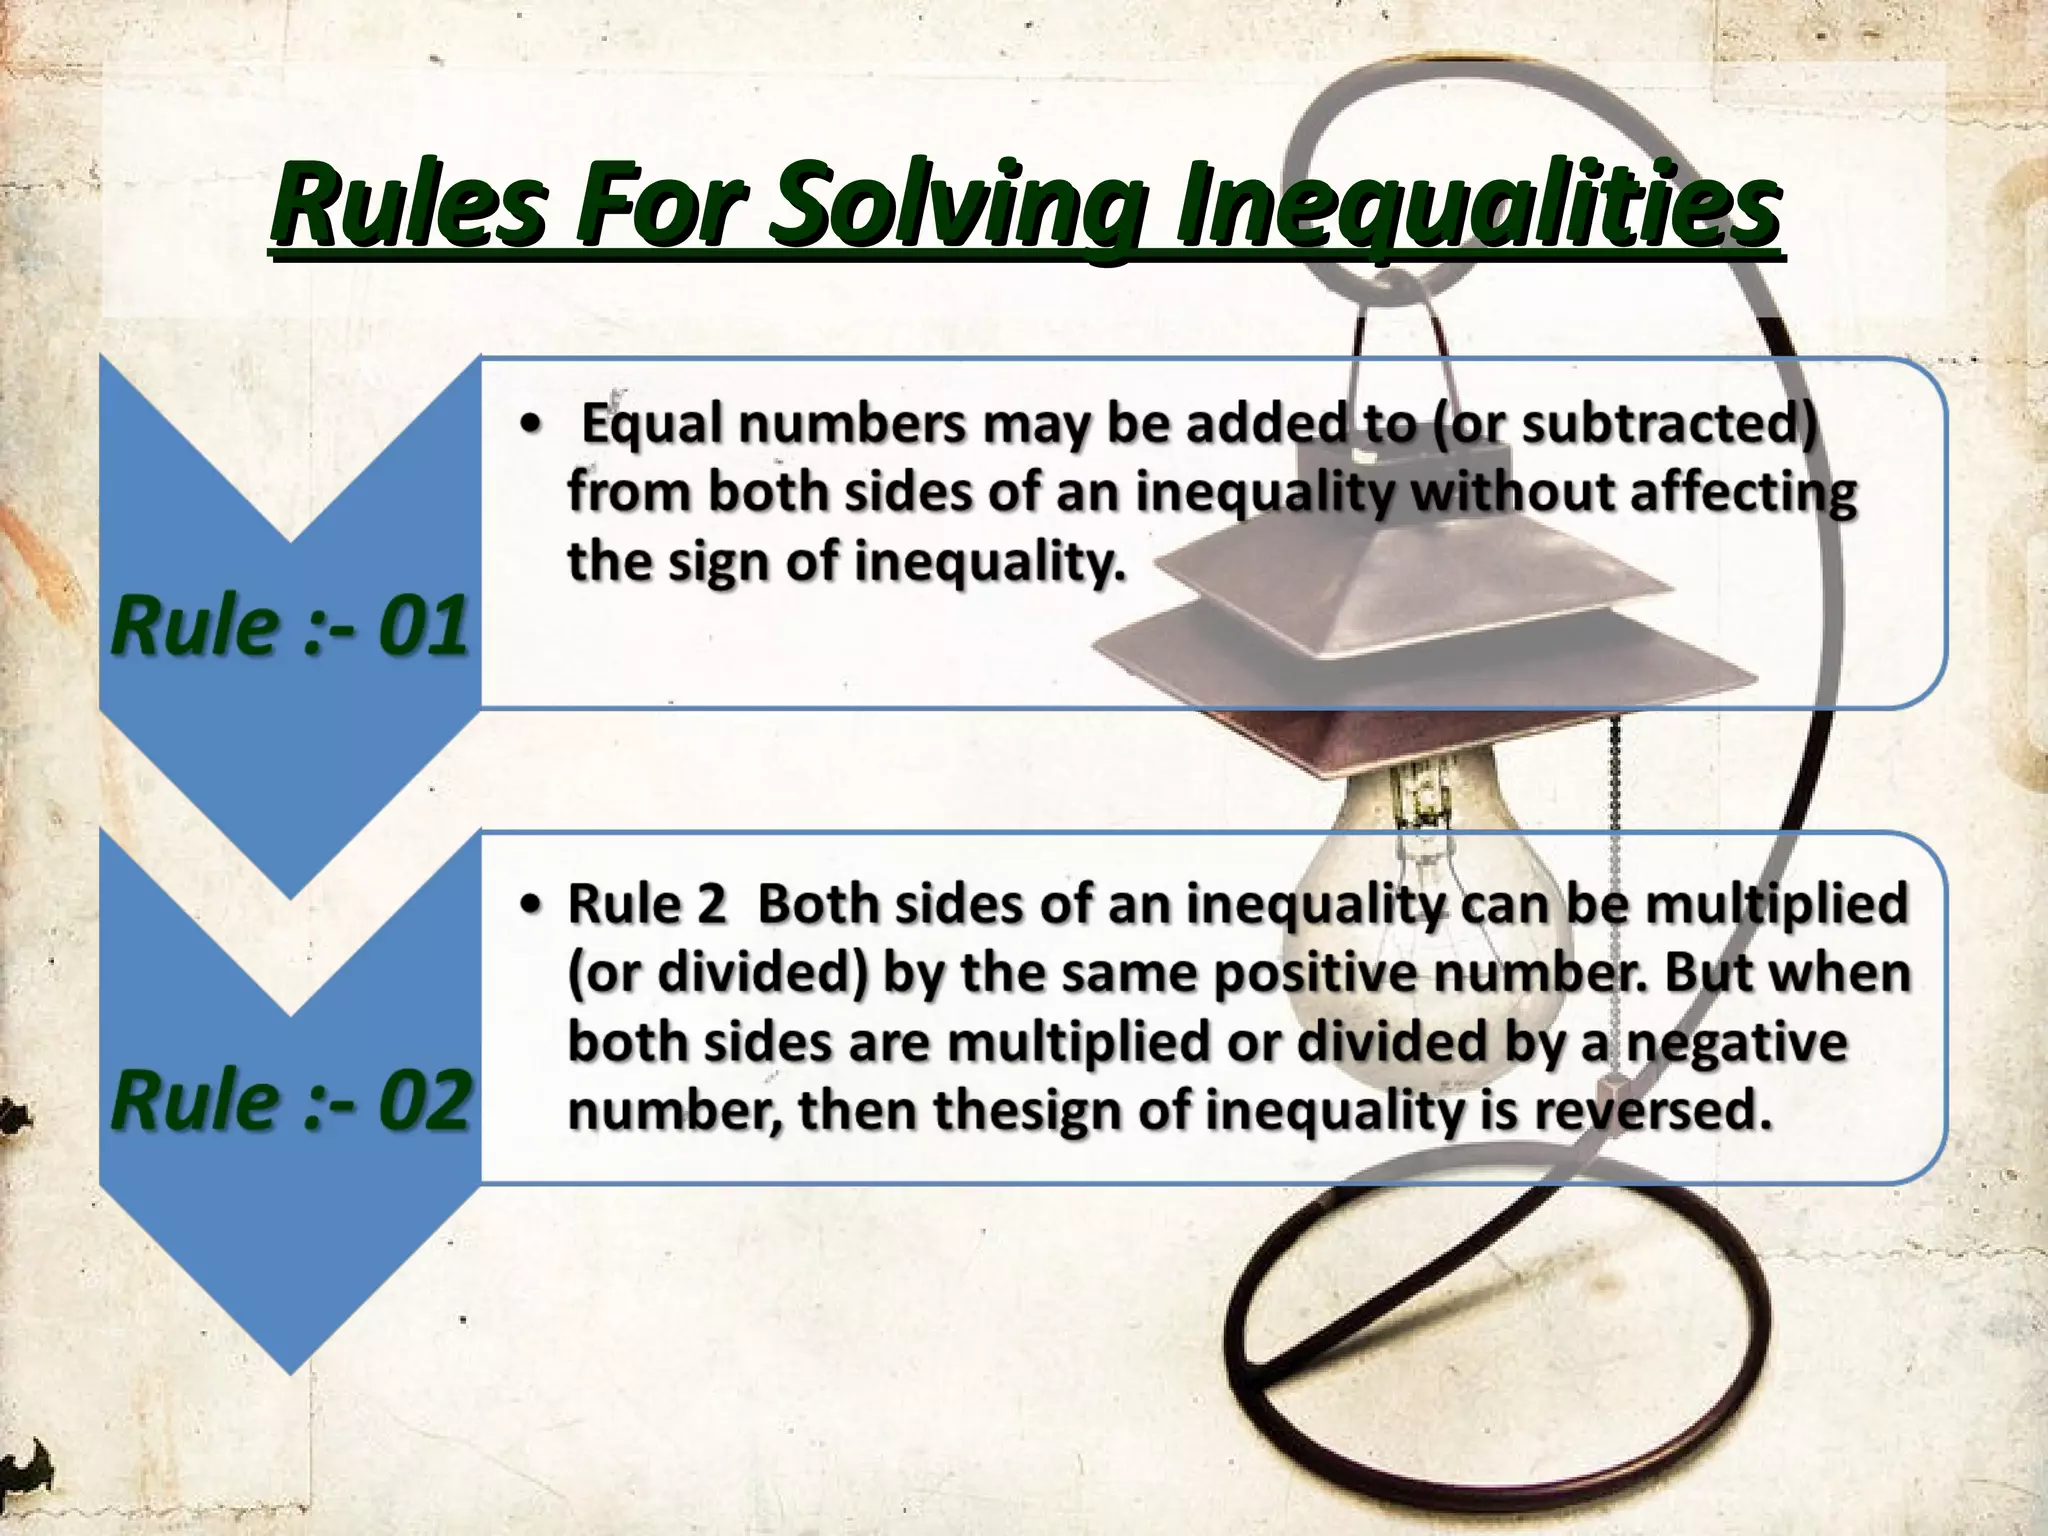
ProPerties of inequalities.
Essentially, all of the properties that you learned
to solve linear equations apply to solving linear
inequalities with the exception that if you
multiply or divide by a negative you must
reverse the inequality sign.
So to solve an inequality just do the same steps
as with an equality to get the variable alone but if
in the process you multiply or divide by a negative
let it ring an alarm in your brain that says "Oh
yeah, I have to turn the sign the other way to
keep it true".
5.
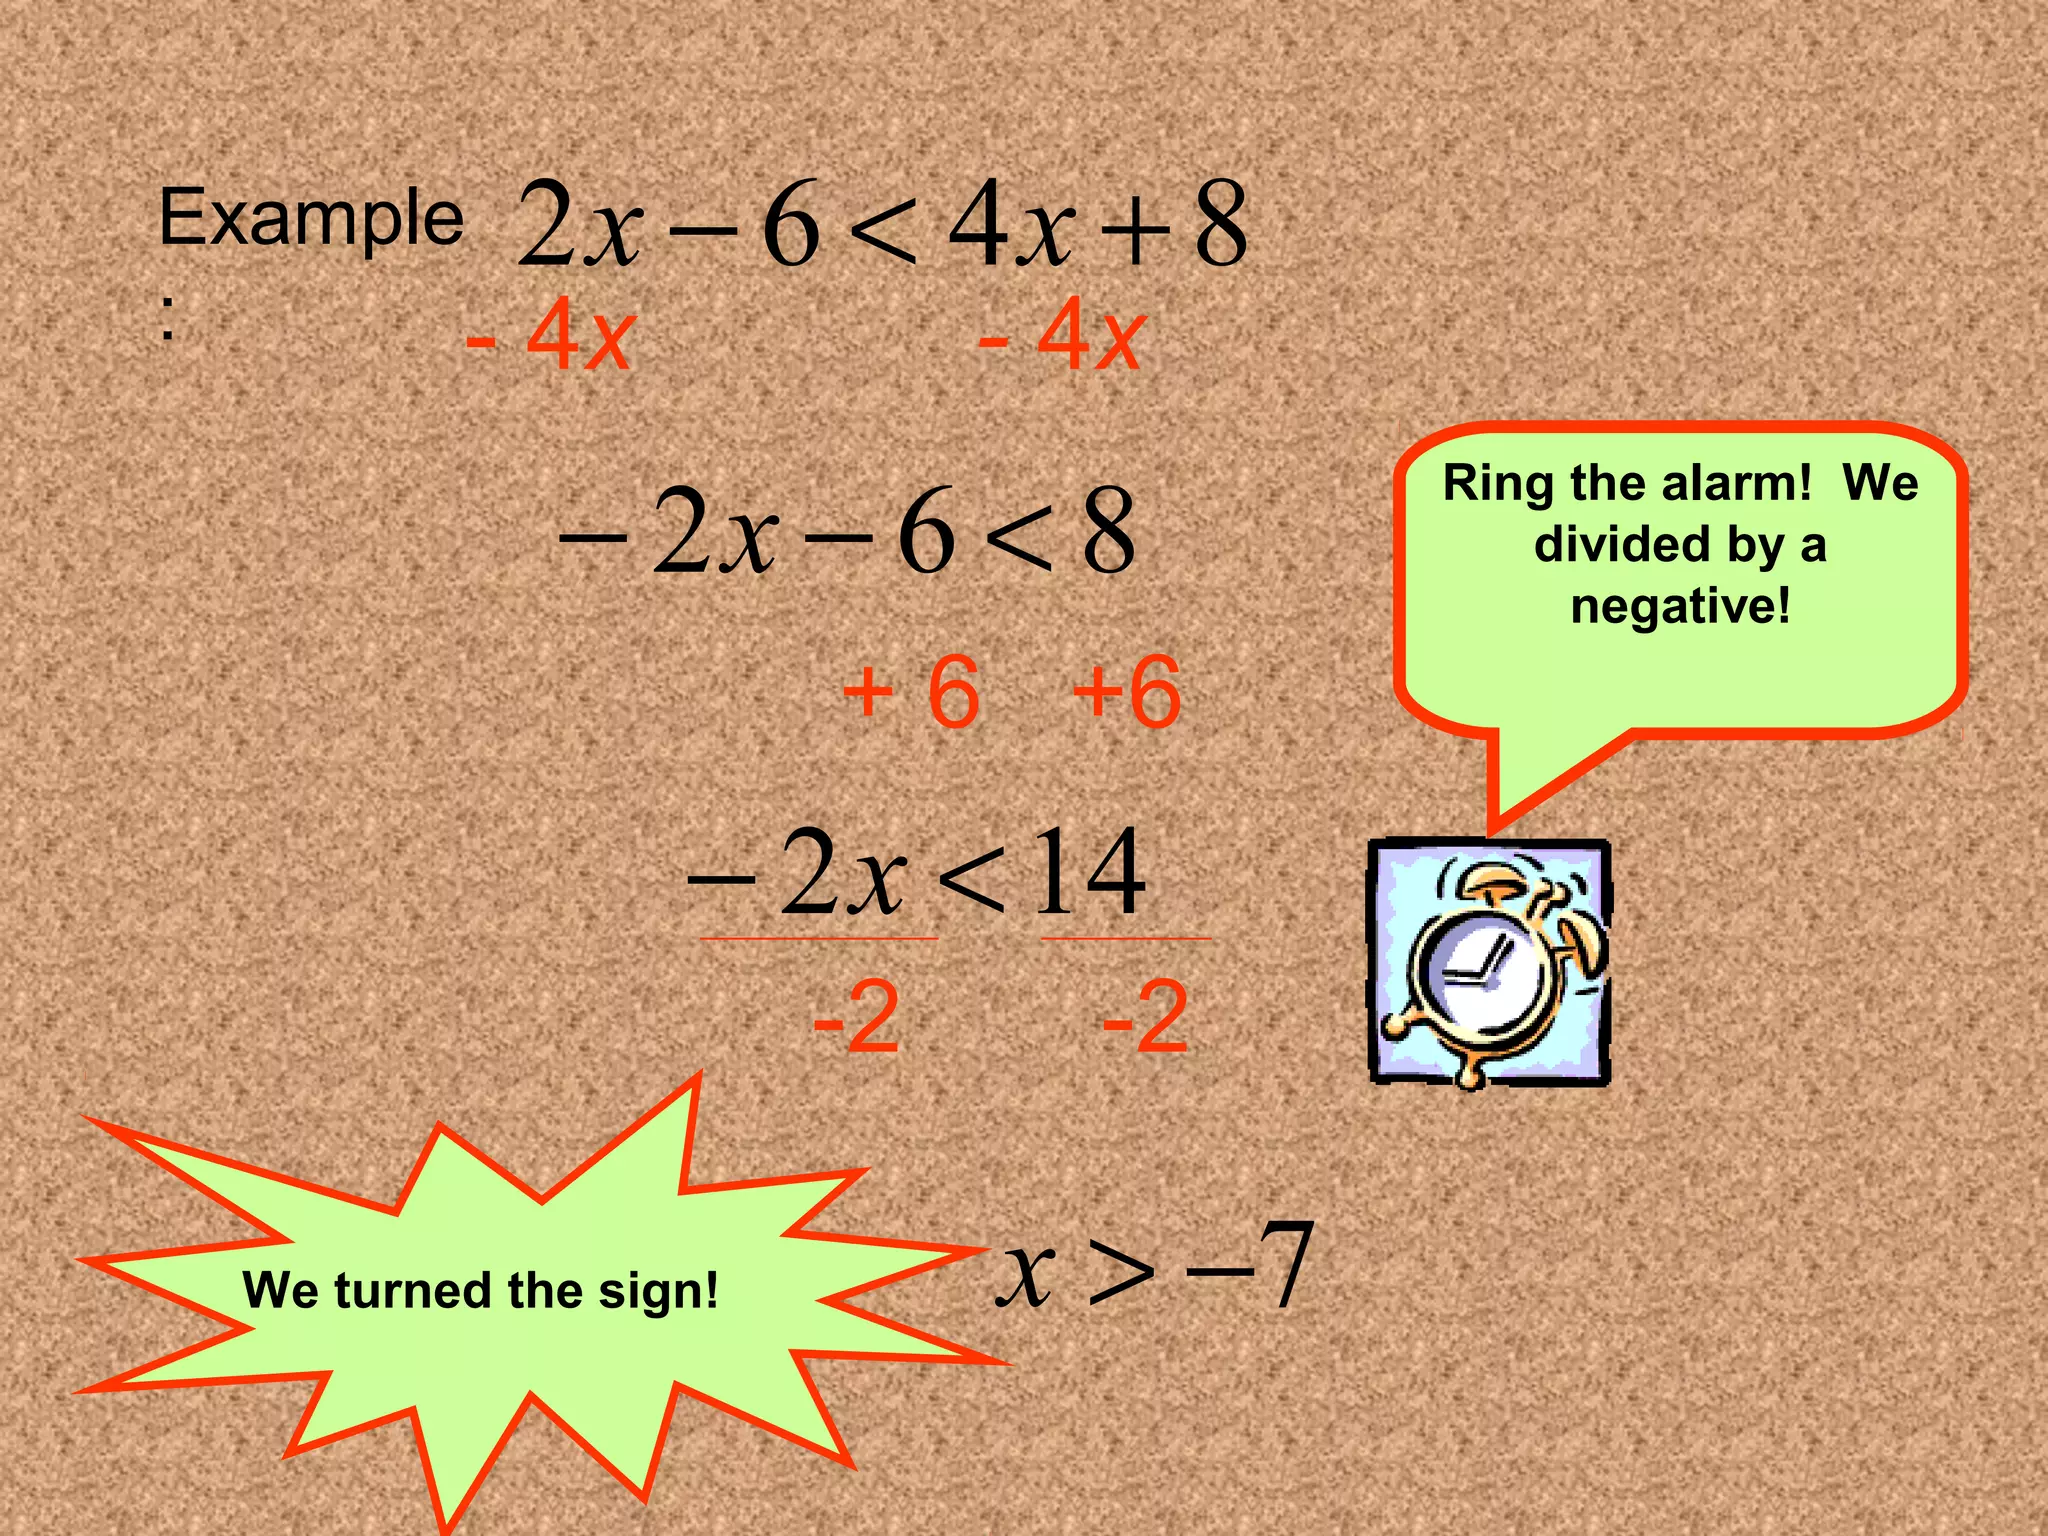
2x - 6< 4x + 8
- 4x - 4x
- 2x - 6 < 8
Example
:
+ 6 +6
- 2x <14
-2 -2
Ring the alarm! We
divided by a
negative!
We turned the sign! x > -7
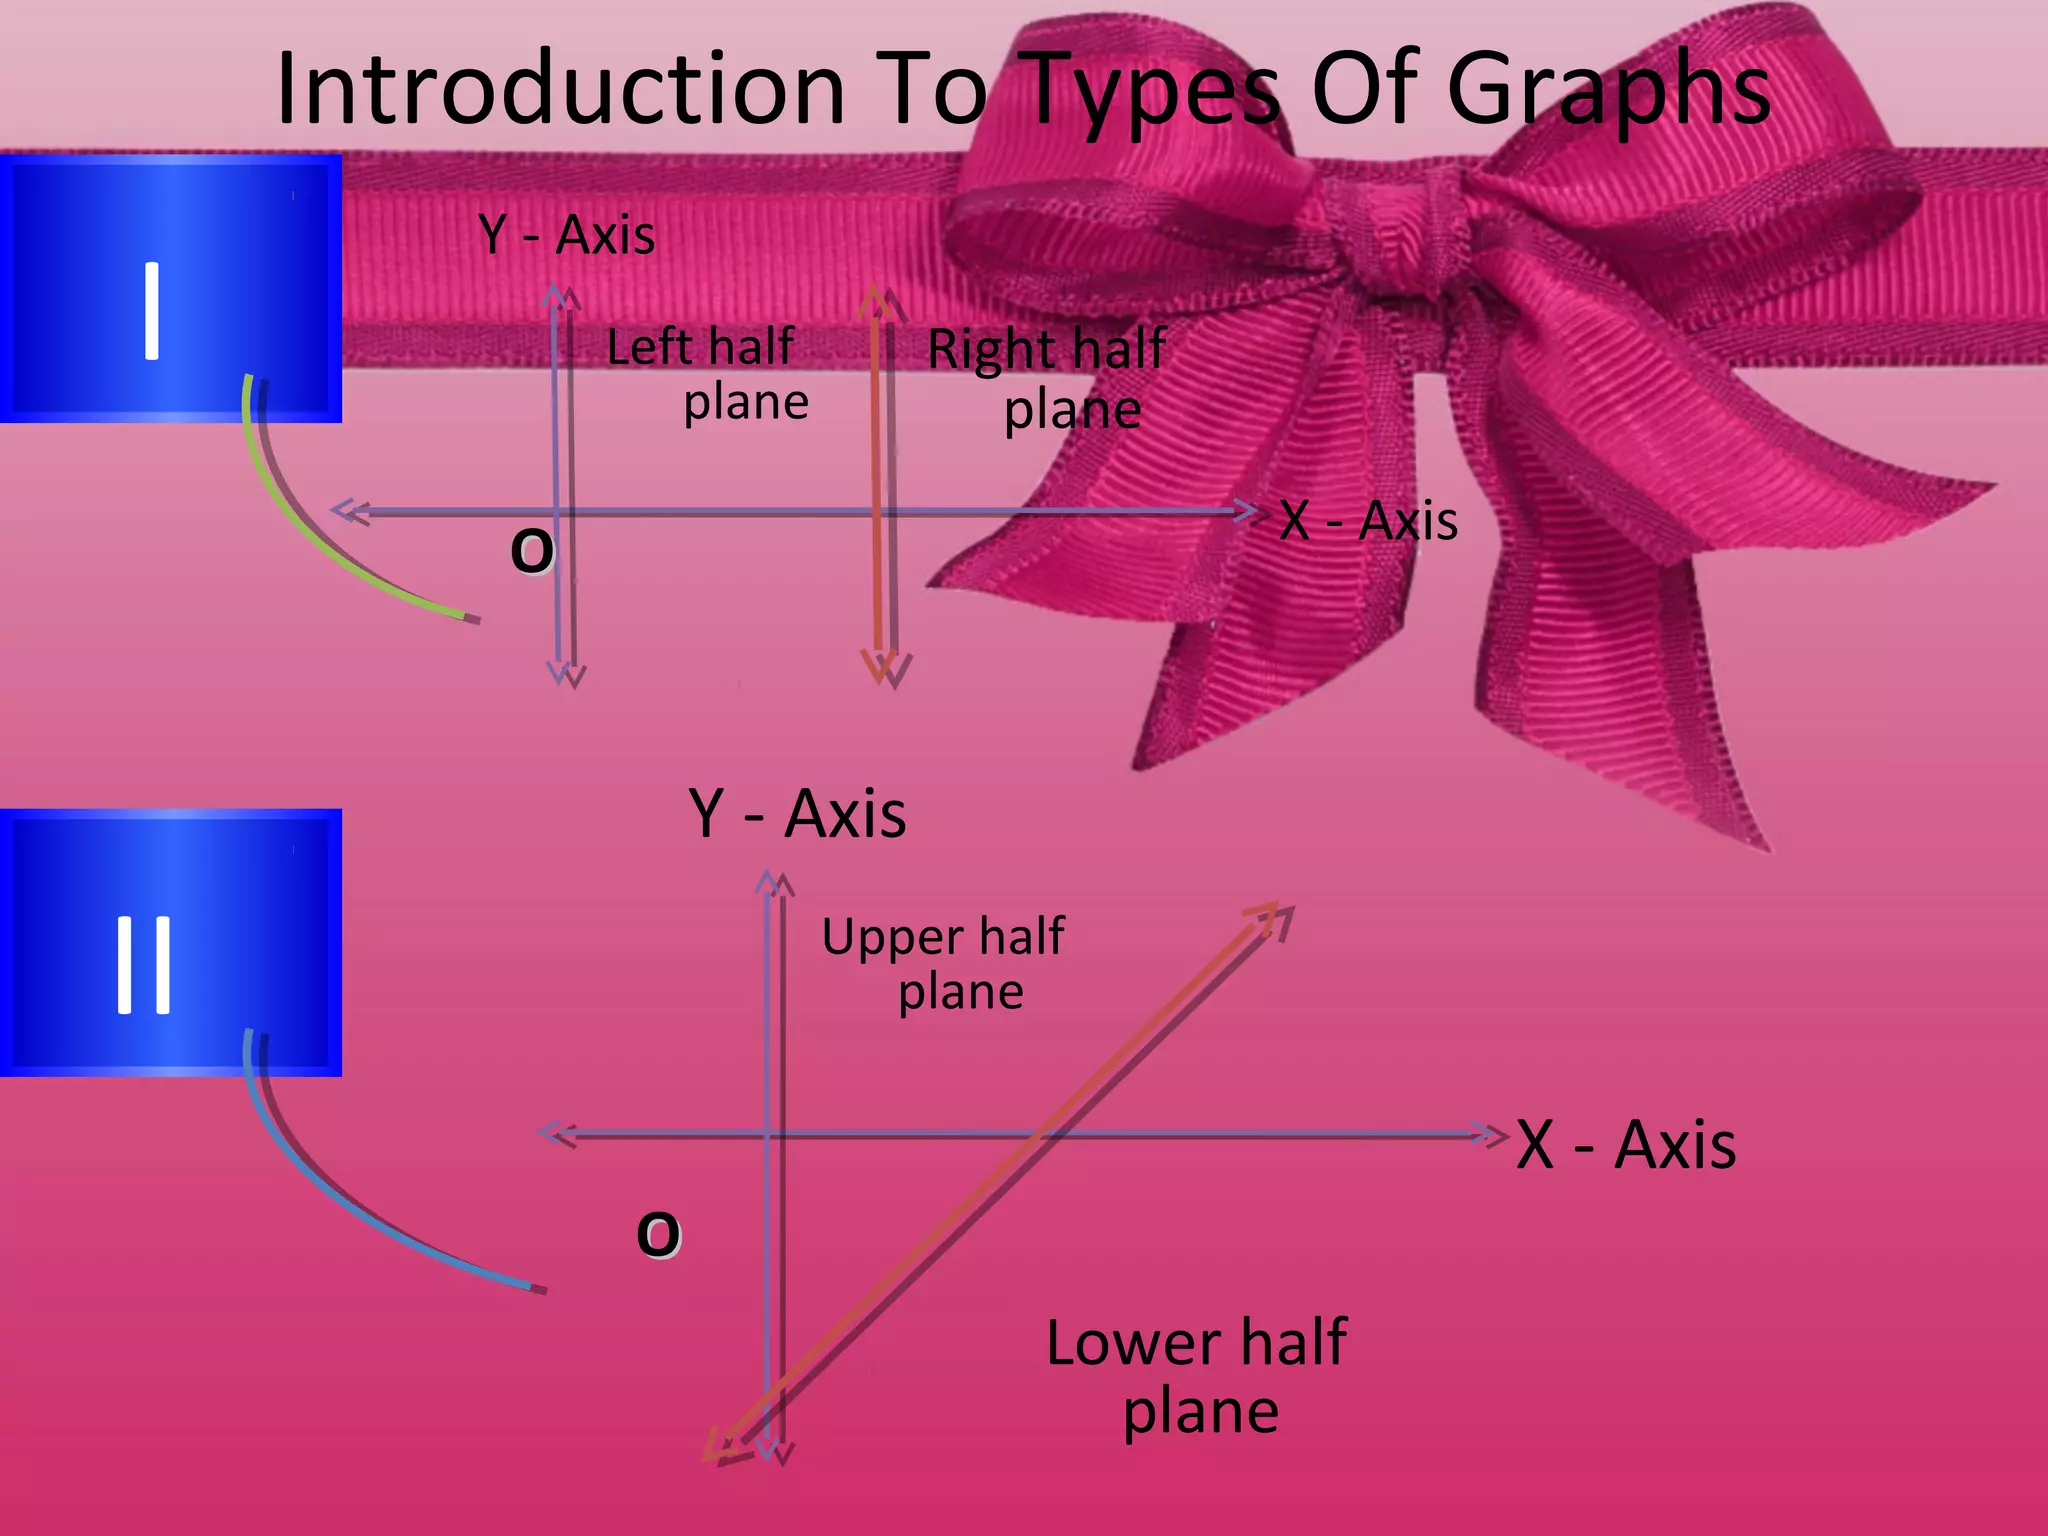
Introduction To TypesOf Graphs
I
II
X - Axis
Y - Axis
Left half
plane
Right half
plane
OO
X - Axis
Y - Axis
Upper half
plane
Lower half
plane
OO
12.
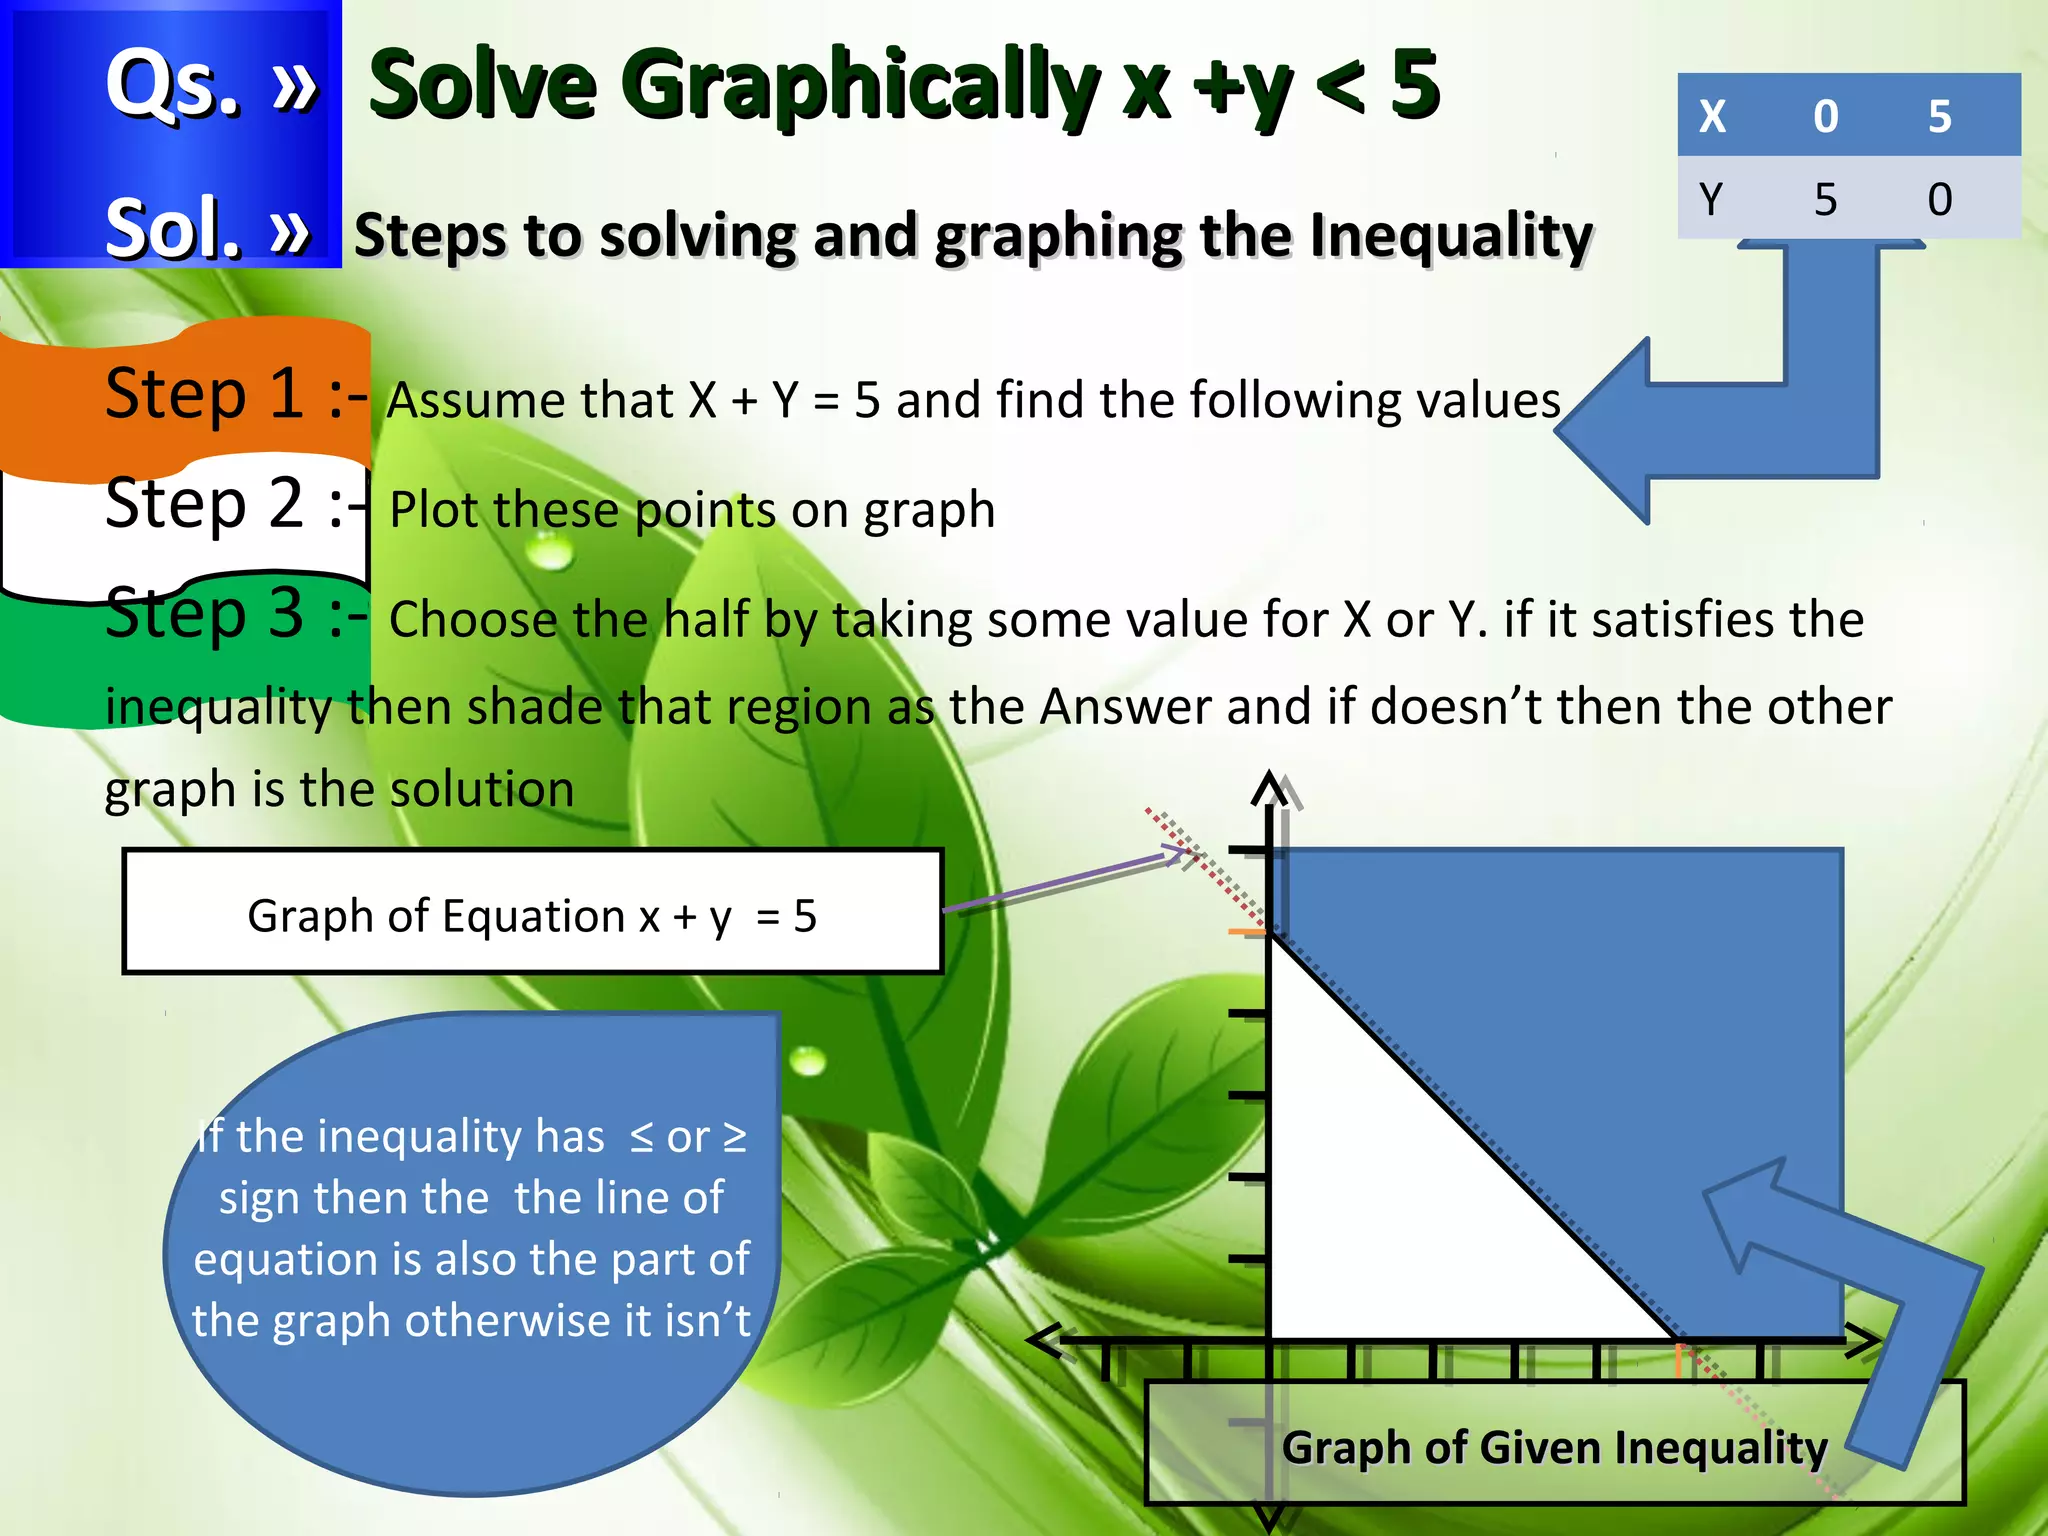
QQss.. » SSoollvveeGGrraapphhiiccaallllyy xx ++yy << 55 X 0 5
Y 5 0
SSooll.. » SStteeppss ttoo ssoollvviinngg aanndd ggrraapphhiinngg tthhee IInneeqquuaalliittyy
Step 1 :- Assume that X + Y = 5 and find the following values
Step 2 :- Plot these points on graph
Step 3 :- Choose the half by taking some value for X or Y. if it satisfies the
inequality then shade that region as the Answer and if doesn’t then the other
graph is the solution
Graph of Equation x + y = 5
If the inequality has ≤ or ≥
sign then the the line of
equation is also the part of
the graph otherwise it isn’t
GGrraapphh ooff GGiivveenn IInneeqquuaalliittyy
13.
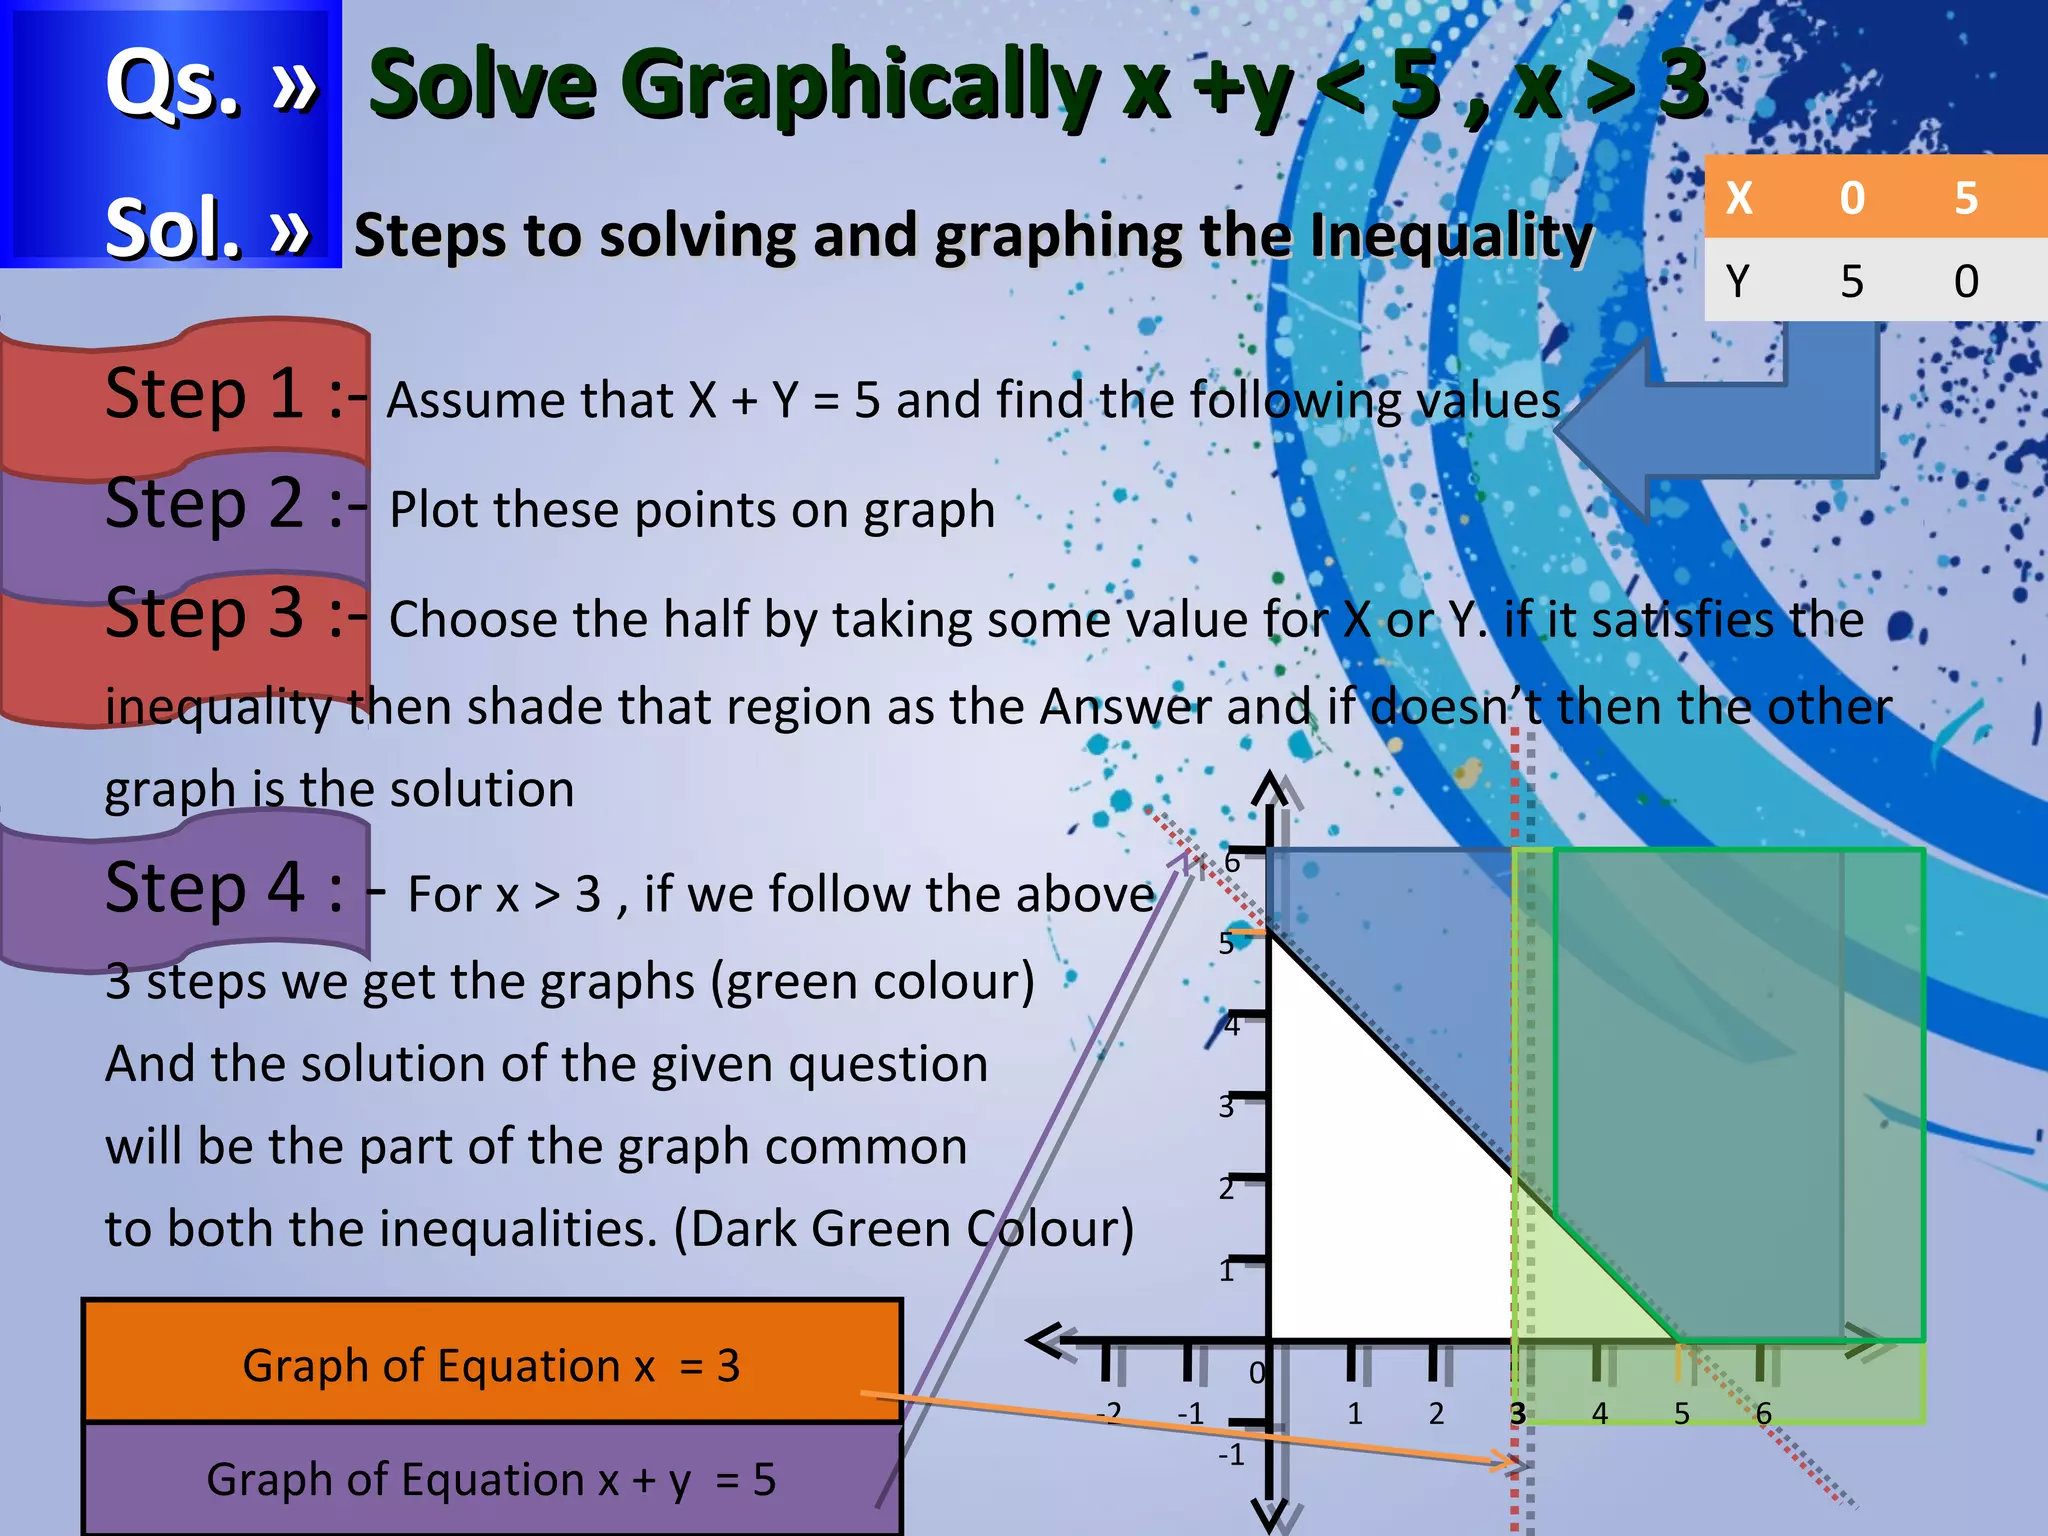
QQss.. » SSoollvveeGGrraapphhiiccaallllyy xx ++yy << 55 ,, xx >> 33
X 0 5
Y 5 0
SSooll.. » SStteeppss ttoo ssoollvviinngg aanndd ggrraapphhiinngg tthhee IInneeqquuaalliittyy
Step 1 :- Assume that X + Y = 5 and find the following values
Step 2 :- Plot these points on graph
Step 3 :- Choose the half by taking some value for X or Y. if it satisfies the
inequality then shade that region as the Answer and if doesn’t then the other
graph is the solution
Step 4 : - For x > 3 , if we follow the above
3 steps we get the graphs (green colour)
And the solution of the given question
will be the part of the graph common
to both the inequalities. (Dark Green Colour)
Graph of Equation x + y = 5
0
6
5
4
3
2
1
-2 -1 1 2 33 4 5 6
-1
Graph of Equation x = 3