Downloaded 139 times
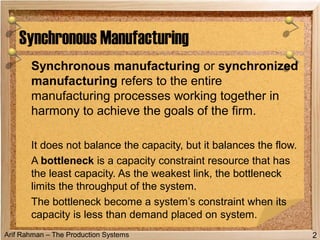
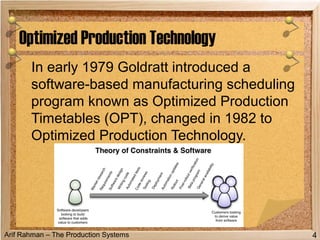
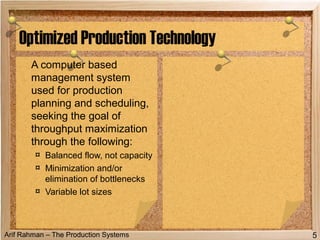
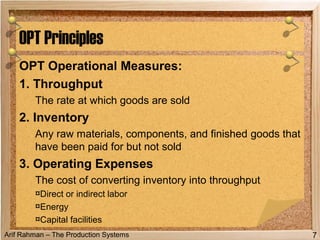
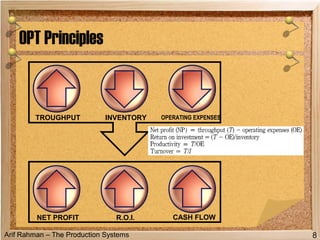
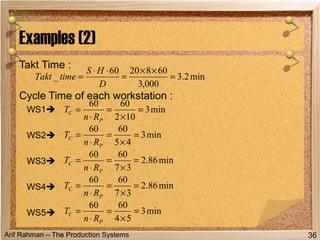
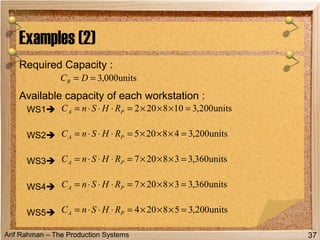
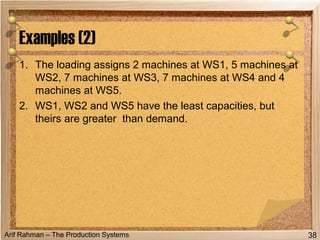


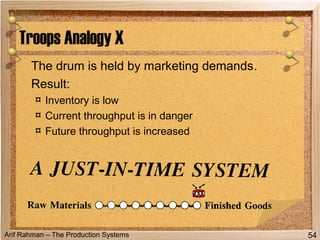
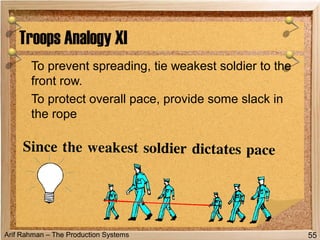
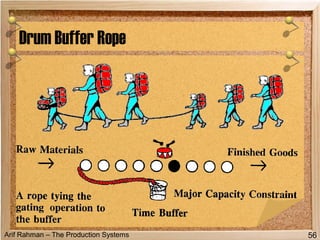
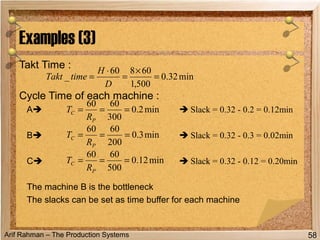
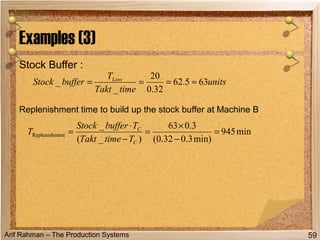
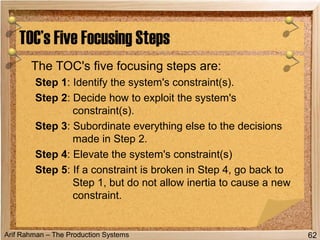
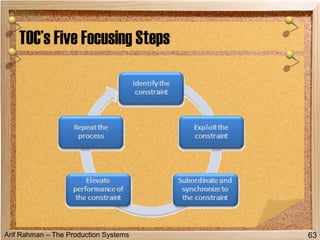


This document provides an introduction to synchronous manufacturing and optimized production technology. It discusses key concepts like bottlenecks, non-bottlenecks, throughput, inventory, and operating expenses. The document outlines Eliyahu Goldratt's optimized production technology (OPT) which uses a computer-based system to maximize throughput by balancing flow rather than capacity and minimizing or eliminating bottlenecks. It also discusses drum-buffer-rope, a production scheduling method used in TOC that involves a drum, buffer, and rope to control material flow.