便利な数を100億個の乱数から算出
•Download as PPTX, PDF•
1 like•1,830 views

A consideration about picking up the `best' values from N times experiences. Mathematically, the author considered "how the maximum value of N values that are distributed normally distributes?". The median values are 0.998, 1.498, 1.998 for N=4,10,30, respectively. This proposition would be useful because everybody quite often is in need of choosing something best from multiple candidates in their daily or social life. The figures shown above are easy to remember so you can utilize them with ease.

Recommended
More Related Content
What's hot
Viewers also liked
Viewers also liked (20)
Similar to 便利な数を100億個の乱数から算出
More from Toshiyuki Shimono
More from Toshiyuki Shimono (20)
便利な数を100億個の乱数から算出
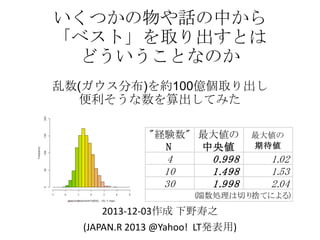
- 1. いくつかの物や話の中から 「ベスト」を取り出すとは どういうことなのか 乱数(ガウス分布)を約100億個取り出し 便利そうな数を算出してみた "経験数" 最大値の N 中央値 4 10 30 0. 998 1. 498 1. 998 最大値の 期待値 1. 02 1. 53 2. 04 (端数処理は切り 捨てによる) 2013-12-03作成 下野寿之 (JAPAN.R 2013 @Yahoo! LT発表用)
- 2. Statement : Assume Norm + ( m,s 2 ) be the distribution of the maximum value of N N stochastic variables distributed normally with mean m and variance s 2 . Then for N = 4, 10, 30, each median value of Norm + (0,1) are, N approximately 0.9981, 1.4988, 1.9982, that are rounded down to 0.998, 1.498, 1.998, respectively. These are easy to remember as 1-e , 1.5-e , 2-e for N = 4, 10, 30 with e =0.002, thus possibly very useful for your daily and social life. These numeric figures are calculated from billions of Mersenne Twister psudo-ranom numbers using R language.
- 3. 何を考えようとした か 「乱数N個の最大値」は どんな分布だろうか? N個の乱数(~標準ガウス分布 )から最大値を取り出す。 この値はどんな分布だろうか? 特に中央値はいくらであろうか? ← これに答え ます。 10個の乱数を標準ガウス分布から取 り出して最大値を取り出すことを10 万回反復。1万回ごとにヒストグラム を描いて10コマの動画にした。中央 値はほぼ1.5。 ― その正確な値はいくらであろうか? ― N=10個という数を変えたらどうな る?
- 4. 上記の変数 l (エル) を1万から1億程度に増やしてできるだけ中央値を正確に計算 する。 計算上の工夫として、1000万個ずつ乱数を発生して、中央値を計算して、csv ファイルとして出力して、推定誤差も見積もれるようにする。
- 5. 結論 4回: +1.0σ; 10回: +1.5σ ; 30回: +2.0σ "経験数" N 算出に用いた 乱数の個数 M 最大値の中央値 [下2桁の標準誤差(SD )] 最大値の 期待値 1 ― 0 0 4 10 30 41億 41億 51億 0. 998 1. 498 1. 998 147 [22] 802 [29] 224 [40] 各Nについて、M 個の乱数をN個ずつ に分けて、それぞれの最大値を算出 する。それら(M÷N)個の数の中央値と 平均値が、それぞれ第3列と第4列で ある。この2個の数は、0.03 程度の差 がある。 1. 93 02 1. 67 53 2. 27 04 やや日常的な解釈: ガウス分布(μ,σは所与)から、 30個の乱数を取り出す。 「その最大値はぴったり50% の確率で、μ + 1.998.. σ 」以上 になる。同様に 「~」以下に なる。 意味が分かれば、記憶しやすく、便利な数。 ― 近似するとキリの良い数である。 ― どの3個の値も、その近似値マイナス0.002 の操作で、さらに精度が 高まる。 応用例 : 「30回の経験を知っている人の話は、 +2σ 盛られた話だから、2σ 差し引いて話を聞いた方が良 ■
- 7. 予備知識 : ガウス分布とは Histogram of runif(1e+06) + runif(1e+06) 60000 20000 Frequency 30000 0 0 10000 Frequency 50000 Histogram of runif(1e+06) 0.0 0.2 0.4 0.6 0.8 1.0 0.0 0.5 runif(1e+06) 1.0 1.5 2.0 runif(1e+06) + runif(1e+06) 120000 80000 Frequency 0 40000 100000 50000 0 Frequency 150000 Histogram of runif(1e+06) + runif(1e+06) + runif(1e+06) Histogram of runif(1e+06) + runif(1e+06) + runif(1e+06) + runif(1e+06) 0.0 0.5 1.0 1.5 2.0 2.5 3.0 0 runif(1e+06) + runif(1e+06) + runif(1e+06) 1 2 3 4 runif(1e+06) + runif(1e+06) + runif(1e+06) + runif(1e+06) 80000 Histogram of rnorm(1e+06) 2p s 2 4 ガウス分布は、多くの分布をよく近似する。 たとえば、身長の分布、体重の分布、測定 誤差を伴う観測の結果の分布などを、ガウ 20000 40000 60000 e 平均値μを0、散らばりの尺度である標準 偏差σを1になるように調整したものを特 に、「標準ガウス分布」と呼ぶ。標準正 規分布とも呼ぶ。 0 Frequency ( x- m )2 2s 2 [0,1]区間から取り出した一様乱数を2回、3 回、4回と足し合わせたものをヒストグラ ムにすると、その形は次第に、一定の形に なる(ベルカーブ,左の図)。 その究極の形 の分布を、「ガウス分布」と呼ぶ。正規 分布とも呼ぶ。 -4 -2 0 2
- 8. 予備知識 : 標準偏差 σ とは ○ 標準偏差 σ は、データの各値と平均値の 差を2乗したものの平均値に平方根の操作を 加えたものである。 (平均値-2σ) は、偏差値30に相当する。 (平均値-σ) は、偏差値40に相当する。 平均値は、偏差値50に相当する。 (平均値+σ) は、偏差値60に相当する。 (平均値+2σ) は、偏差値70に相当する。 ガウス分布から乱数 X を取り出した場合、 μ – σ < X < μ + σ となる確率は、68.27% Histogram of rnorm(1e+06, 50, 10) 80000 μ + σ < X となる確率は 15.87% 60000 μ + 2 σ < X となる確率は、2.275% 40000 μ + 3 σ < X となる確率は、0.135% 20000 μ + 4.5 σ < X となる確率は、100万分の3.4 μ + 6 σ < X となる確率は、10億分の0.99 ― 上記の値はR言語のpnorm関数で求まる。 0 Frequency • • • • • 0 20 40 rnorm(1e+06, 50, 10) 60 80 100
- 9. 背景 知らないことは 数回反復して経験して分かる • 1回だけの経験では分からないから。 • せいぜい3回も経験したら分かってしまった気になるこ ともある。(例 : 引越し、旅行、就職活動や結婚など) • いくつかの物品から欲しいものを探すときも、その行為に、数理的 にどういう意味があるのだろうか? • しかし、N=1,2,3 程度は統計学的な意味を成しているの だろうか? • そして、N=1の人と、N=30 の経験を知っている人とは、 どれだけ有利/不利の差があると言えるだろうか? • etc. ― 以上が本発表の問題意識 (上記の問いに、全て答える訳では無いです。)
- 10. 考察1 : • R言語が生成する乱数は、メルセンヌツイスターを 使っているので、(おそらく)精度が良い(はず)。 • 今回は100億個超の乱数を発生させた。 • R言語による計算は、30分程度以下の作業の繰り返し。 • 中央値を求める median関数に時間がかかったようだ。 • 今回見つけた数は、たまたまキリが良かった。 ひょっとしたら、何か法則性があるかもしれない。 • [要考察] コルモゴロフ=スミルノフの検定を用いると、大抵の分布 は、数十個の点をサンプリングしても、ガウス分布となかなか区 別がつかない。考えようによっては、何か考えたいことをガウス 分布に近似させることは、十分に意味がある。
- 11. 考察2 : • 日常生活や社会生活の上で、反復経験のご利益 がなぜあるか、ひとつの視点を与える、と考え られる。(例: 4回くらい経験のありそうな人の話は 1σ 話を差し引いて聞いた方が良い) • 「便利」な訳 : 記憶しやすい。知ってしまうと、 1週間に1回程度は、日常生活などで出会う(と 思われる)ため。 ― 半分冗談で、半分本気です!! • 標準偏差 σ を推定する問題、そもそも何を尺度にする かという問題については説明していないが、妥当で適 切な理屈はおそらく存在する。そして、未解決予想を 生み出す可能性を秘めている。
- 12. 参考1 : 本資料に用いた元の数表 "経験数" N 最大値の中央値 [下2桁の標準誤差(SD )] 最大値の 期待値 1 ― 0 0 4 10 30 110 111 510 511 512 513 514 515 • 算出に用いた 乱数の個数 M 41億 41億 51億 44億 44. 4億 122. 4億 174. 5億 102. 4億 513億 102. 8億 103億 0. 998 1 4 7 1. 498 8 0 2 1. 998 2 2 4 2. 495 892 2. 499 135 2. 998 102 2. 998 797 2. 999 237 2. 999 884 3. 000 461 3. 001 152 [2 7 ] [3 5 ] [4 6 ] [79] [84] [86] [63] [96] [43] [97] [99] 1. 02 1. 53 2. 04 2. 54 2. 54 3. 04 3. 04 3. 04 3. 04 3. 04 3. 04 93 67 27 15 47 27 27 27 44 50 56 “最大値の中央値” を 0.5刻みで変化させたときのNがどうなるかを考えようとして、たまたま発見した。 • 意味が解釈可能であって、たまたま、Nが2桁以下のときは全て、Nが記憶のしやすい数であった(4,10,30)。 • そのときの中央値も小数点以下第3位で切り捨てると、 0.5の整数倍から 0.002 少ない数であった(0.998, 1.498, 1.998)。 • • ちょうど0.5の整数倍にはならないので、それに最も近い数を追求していたら、上記のような数表となった。 • N=111, 511の場合は、小数点以下第3位で切り捨てると、 0.5の整数倍から 0.001 少ない数であった。 上記の表の誤差の可能性について • メモリの制約があったため、上記の数は、各Nについて、M個の乱数を、約1000万個ずつに分けて、さらにN個ずつに分けて最大値を求めて 中央値と平均値を求めて、さらにそれぞれ平均を求める、という複雑な操作を加えた。これに伴う誤差については、まだ正確に評価はしていない。
- 13. 参考2: 本資料に現れた N= 4, 10, 30, 111, 513 の数をそもそも、ど うやって思いつくかについては、下記のR言語による計 算がひとつのヒントになる。 > log(2)/(1-pnorm( seq(1,4,0.5)) ) [1] 4.368889 10.375336 30.467831 111.623919 513.481140 2979.623972 21885.696311 > -qnorm(log(2)/c(4,10,30,111,513)) [1] 0.9412562 1.4809142 1.9934718 2.4980137 2.9997144