SlideShare a Scribd company logo
IEEE PacificVis, Kobe, 2018-04-12
To Make Graphs Such As Scatter Plots
Numerically Readable Toshiyuki Shimono
The grids are crucial to understand the meaning.
Background : The conventional graphs usually lack the
numerical precision to be read meaningfully enough, although
they are useful to show numeric meanings such as the value
ranges and the correlation of variables which bare numbers
cannot do.
New way to plot: The author proposes putting various-
sized gridding-crosses in the graph background to allow human
eyes reading the number within an error of 0.5% of the graph
expansion without impairing the graph legibility.
Number data only A conventional graph New method
Numerical
readability
Each value can have
arbitrary precision.
The error in 5% of the max minus
min is usual w.r.t. the
coordinates (>_<)
The error in reading is within 0.5%
of the graph width or heights.
Readability
of meaning
Definitely behind the
graphs. Difficult to read
the whole quickly. (>_<)
Easy to see the up/down trends
by a line chart, the extension and
correlation from a scatter plot.
Almost good enough as the
conventional graphs to see the
numerical patterns.
0.0 0.2 0.4 0.6 0.8 1.0
0.0
0.2
0.4
0.6
0.8
1.0
x
y*0.7+x*0.3
a
b
c
d
e
f
g
h
i
j
k
l
m
n
o
p
q
r
s
t
u
v
w
x
x
y*0.7+x*0.3
a
b
c
d
e
f
g
h
i
j
k
l
m
n
o
p
q
r
s
t
u
v
w
x
0.00 0.25 0.50 0.75 1.00
0.00
0.25
0.50
0.75
1.00
(1) No grid (2) “Line” grids (3) “Cross” grids (4) 4x4 vs. 5x5
Can you read out the
coordinates of the 24 points? The grids with 3 different
densities help to read the
number with an error < 0.5%
The darkness reduced and the
distinction to other graph
objects becomes clearer.
Which intervals are simpler to
see: 20% or 25% on the axes?
Lorenz curve
Accumulative population rate
What percentage of money is used
by the top paying persons by credit cards?
Accumulativepaymentoccupation
TwitterFollowernumber
The Following number
The inverse function of
accumulative empirical
distribution function
Blue, green, orange : JPY paid
in 2016 via the credit card at the
age of 20, 40, 60 in Chugoku Region.
Thin black : all who are living in
Tokyo metropolitan area.
“Percentile Rank” in card number
PercentileinJapaneseYen(¥)paidin2016AD
The walls of
following
2,000
|←
Twitter
Celeb
habitat


96.2% of money is
from half of buyers.
76.8% of all is paid by
only 20% top buyers.
1e-06
1e-05
1e-04
0.001
0.01
0.1
0.5
0.9
0.99
0.001
0.01
0.1
0.5
0.9
0.99
0.999
0.9999
0.99999 Logit transformed
Lorenz curve
10% is from
0.55% users
1.1% is from
0.01% users
Lower10%
pays0.03%
GNU R plotted this graph
from cumulatively added
sum from 1.6x10⁸ records
on a table on BigQuery.
Both ends of the curve
are hidden to keep
privacy of the
customers.

More Related Content

What's hot

2nd ia Yuta Y
2nd ia Yuta Y2nd ia Yuta Y
2nd ia Yuta YYutaYama
 
Bar Graphs And Histograms
Bar Graphs And HistogramsBar Graphs And Histograms
Bar Graphs And Histogramsmmeddin
 
TIPS GUIDE - Mathematics EN
TIPS GUIDE - Mathematics ENTIPS GUIDE - Mathematics EN
TIPS GUIDE - Mathematics EN
Rafael Montero
 
Organizing and presenting data
Organizing and presenting dataOrganizing and presenting data
Organizing and presenting data
Grace Robledo
 
Data handling -
Data handling  -Data handling  -
Data handling -
Manpreet Singh
 
Presentation of Data - How to Construct Graphs
Presentation of Data - How to Construct GraphsPresentation of Data - How to Construct Graphs
Presentation of Data - How to Construct Graphs
sheisirenebkm
 
Visual Explanations with Graphs
Visual Explanations with GraphsVisual Explanations with Graphs
Visual Explanations with Graphs
Connie Malamed
 
Data handling
Data handlingData handling
Data handling
Advetya Pillai
 
Data handling class 8th
Data handling class 8thData handling class 8th
Data handling class 8th
Sanjay Thakran
 
Data handling ppt for class 7th
Data handling ppt for class 7thData handling ppt for class 7th
Data handling ppt for class 7th
Sarah Ajmal
 
Graphic aids 5 graphs A lecture By Allah Dad Khan VP The University Of Agric...
Graphic aids 5 graphs A lecture  By Allah Dad Khan VP The University Of Agric...Graphic aids 5 graphs A lecture  By Allah Dad Khan VP The University Of Agric...
Graphic aids 5 graphs A lecture By Allah Dad Khan VP The University Of Agric...
Mr.Allah Dad Khan
 
Bar chart
Bar chartBar chart
Bar chart
DrGhadooRa
 
Advantages and Limitations for Diagrams and Graphs
Advantages and Limitations for Diagrams and GraphsAdvantages and Limitations for Diagrams and Graphs
Advantages and Limitations for Diagrams and Graphs
Hardik Bhaavani
 
Assesment in education
Assesment in educationAssesment in education
Assesment in education
annathomas123
 
What is Line Graph
What is Line GraphWhat is Line Graph
What is Line Graph
Asad Afridi
 
Advanced excel
Advanced excelAdvanced excel
Advanced excel
PremananthamM
 
Diagrammatic and Graphical Representation of Data in Statistics
Diagrammatic and Graphical Representation of Data in StatisticsDiagrammatic and Graphical Representation of Data in Statistics
Diagrammatic and Graphical Representation of Data in Statistics
Asha Dhilip
 
An Educational PPT on Handling data
An Educational PPT on Handling dataAn Educational PPT on Handling data
An Educational PPT on Handling data
Bhartendu Jain
 

What's hot (19)

2nd ia Yuta Y
2nd ia Yuta Y2nd ia Yuta Y
2nd ia Yuta Y
 
Bar Graphs And Histograms
Bar Graphs And HistogramsBar Graphs And Histograms
Bar Graphs And Histograms
 
TIPS GUIDE - Mathematics EN
TIPS GUIDE - Mathematics ENTIPS GUIDE - Mathematics EN
TIPS GUIDE - Mathematics EN
 
Organizing and presenting data
Organizing and presenting dataOrganizing and presenting data
Organizing and presenting data
 
Data handling -
Data handling  -Data handling  -
Data handling -
 
Presentation of Data - How to Construct Graphs
Presentation of Data - How to Construct GraphsPresentation of Data - How to Construct Graphs
Presentation of Data - How to Construct Graphs
 
Visual Explanations with Graphs
Visual Explanations with GraphsVisual Explanations with Graphs
Visual Explanations with Graphs
 
Data handling
Data handlingData handling
Data handling
 
Data handling class 8th
Data handling class 8thData handling class 8th
Data handling class 8th
 
Data handling ppt for class 7th
Data handling ppt for class 7thData handling ppt for class 7th
Data handling ppt for class 7th
 
Graphic aids 5 graphs A lecture By Allah Dad Khan VP The University Of Agric...
Graphic aids 5 graphs A lecture  By Allah Dad Khan VP The University Of Agric...Graphic aids 5 graphs A lecture  By Allah Dad Khan VP The University Of Agric...
Graphic aids 5 graphs A lecture By Allah Dad Khan VP The University Of Agric...
 
Bar chart
Bar chartBar chart
Bar chart
 
Advantages and Limitations for Diagrams and Graphs
Advantages and Limitations for Diagrams and GraphsAdvantages and Limitations for Diagrams and Graphs
Advantages and Limitations for Diagrams and Graphs
 
Data handling
Data handlingData handling
Data handling
 
Assesment in education
Assesment in educationAssesment in education
Assesment in education
 
What is Line Graph
What is Line GraphWhat is Line Graph
What is Line Graph
 
Advanced excel
Advanced excelAdvanced excel
Advanced excel
 
Diagrammatic and Graphical Representation of Data in Statistics
Diagrammatic and Graphical Representation of Data in StatisticsDiagrammatic and Graphical Representation of Data in Statistics
Diagrammatic and Graphical Representation of Data in Statistics
 
An Educational PPT on Handling data
An Educational PPT on Handling dataAn Educational PPT on Handling data
An Educational PPT on Handling data
 

Similar to To Make Graphs Such as Scatter Plots Numerically Readable (PacificVis 2018, Kobe, Poster)

Graphicalrepresntationofdatausingstatisticaltools2019_210902_105156.pdf
Graphicalrepresntationofdatausingstatisticaltools2019_210902_105156.pdfGraphicalrepresntationofdatausingstatisticaltools2019_210902_105156.pdf
Graphicalrepresntationofdatausingstatisticaltools2019_210902_105156.pdf
Himakshi7
 
Lecture 2-PPT.pdf
Lecture 2-PPT.pdfLecture 2-PPT.pdf
Lecture 2-PPT.pdf
RAJKAMAL282
 
Lecture 2-PPT statistics.pdf
Lecture 2-PPT statistics.pdfLecture 2-PPT statistics.pdf
Lecture 2-PPT statistics.pdf
DrSJayashree
 
Graphs in Biostatistics
Graphs in Biostatistics Graphs in Biostatistics
Graphs in Biostatistics
Shagufta Farooqui
 
Graphs and Charts in Excel.pptx
Graphs and Charts in Excel.pptxGraphs and Charts in Excel.pptx
Graphs and Charts in Excel.pptx
RachitSuri2
 
Diowane2003
Diowane2003Diowane2003
Diowane2003SFYC
 
Different types of charts
Different types of chartsDifferent types of charts
Different types of charts
Zakaria Salim
 
Geographical Skills
Geographical SkillsGeographical Skills
Geographical Skillsclemaitre
 
Numerical and statistical methods new
Numerical and statistical methods newNumerical and statistical methods new
Numerical and statistical methods new
Aabha Tiwari
 
Graphs and chars
Graphs and charsGraphs and chars
Graphs and chars
salemhusin
 
QQ Plot.pptx
QQ Plot.pptxQQ Plot.pptx
QQ Plot.pptx
Rahul Borate
 
Graphing
GraphingGraphing
Graphing
Sr Edith Bogue
 
17545489052556.pdf
17545489052556.pdf17545489052556.pdf
17545489052556.pdf
Ashish Gupta
 
Graphical Representation of Statistical data
Graphical Representation of Statistical dataGraphical Representation of Statistical data
Graphical Representation of Statistical data
MD SAMSER
 
Graphical Representation of data
Graphical Representation of dataGraphical Representation of data
Graphical Representation of data
Jijo K Mathew
 
Quantitative techniques in business
Quantitative techniques in businessQuantitative techniques in business
Quantitative techniques in business
sameer sheikh
 
Chapter 2 Graphical Descriptions of Data 25 Chapter 2.docx
Chapter 2 Graphical Descriptions of Data 25 Chapter 2.docxChapter 2 Graphical Descriptions of Data 25 Chapter 2.docx
Chapter 2 Graphical Descriptions of Data 25 Chapter 2.docx
cravennichole326
 
DATA VISUALIZATION
DATA VISUALIZATIONDATA VISUALIZATION
DATA VISUALIZATION
Aabhika Samantaray
 
Graphs, charts, and tables ppt @ bec doms
Graphs, charts, and tables ppt @ bec domsGraphs, charts, and tables ppt @ bec doms
Graphs, charts, and tables ppt @ bec doms
Babasab Patil
 
Exploi Exploratory Data Analysis.pdf
Exploi Exploratory Data Analysis.pdfExploi Exploratory Data Analysis.pdf
Exploi Exploratory Data Analysis.pdf
21CS031MouneshT
 

Similar to To Make Graphs Such as Scatter Plots Numerically Readable (PacificVis 2018, Kobe, Poster) (20)

Graphicalrepresntationofdatausingstatisticaltools2019_210902_105156.pdf
Graphicalrepresntationofdatausingstatisticaltools2019_210902_105156.pdfGraphicalrepresntationofdatausingstatisticaltools2019_210902_105156.pdf
Graphicalrepresntationofdatausingstatisticaltools2019_210902_105156.pdf
 
Lecture 2-PPT.pdf
Lecture 2-PPT.pdfLecture 2-PPT.pdf
Lecture 2-PPT.pdf
 
Lecture 2-PPT statistics.pdf
Lecture 2-PPT statistics.pdfLecture 2-PPT statistics.pdf
Lecture 2-PPT statistics.pdf
 
Graphs in Biostatistics
Graphs in Biostatistics Graphs in Biostatistics
Graphs in Biostatistics
 
Graphs and Charts in Excel.pptx
Graphs and Charts in Excel.pptxGraphs and Charts in Excel.pptx
Graphs and Charts in Excel.pptx
 
Diowane2003
Diowane2003Diowane2003
Diowane2003
 
Different types of charts
Different types of chartsDifferent types of charts
Different types of charts
 
Geographical Skills
Geographical SkillsGeographical Skills
Geographical Skills
 
Numerical and statistical methods new
Numerical and statistical methods newNumerical and statistical methods new
Numerical and statistical methods new
 
Graphs and chars
Graphs and charsGraphs and chars
Graphs and chars
 
QQ Plot.pptx
QQ Plot.pptxQQ Plot.pptx
QQ Plot.pptx
 
Graphing
GraphingGraphing
Graphing
 
17545489052556.pdf
17545489052556.pdf17545489052556.pdf
17545489052556.pdf
 
Graphical Representation of Statistical data
Graphical Representation of Statistical dataGraphical Representation of Statistical data
Graphical Representation of Statistical data
 
Graphical Representation of data
Graphical Representation of dataGraphical Representation of data
Graphical Representation of data
 
Quantitative techniques in business
Quantitative techniques in businessQuantitative techniques in business
Quantitative techniques in business
 
Chapter 2 Graphical Descriptions of Data 25 Chapter 2.docx
Chapter 2 Graphical Descriptions of Data 25 Chapter 2.docxChapter 2 Graphical Descriptions of Data 25 Chapter 2.docx
Chapter 2 Graphical Descriptions of Data 25 Chapter 2.docx
 
DATA VISUALIZATION
DATA VISUALIZATIONDATA VISUALIZATION
DATA VISUALIZATION
 
Graphs, charts, and tables ppt @ bec doms
Graphs, charts, and tables ppt @ bec domsGraphs, charts, and tables ppt @ bec doms
Graphs, charts, and tables ppt @ bec doms
 
Exploi Exploratory Data Analysis.pdf
Exploi Exploratory Data Analysis.pdfExploi Exploratory Data Analysis.pdf
Exploi Exploratory Data Analysis.pdf
 

More from Toshiyuki Shimono

国際産業数理・応用数理会議のポスター(作成中)
国際産業数理・応用数理会議のポスター(作成中)国際産業数理・応用数理会議のポスター(作成中)
国際産業数理・応用数理会議のポスター(作成中)
Toshiyuki Shimono
 
インターネット等からデータを自動収集するソフトウェアに必要な補助機能とその実装
インターネット等からデータを自動収集するソフトウェアに必要な補助機能とその実装インターネット等からデータを自動収集するソフトウェアに必要な補助機能とその実装
インターネット等からデータを自動収集するソフトウェアに必要な補助機能とその実装
Toshiyuki Shimono
 
extracting only a necessary file from a zip file
extracting only a necessary file from a zip fileextracting only a necessary file from a zip file
extracting only a necessary file from a zip file
Toshiyuki Shimono
 
A Hacking Toolset for Big Tabular Files -- JAPAN.PM 2021
A Hacking Toolset for Big Tabular Files -- JAPAN.PM 2021A Hacking Toolset for Big Tabular Files -- JAPAN.PM 2021
A Hacking Toolset for Big Tabular Files -- JAPAN.PM 2021
Toshiyuki Shimono
 
新型コロナの感染者数 全国の状況 2021年2月上旬まで
新型コロナの感染者数 全国の状況 2021年2月上旬まで新型コロナの感染者数 全国の状況 2021年2月上旬まで
新型コロナの感染者数 全国の状況 2021年2月上旬まで
Toshiyuki Shimono
 
Multiplicative Decompositions of Stochastic Distributions and Their Applicat...
 Multiplicative Decompositions of Stochastic Distributions and Their Applicat... Multiplicative Decompositions of Stochastic Distributions and Their Applicat...
Multiplicative Decompositions of Stochastic Distributions and Their Applicat...
Toshiyuki Shimono
 
Theory to consider an inaccurate testing and how to determine the prior proba...
Theory to consider an inaccurate testing and how to determine the prior proba...Theory to consider an inaccurate testing and how to determine the prior proba...
Theory to consider an inaccurate testing and how to determine the prior proba...
Toshiyuki Shimono
 
Interpreting Multiple Regression via an Ellipse Inscribed in a Square Extensi...
Interpreting Multiple Regressionvia an Ellipse Inscribed in a Square Extensi...Interpreting Multiple Regressionvia an Ellipse Inscribed in a Square Extensi...
Interpreting Multiple Regression via an Ellipse Inscribed in a Square Extensi...
Toshiyuki Shimono
 
Sqlgen190412.pdf
Sqlgen190412.pdfSqlgen190412.pdf
Sqlgen190412.pdf
Toshiyuki Shimono
 
BigQueryを使ってみた(2018年2月)
BigQueryを使ってみた(2018年2月)BigQueryを使ってみた(2018年2月)
BigQueryを使ってみた(2018年2月)
Toshiyuki Shimono
 
Seminar0917
Seminar0917Seminar0917
Seminar0917
Toshiyuki Shimono
 
既存分析ソフトへ
データを投入する前に
簡便な分析するためのソフトの作り方の提案
既存分析ソフトへ
データを投入する前に
簡便な分析するためのソフトの作り方の提案既存分析ソフトへ
データを投入する前に
簡便な分析するためのソフトの作り方の提案
既存分析ソフトへ
データを投入する前に
簡便な分析するためのソフトの作り方の提案
Toshiyuki Shimono
 
Make Accumulated Data in Companies Eloquent by SQL Statement Constructors (PDF)
Make Accumulated Data in Companies Eloquent by SQL Statement Constructors (PDF)Make Accumulated Data in Companies Eloquent by SQL Statement Constructors (PDF)
Make Accumulated Data in Companies Eloquent by SQL Statement Constructors (PDF)
Toshiyuki Shimono
 
企業等に蓄積されたデータを分析するための処理機能の提案
企業等に蓄積されたデータを分析するための処理機能の提案企業等に蓄積されたデータを分析するための処理機能の提案
企業等に蓄積されたデータを分析するための処理機能の提案
Toshiyuki Shimono
 
新入社員の頃に教えて欲しかったようなことなど
新入社員の頃に教えて欲しかったようなことなど新入社員の頃に教えて欲しかったようなことなど
新入社員の頃に教えて欲しかったようなことなど
Toshiyuki Shimono
 
ページャ lessを使いこなす
ページャ lessを使いこなすページャ lessを使いこなす
ページャ lessを使いこなす
Toshiyuki Shimono
 
Guiを使わないテキストデータ処理
Guiを使わないテキストデータ処理Guiを使わないテキストデータ処理
Guiを使わないテキストデータ処理
Toshiyuki Shimono
 
データ全貌把握の方法170324
データ全貌把握の方法170324データ全貌把握の方法170324
データ全貌把握の方法170324
Toshiyuki Shimono
 
Macで開発環境を整える170420
Macで開発環境を整える170420Macで開発環境を整える170420
Macで開発環境を整える170420
Toshiyuki Shimono
 
大きなテキストデータを閲覧するには
大きなテキストデータを閲覧するには大きなテキストデータを閲覧するには
大きなテキストデータを閲覧するには
Toshiyuki Shimono
 

More from Toshiyuki Shimono (20)

国際産業数理・応用数理会議のポスター(作成中)
国際産業数理・応用数理会議のポスター(作成中)国際産業数理・応用数理会議のポスター(作成中)
国際産業数理・応用数理会議のポスター(作成中)
 
インターネット等からデータを自動収集するソフトウェアに必要な補助機能とその実装
インターネット等からデータを自動収集するソフトウェアに必要な補助機能とその実装インターネット等からデータを自動収集するソフトウェアに必要な補助機能とその実装
インターネット等からデータを自動収集するソフトウェアに必要な補助機能とその実装
 
extracting only a necessary file from a zip file
extracting only a necessary file from a zip fileextracting only a necessary file from a zip file
extracting only a necessary file from a zip file
 
A Hacking Toolset for Big Tabular Files -- JAPAN.PM 2021
A Hacking Toolset for Big Tabular Files -- JAPAN.PM 2021A Hacking Toolset for Big Tabular Files -- JAPAN.PM 2021
A Hacking Toolset for Big Tabular Files -- JAPAN.PM 2021
 
新型コロナの感染者数 全国の状況 2021年2月上旬まで
新型コロナの感染者数 全国の状況 2021年2月上旬まで新型コロナの感染者数 全国の状況 2021年2月上旬まで
新型コロナの感染者数 全国の状況 2021年2月上旬まで
 
Multiplicative Decompositions of Stochastic Distributions and Their Applicat...
 Multiplicative Decompositions of Stochastic Distributions and Their Applicat... Multiplicative Decompositions of Stochastic Distributions and Their Applicat...
Multiplicative Decompositions of Stochastic Distributions and Their Applicat...
 
Theory to consider an inaccurate testing and how to determine the prior proba...
Theory to consider an inaccurate testing and how to determine the prior proba...Theory to consider an inaccurate testing and how to determine the prior proba...
Theory to consider an inaccurate testing and how to determine the prior proba...
 
Interpreting Multiple Regression via an Ellipse Inscribed in a Square Extensi...
Interpreting Multiple Regressionvia an Ellipse Inscribed in a Square Extensi...Interpreting Multiple Regressionvia an Ellipse Inscribed in a Square Extensi...
Interpreting Multiple Regression via an Ellipse Inscribed in a Square Extensi...
 
Sqlgen190412.pdf
Sqlgen190412.pdfSqlgen190412.pdf
Sqlgen190412.pdf
 
BigQueryを使ってみた(2018年2月)
BigQueryを使ってみた(2018年2月)BigQueryを使ってみた(2018年2月)
BigQueryを使ってみた(2018年2月)
 
Seminar0917
Seminar0917Seminar0917
Seminar0917
 
既存分析ソフトへ
データを投入する前に
簡便な分析するためのソフトの作り方の提案
既存分析ソフトへ
データを投入する前に
簡便な分析するためのソフトの作り方の提案既存分析ソフトへ
データを投入する前に
簡便な分析するためのソフトの作り方の提案
既存分析ソフトへ
データを投入する前に
簡便な分析するためのソフトの作り方の提案
 
Make Accumulated Data in Companies Eloquent by SQL Statement Constructors (PDF)
Make Accumulated Data in Companies Eloquent by SQL Statement Constructors (PDF)Make Accumulated Data in Companies Eloquent by SQL Statement Constructors (PDF)
Make Accumulated Data in Companies Eloquent by SQL Statement Constructors (PDF)
 
企業等に蓄積されたデータを分析するための処理機能の提案
企業等に蓄積されたデータを分析するための処理機能の提案企業等に蓄積されたデータを分析するための処理機能の提案
企業等に蓄積されたデータを分析するための処理機能の提案
 
新入社員の頃に教えて欲しかったようなことなど
新入社員の頃に教えて欲しかったようなことなど新入社員の頃に教えて欲しかったようなことなど
新入社員の頃に教えて欲しかったようなことなど
 
ページャ lessを使いこなす
ページャ lessを使いこなすページャ lessを使いこなす
ページャ lessを使いこなす
 
Guiを使わないテキストデータ処理
Guiを使わないテキストデータ処理Guiを使わないテキストデータ処理
Guiを使わないテキストデータ処理
 
データ全貌把握の方法170324
データ全貌把握の方法170324データ全貌把握の方法170324
データ全貌把握の方法170324
 
Macで開発環境を整える170420
Macで開発環境を整える170420Macで開発環境を整える170420
Macで開発環境を整える170420
 
大きなテキストデータを閲覧するには
大きなテキストデータを閲覧するには大きなテキストデータを閲覧するには
大きなテキストデータを閲覧するには
 

Recently uploaded

Chatty Kathy - UNC Bootcamp Final Project Presentation - Final Version - 5.23...
Chatty Kathy - UNC Bootcamp Final Project Presentation - Final Version - 5.23...Chatty Kathy - UNC Bootcamp Final Project Presentation - Final Version - 5.23...
Chatty Kathy - UNC Bootcamp Final Project Presentation - Final Version - 5.23...
John Andrews
 
Data_and_Analytics_Essentials_Architect_an_Analytics_Platform.pptx
Data_and_Analytics_Essentials_Architect_an_Analytics_Platform.pptxData_and_Analytics_Essentials_Architect_an_Analytics_Platform.pptx
Data_and_Analytics_Essentials_Architect_an_Analytics_Platform.pptx
AnirbanRoy608946
 
Enhanced Enterprise Intelligence with your personal AI Data Copilot.pdf
Enhanced Enterprise Intelligence with your personal AI Data Copilot.pdfEnhanced Enterprise Intelligence with your personal AI Data Copilot.pdf
Enhanced Enterprise Intelligence with your personal AI Data Copilot.pdf
GetInData
 
06-04-2024 - NYC Tech Week - Discussion on Vector Databases, Unstructured Dat...
06-04-2024 - NYC Tech Week - Discussion on Vector Databases, Unstructured Dat...06-04-2024 - NYC Tech Week - Discussion on Vector Databases, Unstructured Dat...
06-04-2024 - NYC Tech Week - Discussion on Vector Databases, Unstructured Dat...
Timothy Spann
 
原版制作(Deakin毕业证书)迪肯大学毕业证学位证一模一样
原版制作(Deakin毕业证书)迪肯大学毕业证学位证一模一样原版制作(Deakin毕业证书)迪肯大学毕业证学位证一模一样
原版制作(Deakin毕业证书)迪肯大学毕业证学位证一模一样
u86oixdj
 
原版制作(swinburne毕业证书)斯威本科技大学毕业证毕业完成信一模一样
原版制作(swinburne毕业证书)斯威本科技大学毕业证毕业完成信一模一样原版制作(swinburne毕业证书)斯威本科技大学毕业证毕业完成信一模一样
原版制作(swinburne毕业证书)斯威本科技大学毕业证毕业完成信一模一样
u86oixdj
 
Algorithmic optimizations for Dynamic Levelwise PageRank (from STICD) : SHORT...
Algorithmic optimizations for Dynamic Levelwise PageRank (from STICD) : SHORT...Algorithmic optimizations for Dynamic Levelwise PageRank (from STICD) : SHORT...
Algorithmic optimizations for Dynamic Levelwise PageRank (from STICD) : SHORT...
Subhajit Sahu
 
一比一原版(Bradford毕业证书)布拉德福德大学毕业证如何办理
一比一原版(Bradford毕业证书)布拉德福德大学毕业证如何办理一比一原版(Bradford毕业证书)布拉德福德大学毕业证如何办理
一比一原版(Bradford毕业证书)布拉德福德大学毕业证如何办理
mbawufebxi
 
Levelwise PageRank with Loop-Based Dead End Handling Strategy : SHORT REPORT ...
Levelwise PageRank with Loop-Based Dead End Handling Strategy : SHORT REPORT ...Levelwise PageRank with Loop-Based Dead End Handling Strategy : SHORT REPORT ...
Levelwise PageRank with Loop-Based Dead End Handling Strategy : SHORT REPORT ...
Subhajit Sahu
 
一比一原版(UIUC毕业证)伊利诺伊大学|厄巴纳-香槟分校毕业证如何办理
一比一原版(UIUC毕业证)伊利诺伊大学|厄巴纳-香槟分校毕业证如何办理一比一原版(UIUC毕业证)伊利诺伊大学|厄巴纳-香槟分校毕业证如何办理
一比一原版(UIUC毕业证)伊利诺伊大学|厄巴纳-香槟分校毕业证如何办理
ahzuo
 
Best best suvichar in gujarati english meaning of this sentence as Silk road ...
Best best suvichar in gujarati english meaning of this sentence as Silk road ...Best best suvichar in gujarati english meaning of this sentence as Silk road ...
Best best suvichar in gujarati english meaning of this sentence as Silk road ...
AbhimanyuSinha9
 
Nanandann Nilekani's ppt On India's .pdf
Nanandann Nilekani's ppt On India's .pdfNanandann Nilekani's ppt On India's .pdf
Nanandann Nilekani's ppt On India's .pdf
eddie19851
 
Influence of Marketing Strategy and Market Competition on Business Plan
Influence of Marketing Strategy and Market Competition on Business PlanInfluence of Marketing Strategy and Market Competition on Business Plan
Influence of Marketing Strategy and Market Competition on Business Plan
jerlynmaetalle
 
一比一原版(BCU毕业证书)伯明翰城市大学毕业证如何办理
一比一原版(BCU毕业证书)伯明翰城市大学毕业证如何办理一比一原版(BCU毕业证书)伯明翰城市大学毕业证如何办理
一比一原版(BCU毕业证书)伯明翰城市大学毕业证如何办理
dwreak4tg
 
一比一原版(Dalhousie毕业证书)达尔豪斯大学毕业证如何办理
一比一原版(Dalhousie毕业证书)达尔豪斯大学毕业证如何办理一比一原版(Dalhousie毕业证书)达尔豪斯大学毕业证如何办理
一比一原版(Dalhousie毕业证书)达尔豪斯大学毕业证如何办理
mzpolocfi
 
一比一原版(UniSA毕业证书)南澳大学毕业证如何办理
一比一原版(UniSA毕业证书)南澳大学毕业证如何办理一比一原版(UniSA毕业证书)南澳大学毕业证如何办理
一比一原版(UniSA毕业证书)南澳大学毕业证如何办理
slg6lamcq
 
一比一原版(Coventry毕业证书)考文垂大学毕业证如何办理
一比一原版(Coventry毕业证书)考文垂大学毕业证如何办理一比一原版(Coventry毕业证书)考文垂大学毕业证如何办理
一比一原版(Coventry毕业证书)考文垂大学毕业证如何办理
74nqk8xf
 
做(mqu毕业证书)麦考瑞大学毕业证硕士文凭证书学费发票原版一模一样
做(mqu毕业证书)麦考瑞大学毕业证硕士文凭证书学费发票原版一模一样做(mqu毕业证书)麦考瑞大学毕业证硕士文凭证书学费发票原版一模一样
做(mqu毕业证书)麦考瑞大学毕业证硕士文凭证书学费发票原版一模一样
axoqas
 
一比一原版(CBU毕业证)卡普顿大学毕业证如何办理
一比一原版(CBU毕业证)卡普顿大学毕业证如何办理一比一原版(CBU毕业证)卡普顿大学毕业证如何办理
一比一原版(CBU毕业证)卡普顿大学毕业证如何办理
ahzuo
 
Machine learning and optimization techniques for electrical drives.pptx
Machine learning and optimization techniques for electrical drives.pptxMachine learning and optimization techniques for electrical drives.pptx
Machine learning and optimization techniques for electrical drives.pptx
balafet
 

Recently uploaded (20)

Chatty Kathy - UNC Bootcamp Final Project Presentation - Final Version - 5.23...
Chatty Kathy - UNC Bootcamp Final Project Presentation - Final Version - 5.23...Chatty Kathy - UNC Bootcamp Final Project Presentation - Final Version - 5.23...
Chatty Kathy - UNC Bootcamp Final Project Presentation - Final Version - 5.23...
 
Data_and_Analytics_Essentials_Architect_an_Analytics_Platform.pptx
Data_and_Analytics_Essentials_Architect_an_Analytics_Platform.pptxData_and_Analytics_Essentials_Architect_an_Analytics_Platform.pptx
Data_and_Analytics_Essentials_Architect_an_Analytics_Platform.pptx
 
Enhanced Enterprise Intelligence with your personal AI Data Copilot.pdf
Enhanced Enterprise Intelligence with your personal AI Data Copilot.pdfEnhanced Enterprise Intelligence with your personal AI Data Copilot.pdf
Enhanced Enterprise Intelligence with your personal AI Data Copilot.pdf
 
06-04-2024 - NYC Tech Week - Discussion on Vector Databases, Unstructured Dat...
06-04-2024 - NYC Tech Week - Discussion on Vector Databases, Unstructured Dat...06-04-2024 - NYC Tech Week - Discussion on Vector Databases, Unstructured Dat...
06-04-2024 - NYC Tech Week - Discussion on Vector Databases, Unstructured Dat...
 
原版制作(Deakin毕业证书)迪肯大学毕业证学位证一模一样
原版制作(Deakin毕业证书)迪肯大学毕业证学位证一模一样原版制作(Deakin毕业证书)迪肯大学毕业证学位证一模一样
原版制作(Deakin毕业证书)迪肯大学毕业证学位证一模一样
 
原版制作(swinburne毕业证书)斯威本科技大学毕业证毕业完成信一模一样
原版制作(swinburne毕业证书)斯威本科技大学毕业证毕业完成信一模一样原版制作(swinburne毕业证书)斯威本科技大学毕业证毕业完成信一模一样
原版制作(swinburne毕业证书)斯威本科技大学毕业证毕业完成信一模一样
 
Algorithmic optimizations for Dynamic Levelwise PageRank (from STICD) : SHORT...
Algorithmic optimizations for Dynamic Levelwise PageRank (from STICD) : SHORT...Algorithmic optimizations for Dynamic Levelwise PageRank (from STICD) : SHORT...
Algorithmic optimizations for Dynamic Levelwise PageRank (from STICD) : SHORT...
 
一比一原版(Bradford毕业证书)布拉德福德大学毕业证如何办理
一比一原版(Bradford毕业证书)布拉德福德大学毕业证如何办理一比一原版(Bradford毕业证书)布拉德福德大学毕业证如何办理
一比一原版(Bradford毕业证书)布拉德福德大学毕业证如何办理
 
Levelwise PageRank with Loop-Based Dead End Handling Strategy : SHORT REPORT ...
Levelwise PageRank with Loop-Based Dead End Handling Strategy : SHORT REPORT ...Levelwise PageRank with Loop-Based Dead End Handling Strategy : SHORT REPORT ...
Levelwise PageRank with Loop-Based Dead End Handling Strategy : SHORT REPORT ...
 
一比一原版(UIUC毕业证)伊利诺伊大学|厄巴纳-香槟分校毕业证如何办理
一比一原版(UIUC毕业证)伊利诺伊大学|厄巴纳-香槟分校毕业证如何办理一比一原版(UIUC毕业证)伊利诺伊大学|厄巴纳-香槟分校毕业证如何办理
一比一原版(UIUC毕业证)伊利诺伊大学|厄巴纳-香槟分校毕业证如何办理
 
Best best suvichar in gujarati english meaning of this sentence as Silk road ...
Best best suvichar in gujarati english meaning of this sentence as Silk road ...Best best suvichar in gujarati english meaning of this sentence as Silk road ...
Best best suvichar in gujarati english meaning of this sentence as Silk road ...
 
Nanandann Nilekani's ppt On India's .pdf
Nanandann Nilekani's ppt On India's .pdfNanandann Nilekani's ppt On India's .pdf
Nanandann Nilekani's ppt On India's .pdf
 
Influence of Marketing Strategy and Market Competition on Business Plan
Influence of Marketing Strategy and Market Competition on Business PlanInfluence of Marketing Strategy and Market Competition on Business Plan
Influence of Marketing Strategy and Market Competition on Business Plan
 
一比一原版(BCU毕业证书)伯明翰城市大学毕业证如何办理
一比一原版(BCU毕业证书)伯明翰城市大学毕业证如何办理一比一原版(BCU毕业证书)伯明翰城市大学毕业证如何办理
一比一原版(BCU毕业证书)伯明翰城市大学毕业证如何办理
 
一比一原版(Dalhousie毕业证书)达尔豪斯大学毕业证如何办理
一比一原版(Dalhousie毕业证书)达尔豪斯大学毕业证如何办理一比一原版(Dalhousie毕业证书)达尔豪斯大学毕业证如何办理
一比一原版(Dalhousie毕业证书)达尔豪斯大学毕业证如何办理
 
一比一原版(UniSA毕业证书)南澳大学毕业证如何办理
一比一原版(UniSA毕业证书)南澳大学毕业证如何办理一比一原版(UniSA毕业证书)南澳大学毕业证如何办理
一比一原版(UniSA毕业证书)南澳大学毕业证如何办理
 
一比一原版(Coventry毕业证书)考文垂大学毕业证如何办理
一比一原版(Coventry毕业证书)考文垂大学毕业证如何办理一比一原版(Coventry毕业证书)考文垂大学毕业证如何办理
一比一原版(Coventry毕业证书)考文垂大学毕业证如何办理
 
做(mqu毕业证书)麦考瑞大学毕业证硕士文凭证书学费发票原版一模一样
做(mqu毕业证书)麦考瑞大学毕业证硕士文凭证书学费发票原版一模一样做(mqu毕业证书)麦考瑞大学毕业证硕士文凭证书学费发票原版一模一样
做(mqu毕业证书)麦考瑞大学毕业证硕士文凭证书学费发票原版一模一样
 
一比一原版(CBU毕业证)卡普顿大学毕业证如何办理
一比一原版(CBU毕业证)卡普顿大学毕业证如何办理一比一原版(CBU毕业证)卡普顿大学毕业证如何办理
一比一原版(CBU毕业证)卡普顿大学毕业证如何办理
 
Machine learning and optimization techniques for electrical drives.pptx
Machine learning and optimization techniques for electrical drives.pptxMachine learning and optimization techniques for electrical drives.pptx
Machine learning and optimization techniques for electrical drives.pptx
 

To Make Graphs Such as Scatter Plots Numerically Readable (PacificVis 2018, Kobe, Poster)

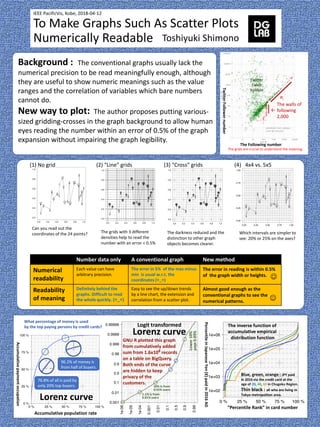
  • 1. IEEE PacificVis, Kobe, 2018-04-12 To Make Graphs Such As Scatter Plots Numerically Readable Toshiyuki Shimono The grids are crucial to understand the meaning. Background : The conventional graphs usually lack the numerical precision to be read meaningfully enough, although they are useful to show numeric meanings such as the value ranges and the correlation of variables which bare numbers cannot do. New way to plot: The author proposes putting various- sized gridding-crosses in the graph background to allow human eyes reading the number within an error of 0.5% of the graph expansion without impairing the graph legibility. Number data only A conventional graph New method Numerical readability Each value can have arbitrary precision. The error in 5% of the max minus min is usual w.r.t. the coordinates (>_<) The error in reading is within 0.5% of the graph width or heights. Readability of meaning Definitely behind the graphs. Difficult to read the whole quickly. (>_<) Easy to see the up/down trends by a line chart, the extension and correlation from a scatter plot. Almost good enough as the conventional graphs to see the numerical patterns. 0.0 0.2 0.4 0.6 0.8 1.0 0.0 0.2 0.4 0.6 0.8 1.0 x y*0.7+x*0.3 a b c d e f g h i j k l m n o p q r s t u v w x x y*0.7+x*0.3 a b c d e f g h i j k l m n o p q r s t u v w x 0.00 0.25 0.50 0.75 1.00 0.00 0.25 0.50 0.75 1.00 (1) No grid (2) “Line” grids (3) “Cross” grids (4) 4x4 vs. 5x5 Can you read out the coordinates of the 24 points? The grids with 3 different densities help to read the number with an error < 0.5% The darkness reduced and the distinction to other graph objects becomes clearer. Which intervals are simpler to see: 20% or 25% on the axes? Lorenz curve Accumulative population rate What percentage of money is used by the top paying persons by credit cards? Accumulativepaymentoccupation TwitterFollowernumber The Following number The inverse function of accumulative empirical distribution function Blue, green, orange : JPY paid in 2016 via the credit card at the age of 20, 40, 60 in Chugoku Region. Thin black : all who are living in Tokyo metropolitan area. “Percentile Rank” in card number PercentileinJapaneseYen(¥)paidin2016AD The walls of following 2,000 |← Twitter Celeb habitat   96.2% of money is from half of buyers. 76.8% of all is paid by only 20% top buyers. 1e-06 1e-05 1e-04 0.001 0.01 0.1 0.5 0.9 0.99 0.001 0.01 0.1 0.5 0.9 0.99 0.999 0.9999 0.99999 Logit transformed Lorenz curve 10% is from 0.55% users 1.1% is from 0.01% users Lower10% pays0.03% GNU R plotted this graph from cumulatively added sum from 1.6x10⁸ records on a table on BigQuery. Both ends of the curve are hidden to keep privacy of the customers.