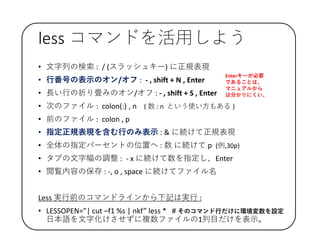
Despite the existence of data analysis tools such as R, SQL, Excel and others, it is still insufficient to cope with today's big data analysis needs.
The author proposes a CUI (Character User Interface) toolset with dozens of functions to neatly handle tabular data in TSV (Tab Separated Values) files.
It implements many basic and useful functions that have not been implemented in existing software with each function borrowing the ideas of Unix philosophy and covering the most frequent pre-analysis tasks during the initial exploratory stage of data analysis projects.
Also, it greatly speeds up basic analysis tasks, such as drawing cross tables, Venn diagrams, etc., while existing software inevitably requires rather complicated programming and debugging processes for even these basic tasks.
Here, tabular data mainly means TSV (Tab-Separated Values) files as well as other CSV (Comma Separated Value)-type files which are all widely used for storing data and suitable for data analysis.
PDF版 世界中のゲーム分析をしてきたPlayFabが大進化!一緒に裏側の最新データ探索の仕組みを覗いてみよう Db tech showcase2020Daisuke Masubuchi
世界中のオンラインゲームやスマフォアプリの分析をしてきたPlayFab。最近、従来のイベント分析に加えて様々なテレメトリーを包含したクラウド分析機能が備わりました。今回は、その裏の Azure Data Explorer a.k.a Kusto での構成や仕組みをご紹介します。Windowsのテレメトリー分析やAzureのログ解析基盤の裏側と共通した仕掛けが含まれているのでお楽しみに!ゲーム業界に限らず、ビックデータ運用を考えている大規模なSaaS事業やIoT事業にもご参考いただけたら幸いです。
at db tech showcase ONLINE 2020 https://db-tech-showcase.com/dbts/2020/online #dbts2020 #gamestackjp
*本資料は 2020年11月11日に開催された DB Tech Showcase イベントにてお話させていただいた、同タイトルのセッション資料となります
Theory to consider an inaccurate testing and how to determine the prior proba...Toshiyuki Shimono
I presented a mathematical theory on a medical testing method. This fundamental theory can be taken account of both cases when the resource of the testing is limited or not. One implication is that "negative proof" may not function well, and another implication is that excessively high specificity and accuracy are required for meaningful diagnosis unless the careful usage of the diagnosis is considered.
To Make Graphs Such as Scatter Plots Numerically Readable (PacificVis 2018, K...Toshiyuki Shimono
Different-sized discrete crosses placed in an organized lattice pattern can assist the human eyes to read numerical values on statistical graphs, enabling more precise interpretation and enlarging the utility of statistical graphs that visually represent numerical quantities. This paper presents a novel graph-plotting method that places roughly ten thousand of separated grids on a graph, providing human data analysis with an easy access to arbitrary numerical readouts from a statistical graph. At present, this functionality has been lacking in the existing graph-plotting softwares.
Make Accumulated Data in Companies Eloquent by SQL Statement Constructors (PDF)Toshiyuki Shimono
Presented at IEEE BigData 2017, Boston, on Dec 11, 2017
in the Workshop of "3rd International Workshop on Methodologies to Improve Big Data projects".
The author is Toshiyuki Shimono, Digital Garage, Inc.
(This is PDF format instead of MS Powerpoint format for the sake of significantly smaller file size.)
Despite the existence of data analysis tools such as R, SQL, Excel and others, it is still insufficient to cope with today's big data analysis needs.
The author proposes a CUI (Character User Interface) toolset with dozens of functions to neatly handle tabular data in TSV (Tab Separated Values) files.
It implements many basic and useful functions that have not been implemented in existing software with each function borrowing the ideas of Unix philosophy and covering the most frequent pre-analysis tasks during the initial exploratory stage of data analysis projects.
Also, it greatly speeds up basic analysis tasks, such as drawing cross tables, Venn diagrams, etc., while existing software inevitably requires rather complicated programming and debugging processes for even these basic tasks.
Here, tabular data mainly means TSV (Tab-Separated Values) files as well as other CSV (Comma Separated Value)-type files which are all widely used for storing data and suitable for data analysis.
3. 目次
I. 背景など (3 slides)
II. 蓄積されたデータ列の意味を解読する (7 slides)
III. 数から意味を見出そう (5 slides)
IV. 新しいソフトウェア (10 slides)
V. 補足 (5 slides)
VI. 予備スライド (16 slides)
found IT project #8 — 2017-07-27 LODGE
(Yahoo! JAPAN)
3
48. プログラマーの三大美徳
• 怠慢 Laziness ;
全体の手間を減らす手間は惜しまない。
• 短気 Impatience ;
コンピュータ側の怠慢に対する怒り。
• 傲慢 Hubris ;
過剰な自尊心で良いソフトウェアを作り保守する。
— Larry Wall
found IT project #8 — 2017-07-27 LODGE (Yahoo! JAPAN) 48
49. crosstable (2-way contingency table)
Provides the cross-table from
2 columned table
(Add blue color on “0” )(Extract 3rd and 4th columns)
You may draw many cross-table from a table data.
The crosstable commands provides cross-tables very quickly. 49
50. vars : extracting columns
• Easier than AWK and Unix-cut .
vars –t 2 ⇒ moves the 2nd column to rightmost.
vars –h 3 ⇒ moves the 3rd column to leftmost.
vars –p 5,9..7 ⇒ shows 5th,9th,8th,7th columns.
vars –d 6..9 ⇒ shows except 6th,7th,8th,9th columns.
-d stands for deleting, -p for printing,
-h for head, -t for tail.
50found IT project #8 — 2017-07-27 LODGE (Yahoo! JAPAN)
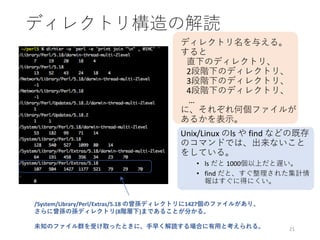
53. 累積ヒストグラム (数値分布の把握)
• 通常のヒストグラムは、数値データの
分布によって、ビン(分割)の分け方に
事前指定の困難性が発生。
• 数値データを左から右に、小さい順に
並べて、隙間の無い棒グラフと考える
と良い。
• 提供するコマンドは、対数で動作する
動作モードも用意している。ただし、
R言語に現状依存している。
• 通常の統計グラフに無いような、「グ
ラフから直接かなり正確な数値が読み
取れる」ように、格子の描き方を工夫
している。
Green : Following #
Blue : Followers #
of millions of twitter
accounts
Same plot in
LOG-SCALE
<- The wall
of 2000
53