![Image Formation Model (Cont…)
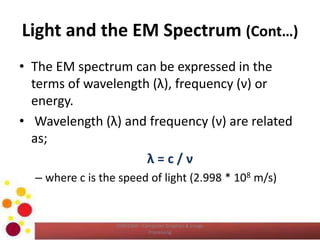
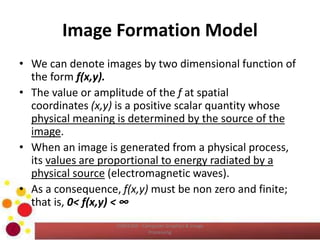
• We call the intensity of a monochrome image at any
coordinates (xn,yn) the gray level (l) of the image at that point.
That is; l = f (x0,y0)
• It is evident that l lies in the range; Lmin < l < Lmax
• In theory, the only requirement of Lmin is that it be positive, and
on Lmax that it be finite.
• In practice Lmin = imin rmin and Lmax = imax rmax
• The interval [Lmin, Lmax ] is called the GRAY SCALE.
• Common practice is to shift this interval numerically to the interval
[0, L-1], where l=0 is considered black and l = L-1 is considered
white on the gray scale.
• All the intermediate values are shades of gray varying from black
to white.
COM2304 - Computer Graphics & Image
Processing](https://image.slidesharecdn.com/l02-150111072324-conversion-gate01/85/COM2304-Digital-Image-Fundamentals-I-20-320.jpg)
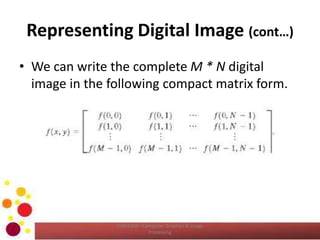
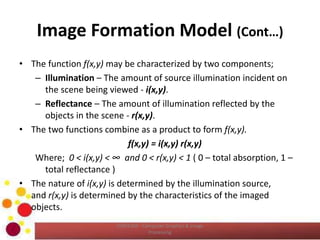
![Representing Digital Image (cont…)
• The digitization process requires decisions about values
for M, N and for the L number of discrete gray levels
allowed for each pixel.
• M and N should be positive integers.
• However due to processing, storage and sampling
hardware considerations, the number of gray levels
typically is the integer power of 2 as expressed below;
L = 2k
• We assume that the discrete levels are equally spaced
and that they are integers in the interval [0, L-1].
COM2304 - Computer Graphics & Image
Processing](https://image.slidesharecdn.com/l02-150111072324-conversion-gate01/85/COM2304-Digital-Image-Fundamentals-I-34-320.jpg)

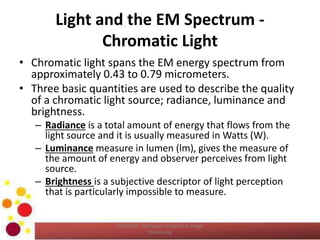
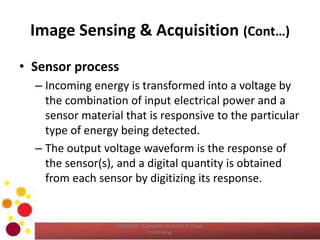
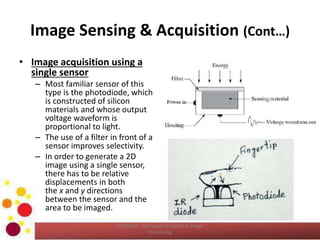
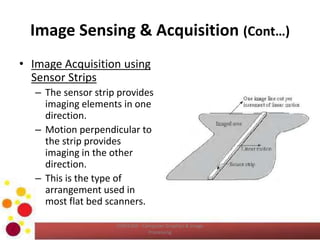
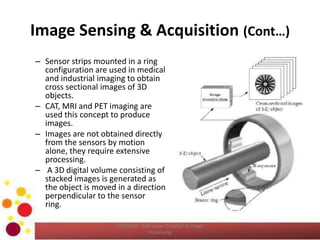
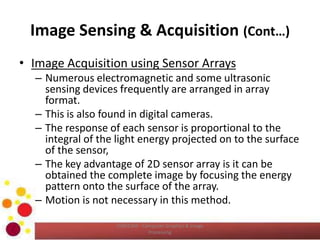
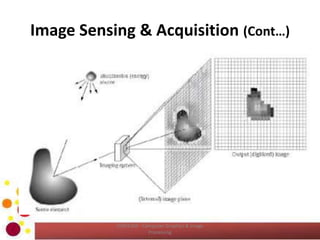
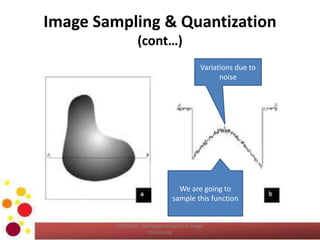
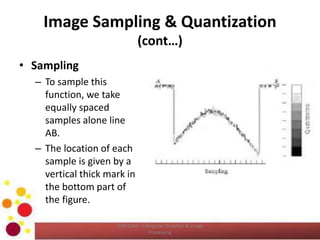
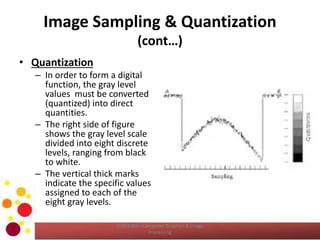
The document covers the fundamentals of digital images, including the electromagnetic spectrum, image acquisition methods, and the image formation model. It explains concepts such as light, sampling, quantization, and dynamic range. Learning outcomes emphasize the ability to describe these key topics in computer graphics and image processing.