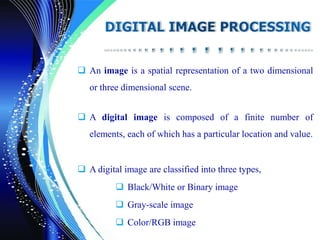
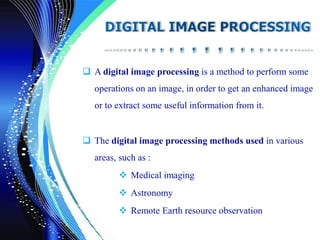
The document presents an overview of digital image processing, discussing different types of digital images, such as binary, grayscale, and color images. Key methods in digital image processing include image enhancement, restoration, compression, and segmentation, focusing on techniques like intensity transformation and spatial filtering. Examples of transformations like negative and logarithmic transformations are provided to illustrate how they enhance image details.

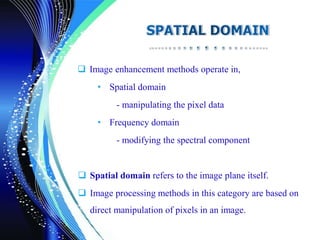
![ The spatial domain process can be denoted by the expression,
g ( x, y ) = T [ f ( x, y ) ]
Here,
x and y are spatial ( plane ) coordinates
( x, y ) is the intensity/gray level the image at that point
f ( x, y ) is the input image
g ( x, y ) is the output image
T is an operator](https://image.slidesharecdn.com/pointprocessing-171221075422/85/Image-Enhancement-Point-Processing-10-320.jpg)
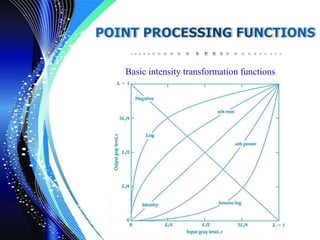
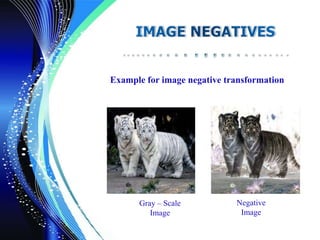
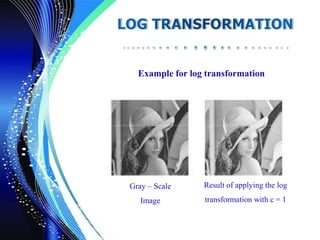
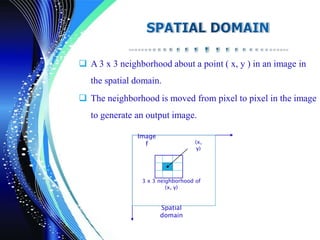
![ The negative of an image with intensity levels in the range
[0, L-1] is obtained by using the negative transformation.
The negative transformation is given by the following expression,
s = ( L - 1 ) – r
s is a negative image
L has a maximum gray level range of values 0 to 255
r is an original gray-scale image
Reversing the intensity levels of an image in this manner
produces the equivalent of photographic negative.
This type of processing is particularly suited for enhancing white
or gray detail embedded in dark regions of an image.](https://image.slidesharecdn.com/pointprocessing-171221075422/85/Image-Enhancement-Point-Processing-15-320.jpg)