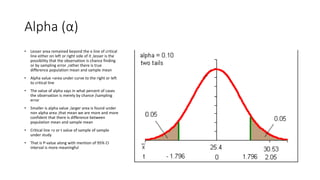
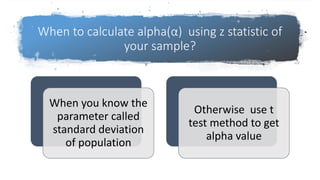
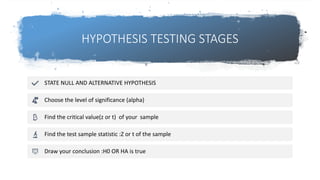
Calculating P-Value
Alpha (α)
• Lesser area remained beyond the e line of critical
line either on left or right side of it ,lesser is the
possibility that the observation is chance finding
or by sampling error ,rather there is true
difference population mean and sample mean
• Alpha value =area under curve to the right or left
to critical line
• The value of alpha says in what percent of cases
the observation is merely by chance /sampling
error
• Smaller is alpha value ,larger area is found under
non alpha area ,that mean we are more and more
confident that there is difference between
population mean and sample mean
• Critical line =z or t value of sample of sample
under study
• That is P-value along with mention of 95% CI
interval is more meaningful
Green line is critical
value of z or t =sample
statistic
95% CI interval=.95 x
area under curve =95%
time we confident that
the association is not by
chance or sampling error
• Lesser its value ,it says lesser the
possibility that your observed mean is
by chance or by sampling error rather
by true association =null hypothesis is
not true =there is difference between
population mean and your sample
mean
KEY WORDS
STATISTIC :MEAN ,MEDIAN ,MODE
,Z AND T VALUE OF YOUR
RESEARCH
Parameter : MEAN ,MEDIAN
,MODE ,Z AND T VALUE OF
population
Null hypothesis :There is no
difference between parameter
and statistic,α≥0.05
Alternative hypothesis : There is a
difference between parameter
and statistic: α≤0.05=The
observation by chance or
sampling error is up to the extent
less than 0.05 .
P value :0.05% AREA under bell
shaped curve =rejected area =any
value which would fall in this area
would be only by chance or
sampling error .Lesser the value
of P ,lesser it is due to chance or
sampling error
95% CI =0.95 area under the bell
shaped curve when the entire
area under curve is =1
Steps
• One tailed :
• sample mean is bigger than population mean
• sample mean is smaller than population mean
• Two tailed :sample mean(statistic) is not same bigger than population mean(parameter)
When to calculate alpha(α) using z statistic of
your sample?
When you know the
parameter called
standard deviation
of population
Otherwise use t
test method to get
alpha value
HYPOTHESIS TESTING STAGES
STATE NULL AND ALTERNATIVE HYPOTHESIS
Choose the level of significance (alpha)
Find the critical value(z or t) of your sample
Find the test sample statistic :Z or t of the sample
Draw your conclusion :H0 OR HA is true
Some practical links
one tailed Two tailed
You are welcome
to comments

Calculating p value

  • 1.
  • 2.
    Alpha (α) • Lesserarea remained beyond the e line of critical line either on left or right side of it ,lesser is the possibility that the observation is chance finding or by sampling error ,rather there is true difference population mean and sample mean • Alpha value =area under curve to the right or left to critical line • The value of alpha says in what percent of cases the observation is merely by chance /sampling error • Smaller is alpha value ,larger area is found under non alpha area ,that mean we are more and more confident that there is difference between population mean and sample mean • Critical line =z or t value of sample of sample under study • That is P-value along with mention of 95% CI interval is more meaningful
  • 3.
    Green line iscritical value of z or t =sample statistic 95% CI interval=.95 x area under curve =95% time we confident that the association is not by chance or sampling error
  • 4.
    • Lesser itsvalue ,it says lesser the possibility that your observed mean is by chance or by sampling error rather by true association =null hypothesis is not true =there is difference between population mean and your sample mean
  • 5.
    KEY WORDS STATISTIC :MEAN,MEDIAN ,MODE ,Z AND T VALUE OF YOUR RESEARCH Parameter : MEAN ,MEDIAN ,MODE ,Z AND T VALUE OF population Null hypothesis :There is no difference between parameter and statistic,α≥0.05 Alternative hypothesis : There is a difference between parameter and statistic: α≤0.05=The observation by chance or sampling error is up to the extent less than 0.05 . P value :0.05% AREA under bell shaped curve =rejected area =any value which would fall in this area would be only by chance or sampling error .Lesser the value of P ,lesser it is due to chance or sampling error 95% CI =0.95 area under the bell shaped curve when the entire area under curve is =1
  • 6.
    Steps • One tailed: • sample mean is bigger than population mean • sample mean is smaller than population mean • Two tailed :sample mean(statistic) is not same bigger than population mean(parameter)
  • 7.
    When to calculatealpha(α) using z statistic of your sample? When you know the parameter called standard deviation of population Otherwise use t test method to get alpha value
  • 8.
    HYPOTHESIS TESTING STAGES STATENULL AND ALTERNATIVE HYPOTHESIS Choose the level of significance (alpha) Find the critical value(z or t) of your sample Find the test sample statistic :Z or t of the sample Draw your conclusion :H0 OR HA is true
  • 9.
    Some practical links onetailed Two tailed
  • 10.