More Related Content
Similar to Chester county sold median price
Similar to Chester county sold median price (17)
More from Prudential Fox & Roach, Realtors
More from Prudential Fox & Roach, Realtors (20)
Chester county sold median price
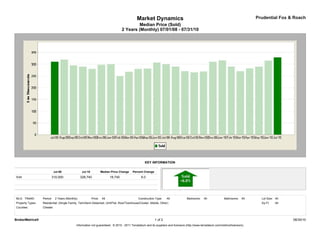
- 1. Market Dynamics Prudential Fox & Roach
Median Price (Sold)
2 Years (Monthly) 07/01/08 - 07/31/10
KEY INFORMATION
Jul-08 Jul-10 Median Price Change Percent Change
Sold 310,000 328,740 18,740 6.0
MLS: TReND Period: 2 Years (Monthly) Price: All Construction Type: All Bedrooms: All Bathrooms: All Lot Size: All
Property Types: Residential: (Single Family, Twin/Semi-Detached, Unit/Flat, Row/Townhouse/Cluster, Mobile, Other) Sq Ft: All
Counties: Chester
BrokerMetrics® 1 of 2 08/30/10
Information not guaranteed. © 2010 - 2011 Terradatum and its suppliers and licensors (http://www.terradatum.com/metrics/licensors).
- 2. Market Dynamics Prudential Fox & Roach
Median Price (Sold)
2 Years (Monthly) 07/01/08 - 07/31/10
FOR SALE UNDER CONTRACT SOLD EXPIRED NEW LISTINGS
Time Period Median $ # Properties Median $ # Properties Median $ # Properties Median $ # Properties Median $ # Properties
Jul-10 339,990 4,901 329,375 386 328,740 345 323,900 459 319,000 779
Jun-10 349,000 4,924 344,900 371 315,000 701 350,000 431 318,450 842
May-10 349,990 4,771 359,450 320 289,750 482 334,900 369 339,900 861
Apr-10 344,000 5,045 289,900 730 281,950 420 329,900 405 338,450 1,270
Mar-10 339,900 4,628 289,400 506 269,900 367 360,350 347 325,000 1,088
Feb-10 341,700 4,158 309,900 365 289,900 197 359,900 253 324,900 693
Jan-10 340,000 4,128 290,950 334 315,725 248 349,900 329 313,958 791
Dec-09 349,900 4,046 314,900 225 310,000 341 368,750 484 289,000 400
Nov-09 350,000 4,326 319,000 308 268,750 555 389,900 372 314,900 567
Oct-09 350,000 4,648 285,000 476 265,000 478 385,000 413 299,945 748
Sep-09 349,990 4,820 274,500 479 269,950 430 349,900 441 310,000 803
Aug-09 349,900 4,877 285,450 448 290,000 507 359,950 412 299,900 804
Jul-09 356,500 4,945 289,000 471 300,000 511 379,900 401 309,900 837
Jun-09 359,000 5,081 304,000 529 307,500 530 365,000 444 319,900 911
May-09 362,950 5,054 325,000 508 281,250 366 399,450 376 349,900 973
Apr-09 359,000 4,865 289,900 420 280,000 317 350,000 364 328,500 1,015
Mar-09 357,950 4,604 299,900 413 268,000 297 339,900 341 338,950 936
Feb-09 352,900 4,311 262,272 318 250,000 238 377,192 325 329,000 745
Jan-09 359,900 4,290 299,900 290 300,000 225 384,950 434 343,000 707
Dec-08 359,900 4,273 299,000 239 297,500 282 375,000 451 335,000 403
Nov-08 359,900 4,541 297,375 246 280,000 305 384,900 425 317,210 518
Oct-08 362,900 4,747 275,000 293 290,000 343 389,500 431 335,000 719
Sep-08 364,900 4,879 300,000 349 295,000 411 369,900 502 349,900 907
Aug-08 364,296 4,810 314,900 371 320,000 521 379,900 467 326,950 714
Jul-08 365,000 5,093 314,250 480 310,000 550 386,637 517 344,900 889
BrokerMetrics® 2 of 2 08/30/10
Information not guaranteed. © 2010 - 2011 Terradatum and its suppliers and licensors (http://www.terradatum.com/metrics/licensors).