2010 March Chester County Sold Median Price Analysis
•
0 likes•34 views

To help you select from the wide range of Chester County Homes or if your needs take you to Delaware County, Montgomery County, Bucks County or Philadelphia County, one of our Greater

Recommended
Recommended
More Related Content
What's hot
What's hot (14)
Similar to 2010 March Chester County Sold Median Price Analysis
Similar to 2010 March Chester County Sold Median Price Analysis (16)
More from Prudential Fox & Roach, Realtors
More from Prudential Fox & Roach, Realtors (20)
Recently uploaded
Recently uploaded (20)
2010 March Chester County Sold Median Price Analysis
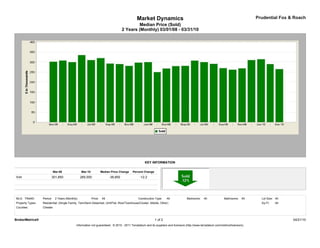
- 1. Market Dynamics Prudential Fox & Roach Median Price (Sold) 2 Years (Monthly) 03/01/08 - 03/31/10 KEY INFORMATION Mar-08 Mar-10 Median Price Change Percent Change Sold 301,850 265,000 -36,850 -12.2 MLS: TReND Period: 2 Years (Monthly) Price: All Construction Type: All Bedrooms: All Bathrooms: All Lot Size: All Property Types: Residential: (Single Family, Twin/Semi-Detached, Unit/Flat, Row/Townhouse/Cluster, Mobile, Other) Sq Ft: All Counties: Chester BrokerMetrics® 1 of 2 04/21/10 Information not guaranteed. © 2010 - 2011 Terradatum and its suppliers and licensors (http://www.terradatum.com/metrics/licensors).
- 2. Market Dynamics Prudential Fox & Roach Median Price (Sold) 2 Years (Monthly) 03/01/08 - 03/31/10 FOR SALE UNDER CONTRACT SOLD EXPIRED NEW LISTINGS Time Period Median $ # Properties Median $ # Properties Median $ # Properties Median $ # Properties Median $ # Properties Mar-10 349,000 4,613 285,450 506 265,000 361 359,990 357 330,000 1,077 Feb-10 349,802 4,160 309,900 364 289,950 196 357,185 260 325,000 694 Jan-10 349,000 4,137 289,900 337 314,421 245 349,900 334 315,000 785 Dec-09 350,000 4,066 315,000 223 310,000 340 365,000 491 292,990 399 Nov-09 355,000 4,361 319,450 312 268,875 556 386,250 382 319,900 556 Oct-09 352,450 4,700 279,950 474 262,000 475 379,900 421 304,925 740 Sep-09 350,000 4,882 272,250 480 269,950 430 349,900 442 314,000 803 Aug-09 350,000 4,945 285,900 449 291,250 508 359,900 417 299,900 805 Jul-09 358,000 5,013 288,250 470 300,000 510 379,500 403 309,999 835 Jun-09 359,500 5,153 303,802 528 307,500 530 365,000 447 320,000 913 May-09 363,900 5,125 325,000 509 281,250 366 399,450 376 349,900 976 Apr-09 359,000 4,933 289,900 420 280,000 317 350,000 364 329,000 1,017 Mar-09 358,241 4,670 299,900 413 268,000 297 339,900 341 335,000 939 Feb-09 353,990 4,374 262,272 318 250,000 238 377,192 325 329,450 752 Jan-09 359,900 4,354 299,900 290 300,000 225 388,450 442 346,450 708 Dec-08 359,900 4,331 299,000 239 297,500 282 372,490 446 334,950 406 Nov-08 359,900 4,604 298,750 245 281,120 300 386,397 434 317,858 518 Oct-08 361,775 4,801 275,000 283 290,000 337 382,804 432 335,000 720 Sep-08 365,000 4,936 300,000 354 292,575 418 371,990 501 349,900 905 Aug-08 364,046 4,872 309,950 364 320,000 522 369,900 477 325,000 702 Jul-08 365,000 5,185 314,700 484 310,000 551 389,000 531 345,000 886 Jun-08 365,000 5,244 317,000 457 335,000 579 385,000 488 349,500 953 May-08 369,900 5,243 339,950 512 299,900 459 379,900 440 349,900 1,113 Apr-08 369,900 5,182 319,899 552 308,000 452 395,175 500 359,900 1,195 Mar-08 364,900 4,874 300,000 475 301,850 362 357,052 412 350,000 1,148 BrokerMetrics® 2 of 2 04/21/10 Information not guaranteed. © 2010 - 2011 Terradatum and its suppliers and licensors (http://www.terradatum.com/metrics/licensors).