More Related Content
Similar to July 2010 Chester County Sold Median Price (16)
More from Prudential Fox & Roach, Realtors (20)
July 2010 Chester County Sold Median Price
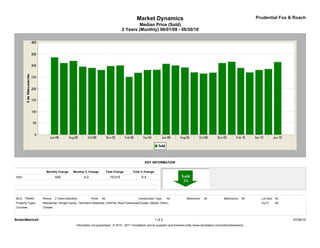
- 1. Market Dynamics Prudential Fox & Roach
Median Price (Sold)
2 Years (Monthly) 06/01/08 - 06/30/10
KEY INFORMATION
Monthly Change Monthly % Change Total Change Total % Change
Sold -640 -0.2 -16,010 -5.4
MLS: TReND Period: 2 Years (Monthly) Price: All Construction Type: All Bedrooms: All Bathrooms: All Lot Size: All
Property Types: Residential: (Single Family, Twin/Semi-Detached, Unit/Flat, Row/Townhouse/Cluster, Mobile, Other) Sq Ft: All
Counties: Chester
BrokerMetrics® 1 of 2 07/26/10
Information not guaranteed. © 2010 - 2011 Terradatum and its suppliers and licensors (http://www.terradatum.com/metrics/licensors).
- 2. Market Dynamics Prudential Fox & Roach
Median Price (Sold)
2 Years (Monthly) 06/01/08 - 06/30/10
FOR SALE UNDER CONTRACT SOLD EXPIRED NEW LISTINGS
Time Period Median $ # Properties Median $ # Properties Median $ # Properties Median $ # Properties Median $ # Properties
Jun-10 349,900 4,884 339,900 371 315,000 695 350,000 435 319,900 840
May-10 350,000 4,730 349,999 315 285,000 479 330,000 371 339,900 849
Apr-10 345,000 5,018 289,900 729 280,000 417 329,950 408 339,900 1,264
Mar-10 340,000 4,608 289,900 505 269,900 365 360,000 349 325,000 1,085
Feb-10 344,115 4,143 309,900 365 289,900 197 354,470 255 325,000 693
Jan-10 343,990 4,115 289,900 335 315,725 248 349,900 330 313,958 789
Dec-09 349,900 4,035 314,950 224 310,000 341 368,500 485 289,000 400
Nov-09 350,900 4,318 319,000 310 268,750 555 389,900 373 314,900 565
Oct-09 350,000 4,643 285,000 476 265,000 478 385,000 414 299,945 748
Sep-09 350,000 4,815 274,500 479 269,950 430 349,900 441 312,000 803
Aug-09 349,925 4,874 285,900 449 291,250 508 359,900 413 299,900 804
Jul-09 358,400 4,942 289,000 471 300,000 511 379,900 401 309,900 837
Jun-09 359,500 5,078 304,000 529 307,500 530 365,000 444 319,900 911
May-09 363,606 5,052 325,000 509 281,250 366 399,450 376 349,900 973
Apr-09 359,000 4,863 289,900 420 280,000 317 350,000 364 328,500 1,015
Mar-09 358,482 4,602 299,900 413 268,000 297 339,900 341 338,950 936
Feb-09 353,950 4,309 262,272 318 250,000 238 377,192 325 329,000 745
Jan-09 359,900 4,289 299,900 290 300,000 225 384,900 435 343,000 707
Dec-08 359,900 4,272 299,000 239 297,500 282 375,000 451 335,000 403
Nov-08 359,900 4,540 297,375 246 280,000 305 384,900 425 317,210 518
Oct-08 363,000 4,746 275,000 293 290,000 343 389,500 431 335,000 719
Sep-08 364,900 4,878 300,000 349 295,000 411 369,900 502 349,900 907
Aug-08 364,296 4,810 314,900 371 320,000 521 379,450 468 326,950 714
Jul-08 365,000 5,093 314,250 480 310,000 550 386,637 517 344,900 889
Jun-08 366,950 5,152 317,000 449 335,000 579 385,000 499 349,700 944
BrokerMetrics® 2 of 2 07/26/10
Information not guaranteed. © 2010 - 2011 Terradatum and its suppliers and licensors (http://www.terradatum.com/metrics/licensors).