Downloaded 3,306 times
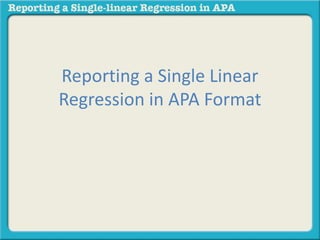
![A simple linear regression was calculated to predict
[dependent variable] based on [independent variable] .
A significant regression equation was found (F(_,__)=
__.___, p < .___), with an R2 of .____. Participants’
predicted weight is equal to _______+______
(independent variable measure) [dependent variable]
when [independent variable] is measured in [unit of
measure]. [Dependent variable] increased _____ for
each [unit of measure] of [independent variable].](https://image.slidesharecdn.com/reportingasinglelinearregressioninapa-141002163512-phpapp02/85/Reporting-a-single-linear-regression-in-apa-4-320.jpg)
![A simple linear regression was calculated to predict
[dependent variable] based on [predictor variable] .](https://image.slidesharecdn.com/reportingasinglelinearregressioninapa-141002163512-phpapp02/85/Reporting-a-single-linear-regression-in-apa-10-320.jpg)
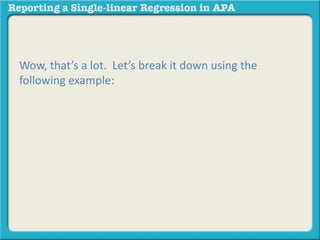
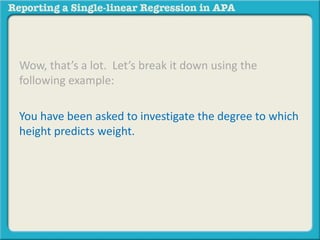
![A simple linear regression was calculated to predict
[dependent variable] based on [predictor variable].
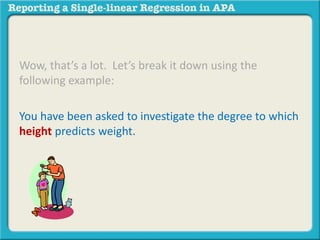
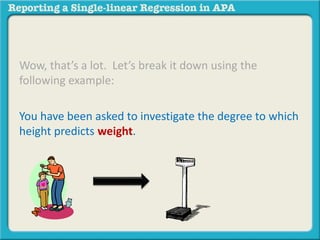
You have been asked to investigate the degree to which
height predicts weight.](https://image.slidesharecdn.com/reportingasinglelinearregressioninapa-141002163512-phpapp02/85/Reporting-a-single-linear-regression-in-apa-11-320.jpg)
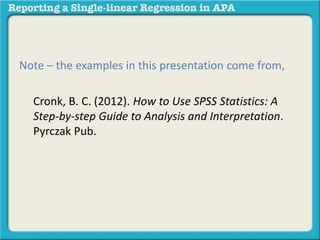
![A simple linear regression was calculated to predict
[dependent variable] based on [predictor variable].
Problem: You have been asked to investigate the
degree to which height predicts weight.](https://image.slidesharecdn.com/reportingasinglelinearregressioninapa-141002163512-phpapp02/85/Reporting-a-single-linear-regression-in-apa-12-320.jpg)
![A simple linear regression was calculated to predict
weight based on [predictor variable].
Problem: You have been asked to investigate the
degree to which height predicts weight.](https://image.slidesharecdn.com/reportingasinglelinearregressioninapa-141002163512-phpapp02/85/Reporting-a-single-linear-regression-in-apa-13-320.jpg)
![A simple linear regression was calculated to predict
weight based on [predictor variable].
Problem: You have been asked to investigate how well
height predicts weight.](https://image.slidesharecdn.com/reportingasinglelinearregressioninapa-141002163512-phpapp02/85/Reporting-a-single-linear-regression-in-apa-14-320.jpg)
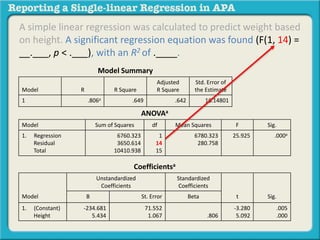
![A simple linear regression was calculated to predict weight based
on height. A significant regression equation was found (F(1, 14) =
25.925, p < .000), with an R2 of .649. Participants’ predicted
weight is equal to _______+______ (independent variable
measure) [dependent variable] when [independent variable] is
measured in [unit of measure].](https://image.slidesharecdn.com/reportingasinglelinearregressioninapa-141002163512-phpapp02/85/Reporting-a-single-linear-regression-in-apa-27-320.jpg)
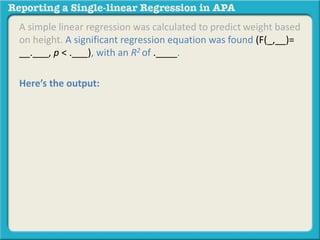
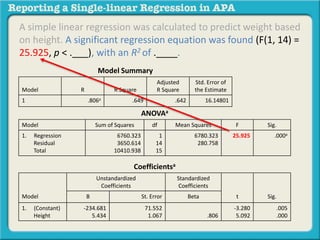
![A simple linear regression was calculated to predict weight based
on height. A significant regression equation was found (F(1, 14) =
25.925, p < .000), with an R2 of .649. Participants’ predicted
weight is equal to -234.681 +______ (independent variable
measure) [dependent variable] when [independent variable] is
measured in [unit of measure].
ANOVAa
Model Sum of Squares df Mean Squares F Sig.
1. Regression
Residual
Total
6760.323
3650.614
10410.938
1
14
15
6780.323
280.758
25.925 .000a
Coefficientsa
Model
Unstandardized
Coefficients
Standardized
Coefficients
B St. Error Beta t Sig.
1. (Constant)
Height
-234.681
5.434
71.552
1.067 .806
-3.280
5.092
.005
.000](https://image.slidesharecdn.com/reportingasinglelinearregressioninapa-141002163512-phpapp02/85/Reporting-a-single-linear-regression-in-apa-28-320.jpg)
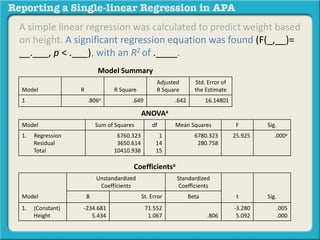
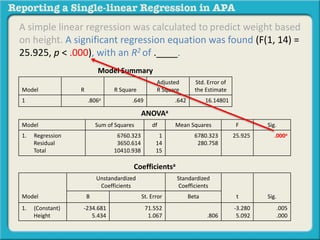
![A simple linear regression was calculated to predict weight based
on height. A significant regression equation was found (F(1, 14) =
25.925, p < .000), with an R2 of .649. Participants’ predicted
weight is equal to -234.681 + 5.434 (independent variable
measure) [dependent variable] when [independent variable] is
measured in [unit of measure].
ANOVAa
Model Sum of Squares df Mean Squares F Sig.
1. Regression
Residual
Total
6760.323
3650.614
10410.938
1
14
15
6780.323
280.758
25.925 .000a
Coefficientsa
Model
Unstandardized
Coefficients
Standardized
Coefficients
B St. Error Beta t Sig.
1. (Constant)
Height
-234.681
5.434
71.552
1.067 .806
-3.280
5.092
.005
.000](https://image.slidesharecdn.com/reportingasinglelinearregressioninapa-141002163512-phpapp02/85/Reporting-a-single-linear-regression-in-apa-29-320.jpg)
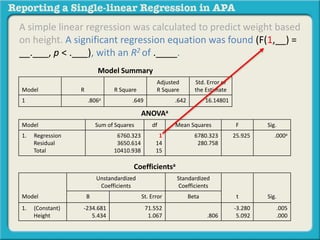
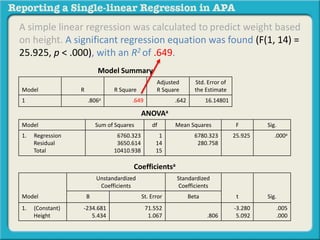
![A simple linear regression was calculated to predict weight based
on height. A significant regression equation was found (F(1, 14) =
25.925, p < .000), with an R2 of .649. Participants’ predicted
weight is equal to -234.681 + 5.434 (independent variable)
[dependent variable measure] when [independent variable] is
measured in [unit of measure].
ANOVAa
Independent Variable: Height
Dependent Variable: Weight
Model Sum of Squares df Mean Squares F Sig.
1. Regression
Residual
Total
6760.323
3650.614
10410.938
1
14
15
6780.323
280.758
25.925 .000a
Coefficientsa
Model
Unstandardized
Coefficients
Standardized
Coefficients
B St. Error Beta t Sig.
1. (Constant)
Height
-234.681
5.434
71.552
1.067 .806
-3.280
5.092
.005
.000](https://image.slidesharecdn.com/reportingasinglelinearregressioninapa-141002163512-phpapp02/85/Reporting-a-single-linear-regression-in-apa-30-320.jpg)
![A simple linear regression was calculated to predict weight based
on height. A significant regression equation was found (F(1, 14) =
25.925, p < .000), with an R2 of .649. Participants’ predicted
weight is equal to -234.681 + 5.434 (height) [dependent variable
measure] when [independent variable] is measured in [unit of
measure].
ANOVAa
Independent Variable: Height
Dependent Variable: Weight
Model Sum of Squares df Mean Squares F Sig.
1. Regression
Residual
Total
6760.323
3650.614
10410.938
1
14
15
6780.323
280.758
25.925 .000a
Coefficientsa
Model
Unstandardized
Coefficients
Standardized
Coefficients
B St. Error Beta t Sig.
1. (Constant)
Height
-234.681
5.434
71.552
1.067 .806
-3.280
5.092
.005
.000](https://image.slidesharecdn.com/reportingasinglelinearregressioninapa-141002163512-phpapp02/85/Reporting-a-single-linear-regression-in-apa-31-320.jpg)
![A simple linear regression was calculated to predict weight based
on height. A significant regression equation was found (F(1, 14) =
25.925, p < .000), with an R2 of .649. Participants’ predicted
weight is equal to -234.681 + 5.434 (height) pounds when
[independent variable] is measured in [unit of measure].
ANOVAa
Independent Variable: Height
Dependent Variable: Weight
Model Sum of Squares df Mean Squares F Sig.
1. Regression
Residual
Total
6760.323
3650.614
10410.938
1
14
15
6780.323
280.758
25.925 .000a
Coefficientsa
Model
Unstandardized
Coefficients
Standardized
Coefficients
B St. Error Beta t Sig.
1. (Constant)
Height
-234.681
5.434
71.552
1.067 .806
-3.280
5.092
.005
.000](https://image.slidesharecdn.com/reportingasinglelinearregressioninapa-141002163512-phpapp02/85/Reporting-a-single-linear-regression-in-apa-32-320.jpg)
![A simple linear regression was calculated to predict weight based
on height. A significant regression equation was found (F(1, 14) =
25.925, p < .000), with an R2 of .649. Participants’ predicted
weight is equal to -234.681 + 5.434 (height) pounds when
height is measured in [unit of measure].
ANOVAa
Independent Variable: Height
Dependent Variable: Weight
Model Sum of Squares df Mean Squares F Sig.
1. Regression
Residual
Total
6760.323
3650.614
10410.938
1
14
15
6780.323
280.758
25.925 .000a
Coefficientsa
Model
Unstandardized
Coefficients
Standardized
Coefficients
B St. Error Beta t Sig.
1. (Constant)
Height
-234.681
5.434
71.552
1.067 .806
-3.280
5.092
.005
.000](https://image.slidesharecdn.com/reportingasinglelinearregressioninapa-141002163512-phpapp02/85/Reporting-a-single-linear-regression-in-apa-33-320.jpg)
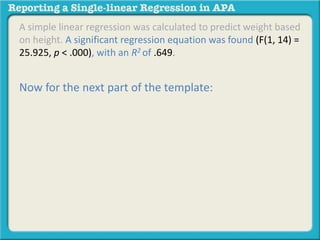
![A simple linear regression was calculated to predict weight based
on height. A significant regression equation was found (F(1, 14) =
25.925, p < .000), with an R2 of .649. Participants’ predicted
weight is equal to -234.681 + 5.434 (height) pounds when
height is measured in inches. [Dependent variable] increased
_____ for each [unit of measure] of [independent variable].](https://image.slidesharecdn.com/reportingasinglelinearregressioninapa-141002163512-phpapp02/85/Reporting-a-single-linear-regression-in-apa-36-320.jpg)
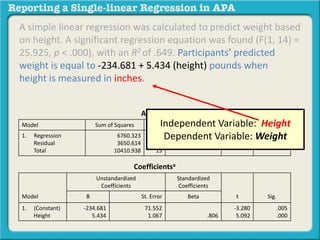
![A simple linear regression was calculated to predict weight based
on height. A significant regression equation was found (F(1, 14) =
25.925, p < .000), with an R2 of .649. Participants’ predicted
weight is equal to -234.681 + 5.434 (height) pounds when
height is measured in inches. [Dependent variable] increased
_____ for each [unit of measure] of [independent variable].
Independent Variable: Height
Dependent Variable: Weight
Coefficientsa
Model
Unstandardized
Coefficients
Standardized
Coefficients
B St. Error Beta t Sig.
1. (Constant)
Height
-234.681
5.434
71.552
1.067 .806
-3.280
5.092
.005
.000](https://image.slidesharecdn.com/reportingasinglelinearregressioninapa-141002163512-phpapp02/85/Reporting-a-single-linear-regression-in-apa-37-320.jpg)
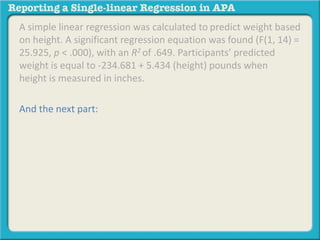
![A simple linear regression was calculated to predict weight based
on height. A significant regression equation was found (F(1, 14) =
25.925, p < .000), with an R2 of .649. Participants’ predicted
weight is equal to -234.681 + 5.434 (height) pounds when
height is measured in inches. Participant’s weight increased
_____ for each [unit of measure] of [independent variable].
Independent Variable: Height
Dependent Variable: Weight
Coefficientsa
Model
Unstandardized
Coefficients
Standardized
Coefficients
B St. Error Beta t Sig.
1. (Constant)
Height
-234.681
5.434
71.552
1.067 .806
-3.280
5.092
.005
.000](https://image.slidesharecdn.com/reportingasinglelinearregressioninapa-141002163512-phpapp02/85/Reporting-a-single-linear-regression-in-apa-38-320.jpg)
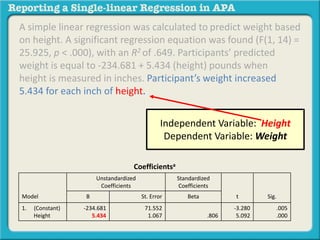
![A simple linear regression was calculated to predict weight based
on height. A significant regression equation was found (F(1, 14) =
25.925, p < .000), with an R2 of .649. Participants’ predicted
weight is equal to -234.681 + 5.434 (height) pounds when
height is measured in inches. Participant’s weight increased
5.434 for each [unit of measure] of [independent variable].
Independent Variable: Height
Dependent Variable: Weight
Coefficientsa
Model
Unstandardized
Coefficients
Standardized
Coefficients
B St. Error Beta t Sig.
1. (Constant)
Height
-234.681
5.434
71.552
1.067 .806
-3.280
5.092
.005
.000](https://image.slidesharecdn.com/reportingasinglelinearregressioninapa-141002163512-phpapp02/85/Reporting-a-single-linear-regression-in-apa-39-320.jpg)
![A simple linear regression was calculated to predict weight based
on height. A significant regression equation was found (F(1, 14) =
25.925, p < .000), with an R2 of .649. Participants’ predicted
weight is equal to -234.681 + 5.434 (height) pounds when
height is measured in inches. Participant’s weight increased
5.434 for each inch of [independent variable].
Independent Variable: Height
Dependent Variable: Weight
Coefficientsa
Model
Unstandardized
Coefficients
Standardized
Coefficients
B St. Error Beta t Sig.
1. (Constant)
Height
-234.681
5.434
71.552
1.067 .806
-3.280
5.092
.005
.000](https://image.slidesharecdn.com/reportingasinglelinearregressioninapa-141002163512-phpapp02/85/Reporting-a-single-linear-regression-in-apa-40-320.jpg)
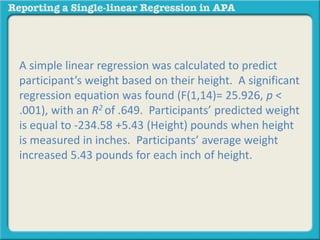

The document provides a template for reporting the results of a simple linear regression analysis in APA format. It explains that a linear regression was conducted to predict weight based on height. The regression equation was found to be significant, F(1,14)=25.925, p<.000, with an R2 of .649. The predicted weight is equal to -234.681 + 5.434 (height in inches) pounds.


