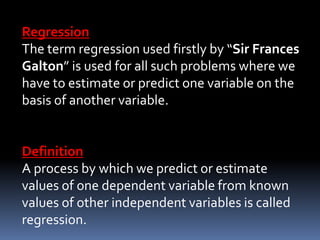
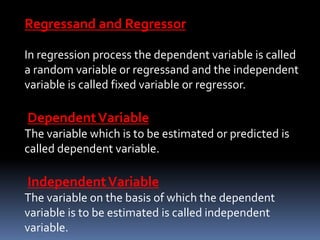
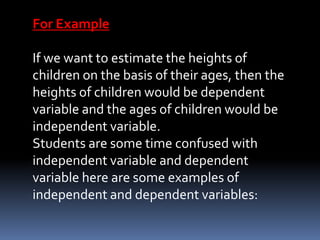
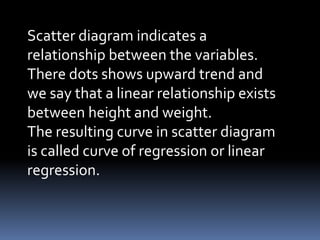
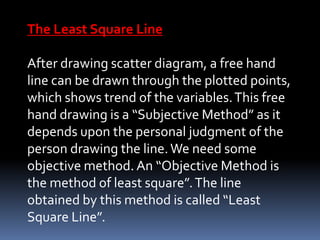
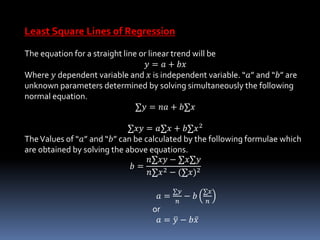
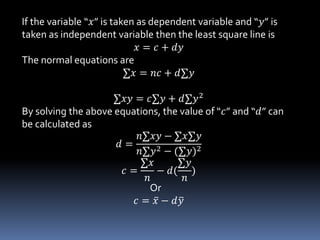
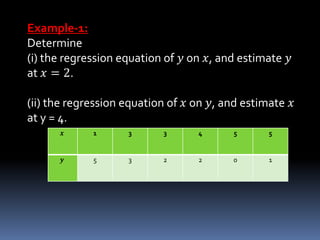
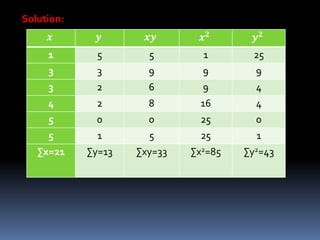
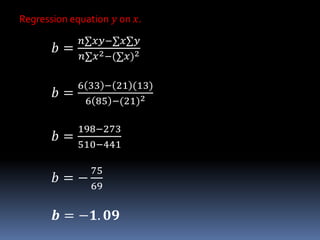
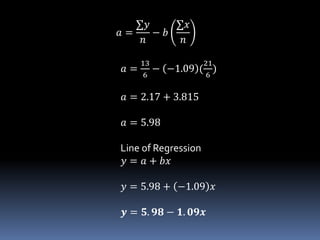
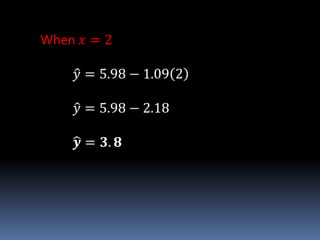
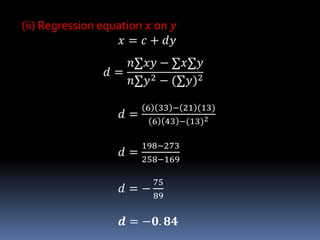
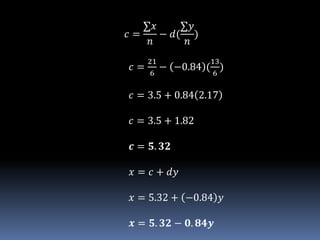
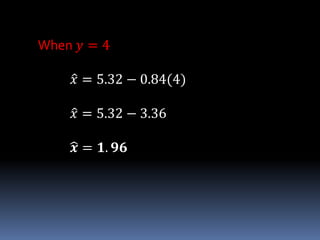
REGRESSION
NADEEM UDDIN
ASSOCIATE PROFESSOR
OF STATISTICS
Regression
The term regression used firstly by “Sir Frances
Galton” is used for all such problems where we
have to estimate or predict one variable on the
basis of another variable.
Definition
A process by which we predict or estimate
values of one dependent variable from known
values of other independent variables is called
regression.
Regressand and Regressor
In regression process the dependent variable is called
a random variable or regressand and the independent
variable is called fixed variable or regressor.
DependentVariable
The variable which is to be estimated or predicted is
called dependent variable.
IndependentVariable
The variable on the basis of which the dependent
variable is to be estimated is called independent
variable.
For Example
If we want to estimate the heights of
children on the basis of their ages, then the
heights of children would be dependent
variable and the ages of children would be
independent variable.
Students are some time confused with
independent variable and dependent
variable here are some examples of
independent and dependent variables:
IndependentVariable (𝒙) DependentVariable (𝒚)
Age of child Weight of child
Temperature of a plant Height of a plant
Amount of drug Reaction time
Number of registered vehicles Number of road accidents
Advertising Income
Scatter Diagram
Scatter diagram is obtained by plotting the
paired values of 𝑥 and 𝑦 on a graph paper and
the points so obtained are kept disjoined.
In scatter diagram we take independent
variable along the 𝑥 − 𝑎𝑥𝑖𝑠 and the dependent
variable on the 𝑦 − 𝑎𝑥𝑖𝑠.
This is the simplest method of investigating
the relationship between the two variables.
Here below is given heights of children in inches and weights in
pounds.
Now we plot this data taking
the independent variable (heights) on 𝑥 − 𝑎𝑥𝑖𝑠 and
the dependent variable (weights) on 𝑦 − 𝑎𝑥𝑖𝑠 to get
scatter.
Heights 𝑖𝑛𝑐ℎ𝑒𝑠 𝑥 58 70 74 68 61 66 70 63
Weights
𝑝𝑜𝑢𝑛𝑑𝑠 𝑦
160 180 176 165 150 155 169 160
145
150
155
160
165
170
175
180
185
0 10 20 30 40 50 60 70 80
Heights (inches)
Weights(pounds)
Scatter diagram indicates a
relationship between the variables.
There dots shows upward trend and
we say that a linear relationship exists
between height and weight.
The resulting curve in scatter diagram
is called curve of regression or linear
regression.
The Least Square Line
After drawing scatter diagram, a free hand
line can be drawn through the plotted points,
which shows trend of the variables.This free
hand drawing is a “Subjective Method” as it
depends upon the personal judgment of the
person drawing the line.We need some
objective method. An “Objective Method is
the method of least square”.The line
obtained by this method is called “Least
Square Line”.
Least Square Lines of Regression
The equation for a straight line or linear trend will be
𝑦 = 𝑎 + 𝑏𝑥
Where 𝑦 dependent variable and 𝑥 is independent variable. “𝑎” and “𝑏” are
unknown parameters determined by solving simultaneously the following
normal equation.
∑𝑦 = 𝑛𝑎 + 𝑏∑𝑥
∑𝑥𝑦 = 𝑎∑𝑥 + 𝑏∑𝑥2
TheValues of “𝑎” and “𝑏” can be calculated by the following formulae which
are obtained by solving the above equations.
𝑏 =
𝑛∑𝑥𝑦 − ∑𝑥∑𝑦
𝑛∑𝑥2 − (∑𝑥)2
𝑎 =
∑𝑦
𝑛
− 𝑏
∑𝑥
𝑛
or
𝑎 = 𝑦 − 𝑏 𝑥
If the variable “𝑥” is taken as dependent variable and “𝑦” is
taken as independent variable then the least square line is
𝑥 = 𝑐 + 𝑑𝑦
The normal equations are
∑𝑥 = 𝑛𝑐 + 𝑑∑𝑦
∑𝑥𝑦 = 𝑐∑𝑦 + 𝑑∑𝑦2
By solving the above equations, the value of “𝑐” and “𝑑” can
be calculated as
𝑑 =
𝑛∑𝑥𝑦 − ∑𝑥∑𝑦
𝑛∑𝑦2 − (∑𝑦)2
𝑐 =
∑𝑥
𝑛
− 𝑑(
∑𝑦
𝑛
)
Or
𝑐 = 𝑥 − 𝑑 𝑦
Example-1:
Determine
(i) the regression equation of 𝑦 on 𝑥, and estimate 𝑦
at 𝑥 = 2.
(ii) the regression equation of 𝑥 on 𝑦, and estimate 𝑥
at y = 4.
𝒙 1 3 3 4 5 5
𝒚 5 3 2 2 0 1
Solution:
𝒙 𝒚 𝒙𝒚 𝒙 𝟐 𝒚 𝟐
1 5 5 1 25
3 3 9 9 9
3 2 6 9 4
4 2 8 16 4
5 0 0 25 0
5 1 5 25 1
∑x=21 ∑y=13 ∑xy=33 ∑x2=85 ∑y2=43
Regression equation 𝑦 on 𝑥.
𝑏 =
𝑛∑𝑥𝑦−∑𝑥∑𝑦
𝑛∑𝑥2−(∑𝑥)2
𝑏 =
6 33 − 21 (13)
6 85 −(21)2
𝑏 =
198−273
510−441
𝑏 = −
75
69
𝒃 = −𝟏. 𝟎𝟗
𝑎 =
∑𝑦
𝑛
− 𝑏
∑𝑥
𝑛
𝑎 =
13
6
− −1.09 (
21
6
)
𝑎 = 2.17 + 3.815
𝑎 = 5.98
Line of Regression
𝑦 = 𝑎 + 𝑏𝑥
𝑦 = 5.98 + −1.09 𝑥
𝒚 = 𝟓. 𝟗𝟖 − 𝟏. 𝟎𝟗𝒙
When 𝑥 = 2
𝑦 = 5.98 − 1.09 2
𝑦 = 5.98 − 2.18
𝒚 = 𝟑. 𝟖
(ii) Regression equation 𝑥 on 𝑦
𝑥 = 𝑐 + 𝑑𝑦
𝑑 =
𝑛∑𝑥𝑦 − ∑𝑥∑𝑦
𝑛∑𝑦2 − (∑𝑦)2
𝑑 =
6 33 − 21 (13)
6 43 −(13)2
𝑑 =
198−273
258−169
𝑑 = −
75
89
𝒅 = −𝟎. 𝟖𝟒
𝑐 =
∑𝑥
𝑛
− 𝑑(
∑𝑦
𝑛
)
𝑐 =
21
6
− −0.84 (
13
6
)
𝑐 = 3.5 + 0.84 2.17
𝑐 = 3.5 + 1.82
𝒄 = 𝟓. 𝟑𝟐
𝑥 = 𝑐 + 𝑑𝑦
𝑥 = 5.32 + −0.84 𝑦
𝒙 = 𝟓. 𝟑𝟐 − 𝟎. 𝟖𝟒𝒚
When 𝑦 = 4
𝑥 = 5.32 − 0.84(4)
𝑥 = 5.32 − 3.36
𝒙 = 𝟏. 𝟗𝟔
Example-2:
The heights and weights of six men are given below.
(i) Determine both the lines of regression.
(ii) Estimate weight when height is1.70 𝑚𝑒𝑡𝑒𝑟𝑠.
(iii) Estimate height when weight is70.0 𝑘𝑔.
Answers (𝑦 = 4.8 + 40.22𝑥 ; 𝒙 = −𝟎. 𝟎𝟓𝟐 + 𝟎. 𝟎𝟐𝟒𝒚)
𝒚 = 𝟕𝟑 𝒌𝒈; 𝒙 = 𝟏. 𝟔𝟑 𝒎𝒆𝒕𝒆𝒓𝒔
Height(
𝑚𝑒𝑡𝑒𝑟𝑠)
2.00 1.80 1.85 1.72 1.75 1.79
Weight(𝑘𝑔𝑠) 85.0 78.0 80.0 74.0 75.0 76.0

Regression

  • 1.
  • 2.
    Regression The term regressionused firstly by “Sir Frances Galton” is used for all such problems where we have to estimate or predict one variable on the basis of another variable. Definition A process by which we predict or estimate values of one dependent variable from known values of other independent variables is called regression.
  • 3.
    Regressand and Regressor Inregression process the dependent variable is called a random variable or regressand and the independent variable is called fixed variable or regressor. DependentVariable The variable which is to be estimated or predicted is called dependent variable. IndependentVariable The variable on the basis of which the dependent variable is to be estimated is called independent variable.
  • 4.
    For Example If wewant to estimate the heights of children on the basis of their ages, then the heights of children would be dependent variable and the ages of children would be independent variable. Students are some time confused with independent variable and dependent variable here are some examples of independent and dependent variables:
  • 5.
    IndependentVariable (𝒙) DependentVariable(𝒚) Age of child Weight of child Temperature of a plant Height of a plant Amount of drug Reaction time Number of registered vehicles Number of road accidents Advertising Income
  • 6.
    Scatter Diagram Scatter diagramis obtained by plotting the paired values of 𝑥 and 𝑦 on a graph paper and the points so obtained are kept disjoined. In scatter diagram we take independent variable along the 𝑥 − 𝑎𝑥𝑖𝑠 and the dependent variable on the 𝑦 − 𝑎𝑥𝑖𝑠. This is the simplest method of investigating the relationship between the two variables.
  • 7.
    Here below isgiven heights of children in inches and weights in pounds. Now we plot this data taking the independent variable (heights) on 𝑥 − 𝑎𝑥𝑖𝑠 and the dependent variable (weights) on 𝑦 − 𝑎𝑥𝑖𝑠 to get scatter. Heights 𝑖𝑛𝑐ℎ𝑒𝑠 𝑥 58 70 74 68 61 66 70 63 Weights 𝑝𝑜𝑢𝑛𝑑𝑠 𝑦 160 180 176 165 150 155 169 160
  • 8.
    145 150 155 160 165 170 175 180 185 0 10 2030 40 50 60 70 80 Heights (inches) Weights(pounds)
  • 9.
    Scatter diagram indicatesa relationship between the variables. There dots shows upward trend and we say that a linear relationship exists between height and weight. The resulting curve in scatter diagram is called curve of regression or linear regression.
  • 10.
    The Least SquareLine After drawing scatter diagram, a free hand line can be drawn through the plotted points, which shows trend of the variables.This free hand drawing is a “Subjective Method” as it depends upon the personal judgment of the person drawing the line.We need some objective method. An “Objective Method is the method of least square”.The line obtained by this method is called “Least Square Line”.
  • 11.
    Least Square Linesof Regression The equation for a straight line or linear trend will be 𝑦 = 𝑎 + 𝑏𝑥 Where 𝑦 dependent variable and 𝑥 is independent variable. “𝑎” and “𝑏” are unknown parameters determined by solving simultaneously the following normal equation. ∑𝑦 = 𝑛𝑎 + 𝑏∑𝑥 ∑𝑥𝑦 = 𝑎∑𝑥 + 𝑏∑𝑥2 TheValues of “𝑎” and “𝑏” can be calculated by the following formulae which are obtained by solving the above equations. 𝑏 = 𝑛∑𝑥𝑦 − ∑𝑥∑𝑦 𝑛∑𝑥2 − (∑𝑥)2 𝑎 = ∑𝑦 𝑛 − 𝑏 ∑𝑥 𝑛 or 𝑎 = 𝑦 − 𝑏 𝑥
  • 12.
    If the variable“𝑥” is taken as dependent variable and “𝑦” is taken as independent variable then the least square line is 𝑥 = 𝑐 + 𝑑𝑦 The normal equations are ∑𝑥 = 𝑛𝑐 + 𝑑∑𝑦 ∑𝑥𝑦 = 𝑐∑𝑦 + 𝑑∑𝑦2 By solving the above equations, the value of “𝑐” and “𝑑” can be calculated as 𝑑 = 𝑛∑𝑥𝑦 − ∑𝑥∑𝑦 𝑛∑𝑦2 − (∑𝑦)2 𝑐 = ∑𝑥 𝑛 − 𝑑( ∑𝑦 𝑛 ) Or 𝑐 = 𝑥 − 𝑑 𝑦
  • 13.
    Example-1: Determine (i) the regressionequation of 𝑦 on 𝑥, and estimate 𝑦 at 𝑥 = 2. (ii) the regression equation of 𝑥 on 𝑦, and estimate 𝑥 at y = 4. 𝒙 1 3 3 4 5 5 𝒚 5 3 2 2 0 1
  • 14.
    Solution: 𝒙 𝒚 𝒙𝒚𝒙 𝟐 𝒚 𝟐 1 5 5 1 25 3 3 9 9 9 3 2 6 9 4 4 2 8 16 4 5 0 0 25 0 5 1 5 25 1 ∑x=21 ∑y=13 ∑xy=33 ∑x2=85 ∑y2=43
  • 15.
    Regression equation 𝑦on 𝑥. 𝑏 = 𝑛∑𝑥𝑦−∑𝑥∑𝑦 𝑛∑𝑥2−(∑𝑥)2 𝑏 = 6 33 − 21 (13) 6 85 −(21)2 𝑏 = 198−273 510−441 𝑏 = − 75 69 𝒃 = −𝟏. 𝟎𝟗
  • 16.
    𝑎 = ∑𝑦 𝑛 − 𝑏 ∑𝑥 𝑛 𝑎= 13 6 − −1.09 ( 21 6 ) 𝑎 = 2.17 + 3.815 𝑎 = 5.98 Line of Regression 𝑦 = 𝑎 + 𝑏𝑥 𝑦 = 5.98 + −1.09 𝑥 𝒚 = 𝟓. 𝟗𝟖 − 𝟏. 𝟎𝟗𝒙
  • 17.
    When 𝑥 =2 𝑦 = 5.98 − 1.09 2 𝑦 = 5.98 − 2.18 𝒚 = 𝟑. 𝟖
  • 18.
    (ii) Regression equation𝑥 on 𝑦 𝑥 = 𝑐 + 𝑑𝑦 𝑑 = 𝑛∑𝑥𝑦 − ∑𝑥∑𝑦 𝑛∑𝑦2 − (∑𝑦)2 𝑑 = 6 33 − 21 (13) 6 43 −(13)2 𝑑 = 198−273 258−169 𝑑 = − 75 89 𝒅 = −𝟎. 𝟖𝟒
  • 19.
    𝑐 = ∑𝑥 𝑛 − 𝑑( ∑𝑦 𝑛 ) 𝑐= 21 6 − −0.84 ( 13 6 ) 𝑐 = 3.5 + 0.84 2.17 𝑐 = 3.5 + 1.82 𝒄 = 𝟓. 𝟑𝟐 𝑥 = 𝑐 + 𝑑𝑦 𝑥 = 5.32 + −0.84 𝑦 𝒙 = 𝟓. 𝟑𝟐 − 𝟎. 𝟖𝟒𝒚
  • 20.
    When 𝑦 =4 𝑥 = 5.32 − 0.84(4) 𝑥 = 5.32 − 3.36 𝒙 = 𝟏. 𝟗𝟔
  • 21.
    Example-2: The heights andweights of six men are given below. (i) Determine both the lines of regression. (ii) Estimate weight when height is1.70 𝑚𝑒𝑡𝑒𝑟𝑠. (iii) Estimate height when weight is70.0 𝑘𝑔. Answers (𝑦 = 4.8 + 40.22𝑥 ; 𝒙 = −𝟎. 𝟎𝟓𝟐 + 𝟎. 𝟎𝟐𝟒𝒚) 𝒚 = 𝟕𝟑 𝒌𝒈; 𝒙 = 𝟏. 𝟔𝟑 𝒎𝒆𝒕𝒆𝒓𝒔 Height( 𝑚𝑒𝑡𝑒𝑟𝑠) 2.00 1.80 1.85 1.72 1.75 1.79 Weight(𝑘𝑔𝑠) 85.0 78.0 80.0 74.0 75.0 76.0