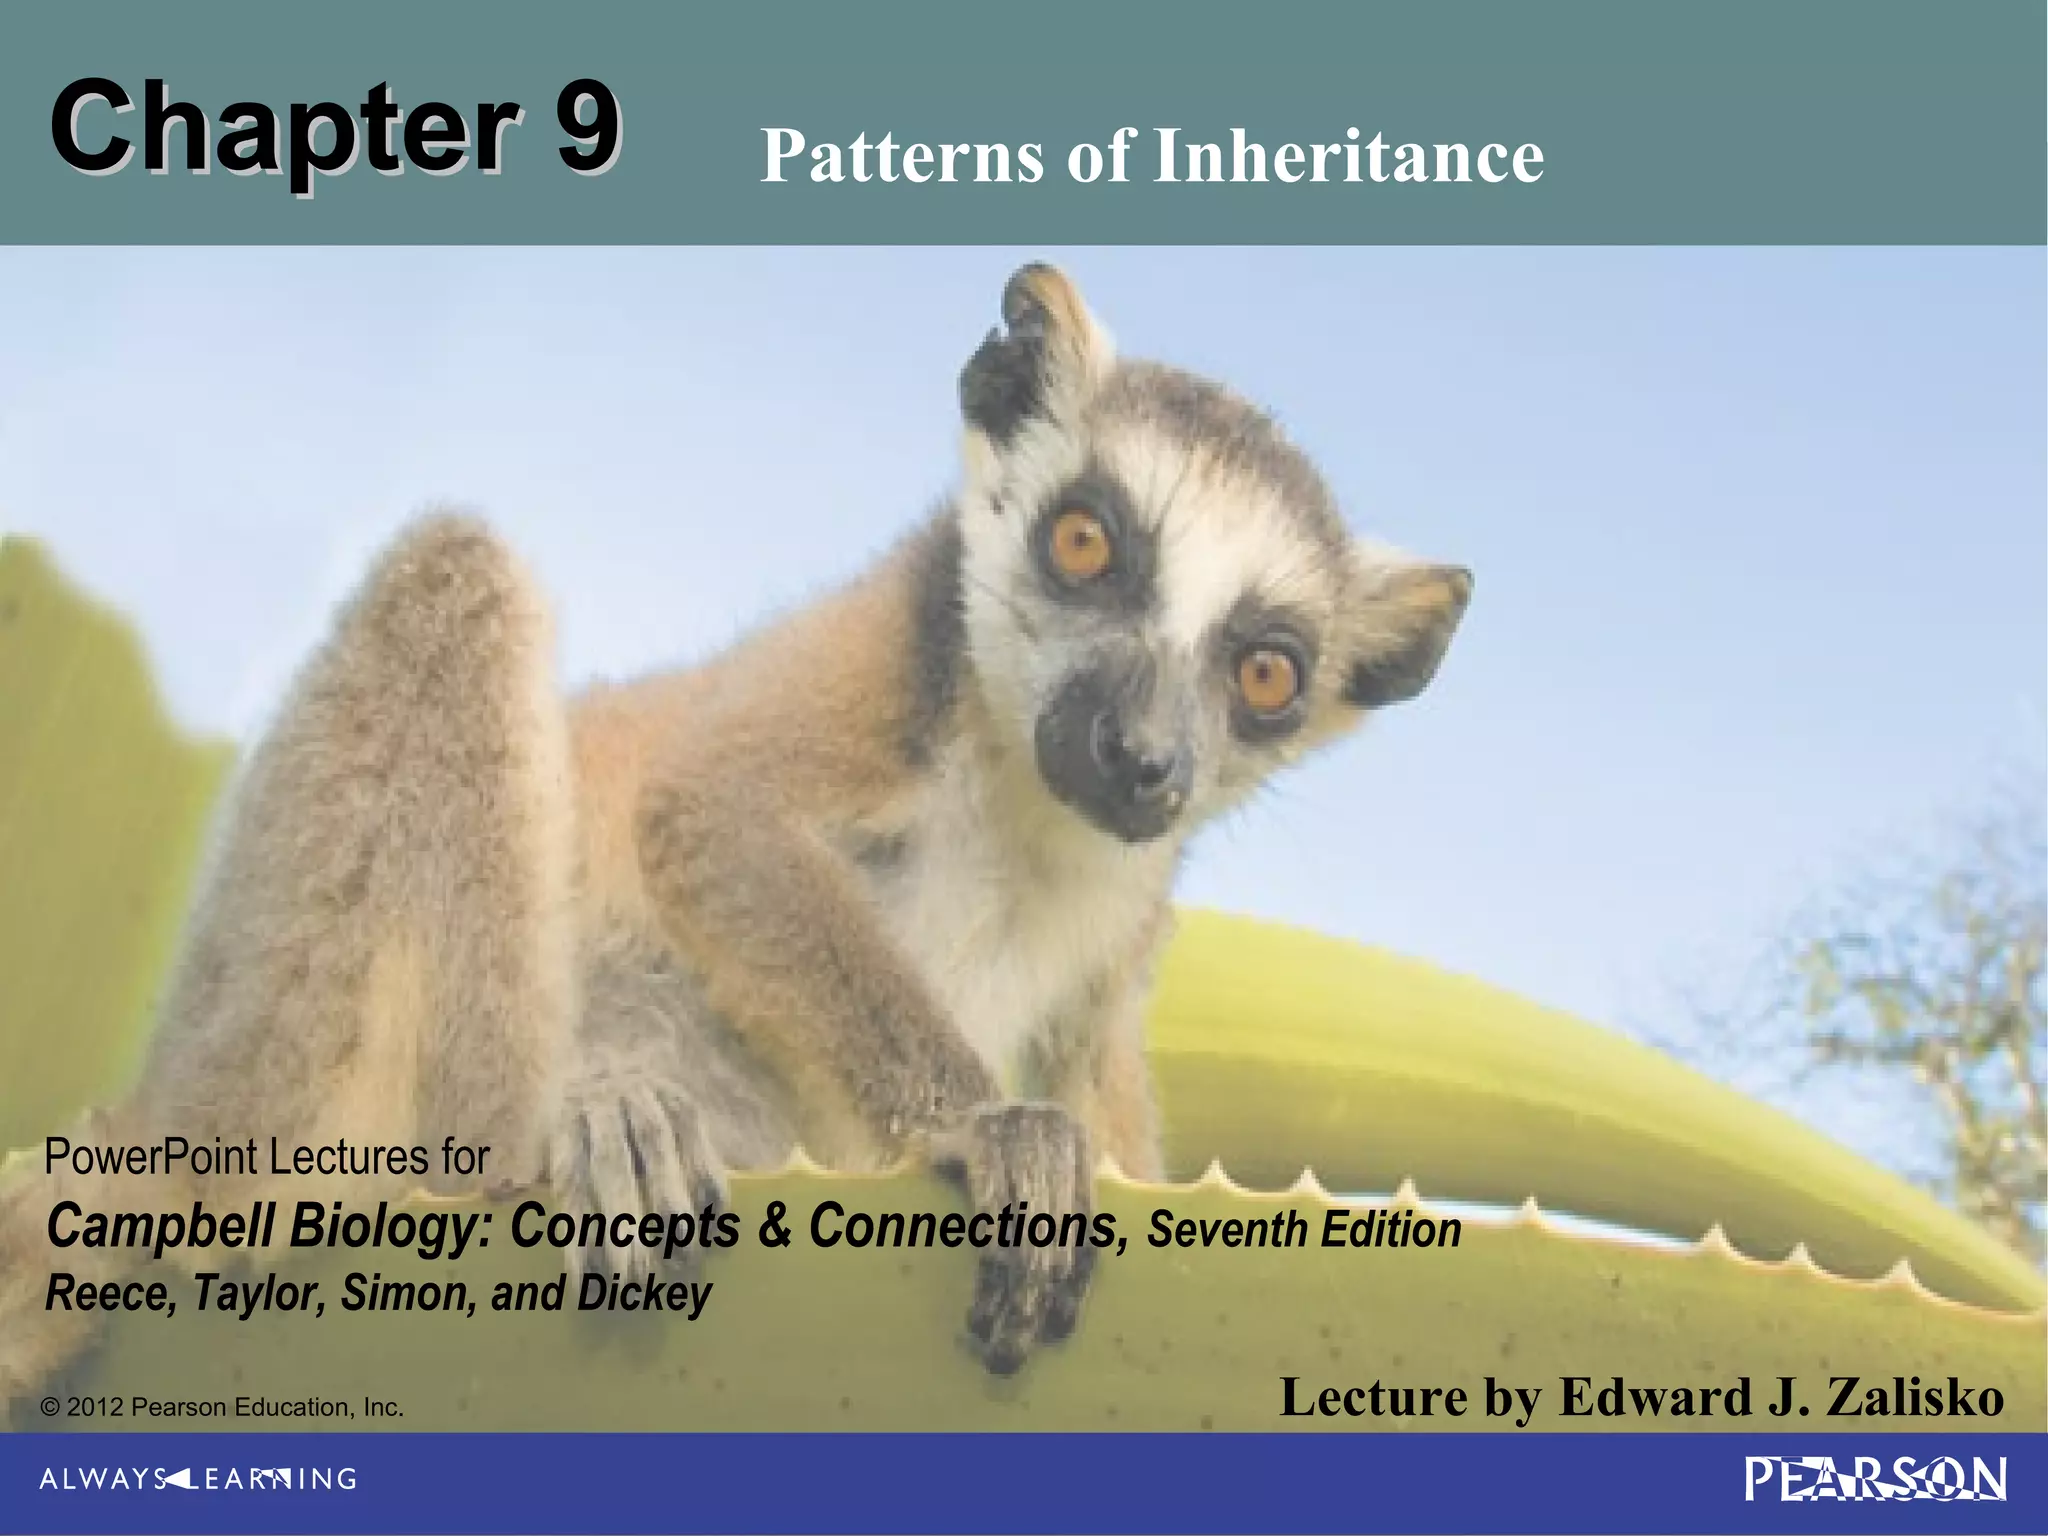
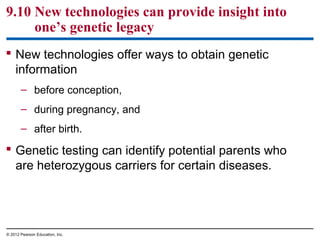
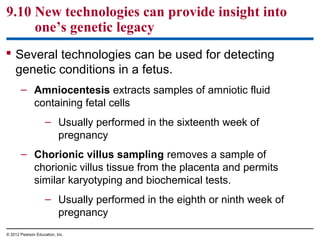
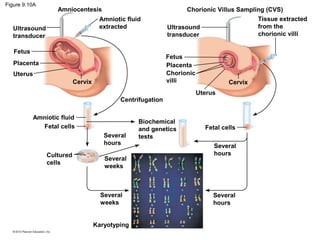
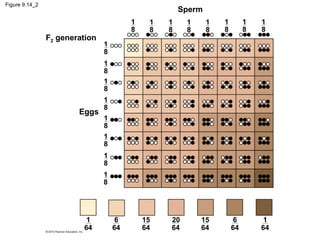
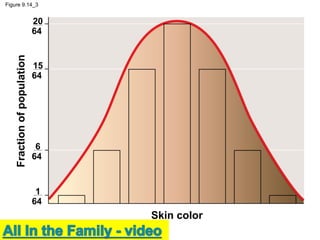
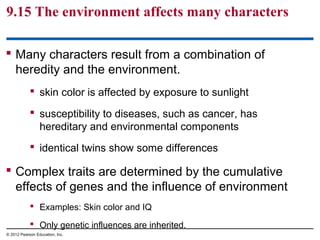
Chapter 9

Patterns of Inheritance

PowerPoint Lectures for

Campbell Biology: Concepts & Connections, Seventh Edition
Reece, Taylor, Simon, and Dickey
© 2012 Pearson Education, Inc.

Lecture by Edward J. Zalisko
Figure 9.0_1

Chapter 9: Big Ideas

Mendel’s Laws

The Chromosomal Basis
of Inheritance

Variations on
Mendel’s Laws

Sex Chromosomes and
Sex-Linked Genes
9.5 The law of independent assortment is
revealed by tracking two characters at once
 The following figure demonstrates the law of
independent assortment as it applies to two
characters in Labrador retrievers:
– black versus chocolate color,
– normal vision versus progressive retinal atrophy.

© 2012 Pearson Education, Inc.
Figure 9.5B

Blind

Blind

Phenotypes
Genotypes

Black coat,
normal vision
B_N_

Black coat,
blind (PRA)
B_nn

Chocolate coat,
normal vision
bbN_

Chocolate coat,
blind (PRA)
bbnn

Mating of double heterozygotes (black coat, normal vision)
BbNn
BbNn
×

Blind

Blind

Phenotypic ratio
of the offspring

9
Black coat,
normal vision

3
Black coat,
blind (PRA)

3
Chocolate coat,
normal vision

1
Chocolate coat,
blind (PRA)
Figure 9.5B_1

Blind

Phenotypes
Genotypes

Black coat,
normal vision
B_N_

Black coat,
blind (PRA)
B_nn

Blind

Phenotypes
Genotypes

Chocolate coat,
normal vision
bbN_

Chocolate coat,
blind (PRA)
bbnn
Figure 9.5B_2

Mating of double heterozygotes (black coat, normal vision)
BbNn ×
BbNn

Blind
Phenotypic
ratio of the
offspring

9
Black coat,
normal vision

Blind

1
3
3
Black coat, Chocolate coat, Chocolate coat,
blind (PRA)
blind (PRA) normal vision
9.7 Mendel’s laws reflect the rules of probability
 Using his strong background in mathematics,
Mendel knew that the rules of mathematical
probability affected
– the segregation of allele pairs during gamete formation
and
– the re-forming of pairs at fertilization.

 The probability scale ranges from 0 to 1. An event
that is
– certain has a probability of 1 and
– certain not to occur has a probability of 0.
© 2012 Pearson Education, Inc.
Evaluating Results
 Mendel was unable to analyze mathematically how
well the actual outcome of his crosses fulfilled his
predictions.
– Karl Pearson developed the chi-square (χ2) test
– Determines whether the observed distribution of individuals in
as predicted or occurs by chance.
– If there is no difference between the observed and expected
classes the value for χ2 will be 0.
– The value of χ2 increases with greater difference between the
observed and expected classes.
– The formula can be expressed as χ2 = Σ (O-E)2 ÷ E
– O is # observed and E is # expected
We must now convert χ2 into probability in order to
determine if the χ2 value is expected.
 df (degrees of freedom) = number of classes – 1
 We can then use the table below to determine whether the
data collected is acceptable.
– A p value of less than 0.05 means that the observations do not meet
the expected outcome and needs to be reexamined
9.8 Genetic traits in humans can be tracked
through family pedigrees
 The inheritance of human traits follows Mendel’s
laws.
 A pedigree
– shows the inheritance of a trait in a family through
multiple generations,
– demonstrates dominant or recessive inheritance, and
– can also be used to deduce genotypes of family
members.

© 2012 Pearson Education, Inc.
Figure 9.8A

Dominant Traits

Recessive Traits

Freckles

No freckles

Widow’s peak

Straight hairline

Free earlobe

Attached earlobe
Figure 9.8B

First generation
(grandparents)
Second generation
(parents, aunts,
FF
and uncles)
or
Ff
Third generation
(two sisters)
Female

Male
Attached
Free

Ff

ff

Ff

ff

ff

Ff

Ff

Ff

ff

ff

FF
or
Ff
9.9 Many inherited disorders in humans are
controlled by a single gene
 Inherited human disorders show either
1. recessive inheritance in which
– two recessive alleles are needed to show disease
– heterozygous parents are carriers of the disease-causing
allele
– the probability of inheritance increases with inbreeding,
mating between close relatives

1. dominant inheritance in which
– one dominant allele is needed to show disease and
– dominant lethal alleles are usually eliminated from the
population.
© 2012 Pearson Education, Inc.
Figure 9.9A

Normal
Dd

Parents

D

D
Offspring

Normal
Dd

×

Sperm

d

DD
Normal

Dd
Normal
(carrier)

Dd
Normal
(carrier)

dd
Deaf

Eggs
d
9.9
 The most common fatal genetic disease in the
United States is cystic fibrosis (CF), resulting in
excessive thick mucus secretions. The CF allele is
– recessive and
– carried by about 1 in 31 Americans.

 Dominant human disorders include
– achondroplasia, resulting in dwarfism, and
– Huntington’s disease, a degenerative disorder of the
nervous system.
© 2012 Pearson Education, Inc.
Table 9.9
9.10 New technologies can provide insight into
one’s genetic legacy
 New technologies offer ways to obtain genetic
information
– before conception,
– during pregnancy, and
– after birth.

 Genetic testing can identify potential parents who
are heterozygous carriers for certain diseases.

© 2012 Pearson Education, Inc.
9.10 New technologies can provide insight into
one’s genetic legacy
 Several technologies can be used for detecting
genetic conditions in a fetus.
– Amniocentesis extracts samples of amniotic fluid
containing fetal cells
– Usually performed in the sixteenth week of
pregnancy
– Chorionic villus sampling removes a sample of
chorionic villus tissue from the placenta and permits
similar karyotyping and biochemical tests.
– Usually performed in the eighth or ninth week of
pregnancy
© 2012 Pearson Education, Inc.
Figure 9.10A

Amniocentesis

Chorionic Villus Sampling (CVS)

Amniotic fluid
extracted

Ultrasound
transducer
Fetus

Ultrasound
transducer
Fetus
Placenta
Chorionic
villi

Placenta
Uterus
Cervix
Centrifugation
Amniotic fluid
Fetal cells
Several
hours
Cultured
cells

Tissue extracted
from the
chorionic villi

Several
weeks

Several
weeks
Karyotyping

Biochemical
and genetics
tests

Cervix
Uterus

Fetal cells
Several
hours

Several
hours
9.10
 Blood tests on the mother at 14–20 weeks of
pregnancy can help identify fetuses at risk for
certain birth defects (neural tube defects and
Down syndrome).
 Fetal imaging enables a physician to examine a
fetus directly for anatomical deformities. The most
common procedure is ultrasound imaging, using
sound waves to produce a picture of the fetus.
 Newborn screening can detect diseases that can
be prevented by special care and precautions.
 PKU
© 2012 Pearson Education, Inc.
Figure 9.10B
9.10
 New technologies raise ethical considerations that
include
– the confidentiality and potential use of results of
genetic testing,
– time and financial costs, and
– determining what, if anything, should be done as a
result of the testing.

© 2012 Pearson Education, Inc.
9.12 Many genes have more than two alleles in
the population
 Although an individual can at most carry two
different alleles for a particular gene, more than two
alleles often exist in the wider population.
 Human ABO blood group phenotypes involve three
alleles for a single gene.
 The four human blood groups, A, B, AB, and O,
result from combinations of these three alleles.
 The A and B alleles are both expressed in
heterozygous individuals, a condition known as
codominance.
© 2012 Pearson Education, Inc.
9.12 Many genes have more than two alleles in
the population
 In codominance,
– neither allele is dominant over the other and
– expression of both alleles is observed as a distinct
phenotype in the heterozygous individual.
– AB blood type is an example of codominance.

© 2012 Pearson Education, Inc.
Figure 9.12

Blood
Group
(Phenotype)

Genotypes

Carbohydrates Present
on Red Blood Cells

A

IAIA
or
IAi

Carbohydrate A

Reaction When Blood from Groups Below Is Mixed
with Antibodies from Groups at Left
O
A
B
AB

Carbohydrate B

B

IBIB
or
IBi

Antibodies
Present
in Blood

AB

O

IAIB

ii

Anti-B

Anti-A

Carbohydrate A
and
Carbohydrate B

Neither

None

Anti-A
Anti-B
No reaction

Clumping reaction
9.14 A single character may be influenced by
many genes
 Many characteristics result from polygenic
inheritance, in which a single phenotypic
character results from the additive effects of two or
more genes.
 Human skin color is an example of polygenic
inheritance.

© 2012 Pearson Education, Inc.
Figure 9.14_1

P generation

×
aabbcc
AABBCC
(very light) (very dark)

F1 generation

×
AaBbCc

AaBbCc
Figure 9.14_2

Sperm
F2 generation

1
8

1
8

1
8

1
8

1
8

1
8

1
8

1
8

1
8
1
8
1
8

Eggs

1
8
1
8
1
8
1
8
1
8

1
64

6
64

15
64

20
64

15
64

6
64

1
64
Figure 9.14_3

Fraction of population

20
64

15
64

6
64

1
64

Skin color
9.15 The environment affects many characters
 Many characters result from a combination of
heredity and the environment.
 skin color is affected by exposure to sunlight
 susceptibility to diseases, such as cancer, has
hereditary and environmental components
 identical twins show some differences

 Complex traits are determined by the cumulative
effects of genes and the influence of environment
 Examples: Skin color and IQ
 Only genetic influences are inherited.
© 2012 Pearson Education, Inc.

Chapter 9 part 2

  • 1.
    Chapter 9 Patterns ofInheritance PowerPoint Lectures for Campbell Biology: Concepts & Connections, Seventh Edition Reece, Taylor, Simon, and Dickey © 2012 Pearson Education, Inc. Lecture by Edward J. Zalisko
  • 2.
    Figure 9.0_1 Chapter 9:Big Ideas Mendel’s Laws The Chromosomal Basis of Inheritance Variations on Mendel’s Laws Sex Chromosomes and Sex-Linked Genes
  • 3.
    9.5 The lawof independent assortment is revealed by tracking two characters at once  The following figure demonstrates the law of independent assortment as it applies to two characters in Labrador retrievers: – black versus chocolate color, – normal vision versus progressive retinal atrophy. © 2012 Pearson Education, Inc.
  • 4.
    Figure 9.5B Blind Blind Phenotypes Genotypes Black coat, normalvision B_N_ Black coat, blind (PRA) B_nn Chocolate coat, normal vision bbN_ Chocolate coat, blind (PRA) bbnn Mating of double heterozygotes (black coat, normal vision) BbNn BbNn × Blind Blind Phenotypic ratio of the offspring 9 Black coat, normal vision 3 Black coat, blind (PRA) 3 Chocolate coat, normal vision 1 Chocolate coat, blind (PRA)
  • 5.
    Figure 9.5B_1 Blind Phenotypes Genotypes Black coat, normalvision B_N_ Black coat, blind (PRA) B_nn Blind Phenotypes Genotypes Chocolate coat, normal vision bbN_ Chocolate coat, blind (PRA) bbnn
  • 6.
    Figure 9.5B_2 Mating ofdouble heterozygotes (black coat, normal vision) BbNn × BbNn Blind Phenotypic ratio of the offspring 9 Black coat, normal vision Blind 1 3 3 Black coat, Chocolate coat, Chocolate coat, blind (PRA) blind (PRA) normal vision
  • 7.
    9.7 Mendel’s lawsreflect the rules of probability  Using his strong background in mathematics, Mendel knew that the rules of mathematical probability affected – the segregation of allele pairs during gamete formation and – the re-forming of pairs at fertilization.  The probability scale ranges from 0 to 1. An event that is – certain has a probability of 1 and – certain not to occur has a probability of 0. © 2012 Pearson Education, Inc.
  • 8.
    Evaluating Results  Mendelwas unable to analyze mathematically how well the actual outcome of his crosses fulfilled his predictions. – Karl Pearson developed the chi-square (χ2) test – Determines whether the observed distribution of individuals in as predicted or occurs by chance. – If there is no difference between the observed and expected classes the value for χ2 will be 0. – The value of χ2 increases with greater difference between the observed and expected classes. – The formula can be expressed as χ2 = Σ (O-E)2 ÷ E – O is # observed and E is # expected
  • 9.
    We must nowconvert χ2 into probability in order to determine if the χ2 value is expected.  df (degrees of freedom) = number of classes – 1  We can then use the table below to determine whether the data collected is acceptable. – A p value of less than 0.05 means that the observations do not meet the expected outcome and needs to be reexamined
  • 10.
    9.8 Genetic traitsin humans can be tracked through family pedigrees  The inheritance of human traits follows Mendel’s laws.  A pedigree – shows the inheritance of a trait in a family through multiple generations, – demonstrates dominant or recessive inheritance, and – can also be used to deduce genotypes of family members. © 2012 Pearson Education, Inc.
  • 11.
    Figure 9.8A Dominant Traits RecessiveTraits Freckles No freckles Widow’s peak Straight hairline Free earlobe Attached earlobe
  • 12.
    Figure 9.8B First generation (grandparents) Secondgeneration (parents, aunts, FF and uncles) or Ff Third generation (two sisters) Female Male Attached Free Ff ff Ff ff ff Ff Ff Ff ff ff FF or Ff
  • 13.
    9.9 Many inheriteddisorders in humans are controlled by a single gene  Inherited human disorders show either 1. recessive inheritance in which – two recessive alleles are needed to show disease – heterozygous parents are carriers of the disease-causing allele – the probability of inheritance increases with inbreeding, mating between close relatives 1. dominant inheritance in which – one dominant allele is needed to show disease and – dominant lethal alleles are usually eliminated from the population. © 2012 Pearson Education, Inc.
  • 14.
  • 15.
    9.9  The mostcommon fatal genetic disease in the United States is cystic fibrosis (CF), resulting in excessive thick mucus secretions. The CF allele is – recessive and – carried by about 1 in 31 Americans.  Dominant human disorders include – achondroplasia, resulting in dwarfism, and – Huntington’s disease, a degenerative disorder of the nervous system. © 2012 Pearson Education, Inc.
  • 16.
  • 17.
    9.10 New technologiescan provide insight into one’s genetic legacy  New technologies offer ways to obtain genetic information – before conception, – during pregnancy, and – after birth.  Genetic testing can identify potential parents who are heterozygous carriers for certain diseases. © 2012 Pearson Education, Inc.
  • 18.
    9.10 New technologiescan provide insight into one’s genetic legacy  Several technologies can be used for detecting genetic conditions in a fetus. – Amniocentesis extracts samples of amniotic fluid containing fetal cells – Usually performed in the sixteenth week of pregnancy – Chorionic villus sampling removes a sample of chorionic villus tissue from the placenta and permits similar karyotyping and biochemical tests. – Usually performed in the eighth or ninth week of pregnancy © 2012 Pearson Education, Inc.
  • 19.
    Figure 9.10A Amniocentesis Chorionic VillusSampling (CVS) Amniotic fluid extracted Ultrasound transducer Fetus Ultrasound transducer Fetus Placenta Chorionic villi Placenta Uterus Cervix Centrifugation Amniotic fluid Fetal cells Several hours Cultured cells Tissue extracted from the chorionic villi Several weeks Several weeks Karyotyping Biochemical and genetics tests Cervix Uterus Fetal cells Several hours Several hours
  • 20.
    9.10  Blood testson the mother at 14–20 weeks of pregnancy can help identify fetuses at risk for certain birth defects (neural tube defects and Down syndrome).  Fetal imaging enables a physician to examine a fetus directly for anatomical deformities. The most common procedure is ultrasound imaging, using sound waves to produce a picture of the fetus.  Newborn screening can detect diseases that can be prevented by special care and precautions.  PKU © 2012 Pearson Education, Inc.
  • 21.
  • 22.
    9.10  New technologiesraise ethical considerations that include – the confidentiality and potential use of results of genetic testing, – time and financial costs, and – determining what, if anything, should be done as a result of the testing. © 2012 Pearson Education, Inc.
  • 23.
    9.12 Many geneshave more than two alleles in the population  Although an individual can at most carry two different alleles for a particular gene, more than two alleles often exist in the wider population.  Human ABO blood group phenotypes involve three alleles for a single gene.  The four human blood groups, A, B, AB, and O, result from combinations of these three alleles.  The A and B alleles are both expressed in heterozygous individuals, a condition known as codominance. © 2012 Pearson Education, Inc.
  • 24.
    9.12 Many geneshave more than two alleles in the population  In codominance, – neither allele is dominant over the other and – expression of both alleles is observed as a distinct phenotype in the heterozygous individual. – AB blood type is an example of codominance. © 2012 Pearson Education, Inc.
  • 25.
    Figure 9.12 Blood Group (Phenotype) Genotypes Carbohydrates Present onRed Blood Cells A IAIA or IAi Carbohydrate A Reaction When Blood from Groups Below Is Mixed with Antibodies from Groups at Left O A B AB Carbohydrate B B IBIB or IBi Antibodies Present in Blood AB O IAIB ii Anti-B Anti-A Carbohydrate A and Carbohydrate B Neither None Anti-A Anti-B No reaction Clumping reaction
  • 26.
    9.14 A singlecharacter may be influenced by many genes  Many characteristics result from polygenic inheritance, in which a single phenotypic character results from the additive effects of two or more genes.  Human skin color is an example of polygenic inheritance. © 2012 Pearson Education, Inc.
  • 27.
    Figure 9.14_1 P generation × aabbcc AABBCC (verylight) (very dark) F1 generation × AaBbCc AaBbCc
  • 28.
  • 29.
    Figure 9.14_3 Fraction ofpopulation 20 64 15 64 6 64 1 64 Skin color
  • 30.
    9.15 The environmentaffects many characters  Many characters result from a combination of heredity and the environment.  skin color is affected by exposure to sunlight  susceptibility to diseases, such as cancer, has hereditary and environmental components  identical twins show some differences  Complex traits are determined by the cumulative effects of genes and the influence of environment  Examples: Skin color and IQ  Only genetic influences are inherited. © 2012 Pearson Education, Inc.

Editor's Notes

  • #3 Figure 9.0_1 Chapter 9: Big Ideas
  • #4 Student Misconceptions and Concerns Students using Punnett squares need to be reminded that the calculations are expected statistical probabilities and not absolutes. We would expect that any six playing cards dealt might be half black and half red, but we frequently find that this is not true. This might be a good time to show how larger sample sizes increase the likelihood that sampling will reflect expected ratios. Teaching Tips Understanding dihybrid crosses may be the most difficult concept in this chapter. Consider spending additional time to make these ideas very clear. As the text indicates, dihybrid crosses are essentially two monohybrid crosses occurring simultaneously.
  • #5 Figure 9.5B Independent assortment of two genes in the Labrador retriever
  • #6 Figure 9.5B_1 Independent assortment of two genes in the Labrador retriever (part 1)
  • #7 Figure 9.5B_2 Independent assortment of two genes in the Labrador retriever (part 2)
  • #8 Student Misconceptions and Concerns Students using Punnett squares need to be reminded that the calculations are expected statistical probabilities and not absolutes. We would expect that any six playing cards dealt might be half black and half red, but we frequently find that this is not true. This might be a good time to show how larger sample sizes increase the likelihood that sampling will reflect expected ratios. Teaching Tips Many students have trouble with the basic statistics that are necessary for many of these calculations. Give your students some practice. Consider having them work in pairs, each with a pair of dice (for large class sizes, this can be done in laboratories). Let them calculate the odds of rolling three sixes in a row and other possibilities.
  • #11 Student Misconceptions and Concerns Students might think that dominant alleles are naturally (a) more common, (b) more likely to be inherited, and (c) better for an organism. The text notes that this is not necessarily true. However, this might need to be emphasized further in lecture. Teaching Tips Students seem to learn much from Figure 9.8b by analyzing the possible genotypes for the people whose complete genotype is not known. Consider challenging your students to suggest the possible genotypes for these people, perhaps during lecture.
  • #12 Figure 9.8A Examples of single-gene inherited traits in humans
  • #13 Figure 9.8B A pedigree showing the inheritance of attached versus free earlobes in a hypothetical family
  • #14 Teaching Tips 1. The 2/3 fraction noted in the discussion of carriers of a recessive disorder for deafness often catches students off guard . . . as they are expecting odds of 1/4, 1/2, or 3/4. However, when we eliminate the dd (deaf) possibility, as it would not be a carrier, we have three possible genotypes. Thus, the odds are based out of the remaining three genotypes Dd, dD, and DD. Consider adding this point of clarification to your lecture. 2. As a simple test of comprehension, ask students to explain why lethal alleles are not eliminated from a population. Several possibilities exist: a) The lethal allele might be recessive, persisting in the population due to the survival of carriers, or b) the lethal allele might be dominant, but is not expressed until after the age of reproduction. 3. Ask your class a) what the odds are of a person developing Huntington’s disease if a parent has this disease (50%) and b) whether they would want this genetic test if they were a person at risk. The Huntington Disease Society website, www.hdsa.org, offers many additional details. It is a good starting point for those who want to explore this disease in more detail.
  • #15 Figure 9.9A Offspring produced by parents who are both carriers for a recessive disorder, a type of deafness
  • #16 Teaching Tips 1. The 2/3 fraction noted in the discussion of carriers of a recessive disorder for deafness often catches students off guard . . . as they are expecting odds of 1/4, 1/2, or 3/4. However, when we eliminate the dd (deaf) possibility, as it would not be a carrier, we have three possible genotypes. Thus, the odds are based out of the remaining three genotypes Dd, dD, and DD. Consider adding this point of clarification to your lecture. 2. As a simple test of comprehension, ask students to explain why lethal alleles are not eliminated from a population. Several possibilities exist: a) The lethal allele might be recessive, persisting in the population due to the survival of carriers, or b) the lethal allele might be dominant, but is not expressed until after the age of reproduction. 3. Ask your class a) what the odds are of a person developing Huntington’s disease if a parent has this disease (50%) and b) whether they would want this genetic test if they were a person at risk. The Huntington Disease Society website, www.hdsa.org, offers many additional details. It is a good starting point for those who want to explore this disease in more detail.
  • #17 Table 9.9 Some Autosomal Disorders in Humans
  • #18 Teaching Tips Medical technology raises many ethical issues. Consider asking your students this practical question. How much routine fetal testing do we want our insurance companies to cover and at what cost for health insurance? Ultrasound, for example, is routinely performed on pregnant women as a normal part of prenatal care. What other tests should be standard? Who should decide? Who should pay?
  • #19 Teaching Tips Medical technology raises many ethical issues. Consider asking your students this practical question. How much routine fetal testing do we want our insurance companies to cover and at what cost for health insurance? Ultrasound, for example, is routinely performed on pregnant women as a normal part of prenatal care. What other tests should be standard? Who should decide? Who should pay?
  • #20 Figure 9.10A Testing a fetus for genetic disorders
  • #21 Teaching Tips Medical technology raises many ethical issues. Consider asking your students this practical question. How much routine fetal testing do we want our insurance companies to cover and at what cost for health insurance? Ultrasound, for example, is routinely performed on pregnant women as a normal part of prenatal care. What other tests should be standard? Who should decide? Who should pay?
  • #22 Figure 9.10B Ultrasound scanning of a fetus
  • #23 Teaching Tips Medical technology raises many ethical issues. Consider asking your students this practical question. How much routine fetal testing do we want our insurance companies to cover and at what cost for health insurance? Ultrasound, for example, is routinely performed on pregnant women as a normal part of prenatal care. What other tests should be standard? Who should decide? Who should pay?
  • #24 Student Misconceptions and Concerns 1. After reading the preceding modules, students might expect all traits to be governed by a single gene with two alleles, one dominant over the other. Modules 9.11–9.15 describe deviations from simplistic models of inheritance. 2. As these variations of Mendel’s laws are introduced, students are likely to get confused and become uncertain about the prior definitions. Consider keeping a clear definition of these different patterns of inheritance available for the class to refer to as new patterns are discussed (perhaps as a handout for student reference). 3. As your class size increases, the chances increase that at least one student will have a family member with one of the genetic disorders discussed. Some students may find this embarrassing, but others might have a special interest in learning more about these topics, and may even be willing to share some of their family’s experiences with the class. Teaching Tips 1. Students can think of blood types as analogous to socks on their feet. You can have socks that match, a sock on one foot but not the other, you can wear two socks that do not match, or you can even go barefoot (type O blood)! Developed further, think of Amber (A) and Blue (B) socks. Type A blood can have an Amber sock with either another Amber sock or a bare foot (or “zero” sock). Blue socks work the same way. One amber and one blue sock represent the AB blood type. No socks, as already noted, represent type O. 2. Consider specifically comparing the principles of codominance (expression of both alleles) and incomplete dominance (expression of one intermediate trait). Students will likely benefit from this direct comparison.
  • #25 Student Misconceptions and Concerns 1. After reading the preceding modules, students might expect all traits to be governed by a single gene with two alleles, one dominant over the other. Modules 9.11–9.15 describe deviations from simplistic models of inheritance. 2. As these variations of Mendel’s laws are introduced, students are likely to get confused and become uncertain about the prior definitions. Consider keeping a clear definition of these different patterns of inheritance available for the class to refer to as new patterns are discussed (perhaps as a handout for student reference). 3. As your class size increases, the chances increase that at least one student will have a family member with one of the genetic disorders discussed. Some students may find this embarrassing, but others might have a special interest in learning more about these topics, and may even be willing to share some of their family’s experiences with the class. Teaching Tips 1. Students can think of blood types as analogous to socks on their feet. You can have socks that match, a sock on one foot but not the other, you can wear two socks that do not match, or you can even go barefoot (type O blood)! Developed further, think of Amber (A) and Blue (B) socks. Type A blood can have an Amber sock with either another Amber sock or a bare foot (or “zero” sock). Blue socks work the same way. One amber and one blue sock represent the AB blood type. No socks, as already noted, represent type O. 2. Consider specifically comparing the principles of codominance (expression of both alleles) and incomplete dominance (expression of one intermediate trait). Students will likely benefit from this direct comparison.
  • #26 Figure 9.12 Multiple alleles for the ABO blood groups
  • #27 Student Misconceptions and Concerns 1. After reading the preceding modules, students might expect all traits to be governed by a single gene with two alleles, one dominant over the other. Modules 9.11–9.15 describe deviations from simplistic models of inheritance. 2. As these variations of Mendel’s laws are introduced, students are likely to get confused and become uncertain about the prior definitions. Consider keeping a clear definition of these different patterns of inheritance available for the class to refer to as new patterns are discussed (perhaps as a handout for student reference). 3. As your class size increases, the chances increase that at least one student will have a family member with one of the genetic disorders discussed. Some students may find this embarrassing, but others might have a special interest in learning more about these topics, and may even be willing to share some of their family’s experiences with the class. Teaching Tips 1. Polygenic inheritance makes it possible for children to inherit genes to be taller or shorter than either parent. Similarly, skin tones can be darker or lighter than either parent. The environment also contributes significantly to the final phenotype for both of these traits. 2. The authors note that polygenic inheritance is the converse of pleiotropy. This is worth noting in lecture as these concepts are discussed. We often remember concepts better when they are contrasted in pairs.
  • #28 Figure 9.14_1 A model for polygenic inheritance of skin color (part 1)
  • #29 Figure 9.14_2 A model for polygenic inheritance of skin color (part 2)
  • #30 Figure 9.14_3 A model for polygenic inheritance of skin color (part 3)
  • #31 Student Misconceptions and Concerns 1. After reading the preceding modules, students might expect all traits to be governed by a single gene with two alleles, one dominant over the other. Modules 9.11–9.15 describe deviations from simplistic models of inheritance. 2. As these variations of Mendel’s laws are introduced, students are likely to get confused and become uncertain about the prior definitions. Consider keeping a clear definition of these different patterns of inheritance available for the class to refer to as new patterns are discussed (perhaps as a handout for student reference). 3. As your class size increases, the chances increase that at least one student will have a family member with one of the genetic disorders discussed. Some students may find this embarrassing, but others might have a special interest in learning more about these topics, and may even be willing to share some of their family’s experiences with the class. Teaching Tips 1. The authors note that polygenic inheritance is the converse of pleiotropy. This is worth noting in lecture as these concepts are discussed. We often remember concepts better when they are contrasted in pairs. 2. As the authors are careful to note, although genetics and the environment both contribute to the final phenotypes, only the genetic factors are inherited. This distinction is important to understanding the limitations of Lamarck’s mechanisms of evolution. If you will address principles of evolution soon after this chapter, this may be an important distinction to reinforce in lecture. References to tattoos and piercing may also help to distinguish between environmental influences and inheritance. Students with tattoos will not produce children born with tattoos!