Downloaded 291 times
![Comparison of Columns: Effect of Particle Size on Efficiency and Resolution for a Reduced
Antibody
Theoretical Plates
[-17pt]
Columns
Dimension
s (m i.d. ×
mm length)
Particle
size (μm)
Pore sizes
(Å) HC LC Resolution
TSKgel
G3000SW
7.5 × 300 10 250 1980 3845 3
TSKgel
G3000SWxl
7.8 × 300 5 250 5060 10674 4
Shodex
KW-804
8.0 × 300 7 250 4952 8859 2
Protein-Pak
300SW
7.5 × 300 10 250 2078 4271 3
BioSuite
250
7.8 × 300 5 250 5149 9403 3](https://image.slidesharecdn.com/sizeexclusionchromatography-141126180040-conversion-gate01/85/Size-exclusion-chromatography-13-320.jpg)
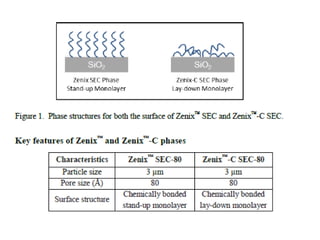
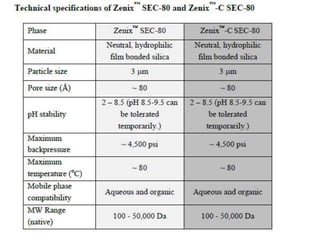
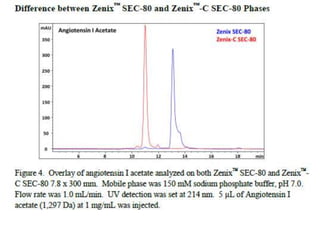
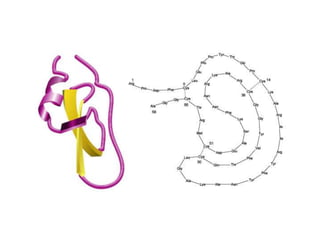
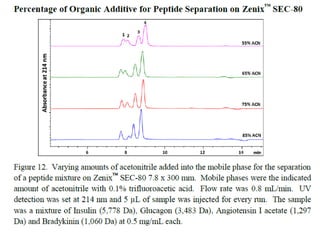
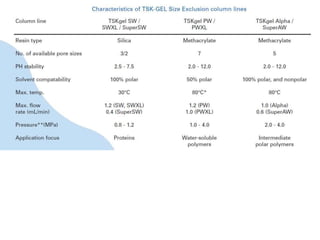
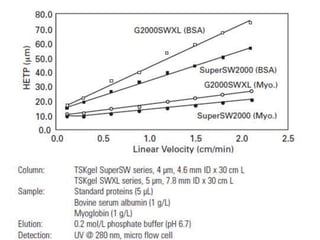
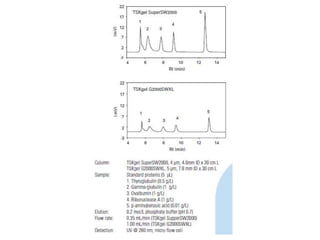
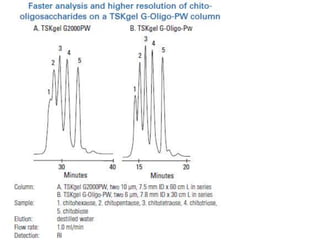
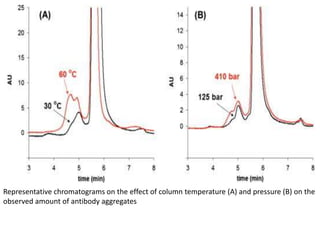
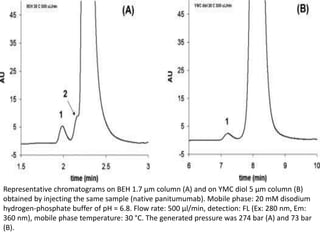
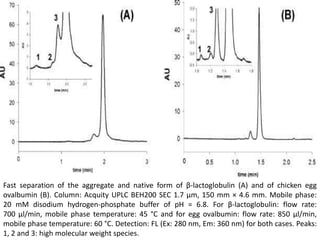
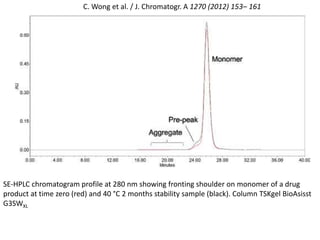
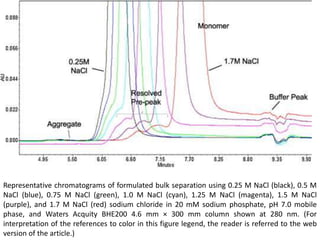
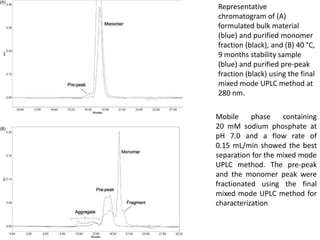
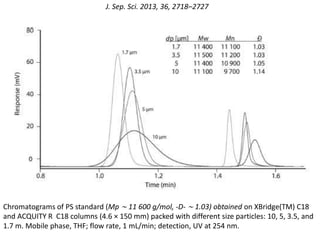
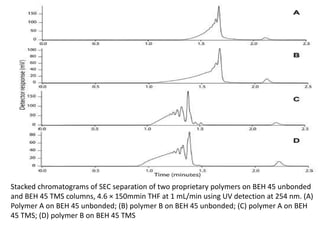
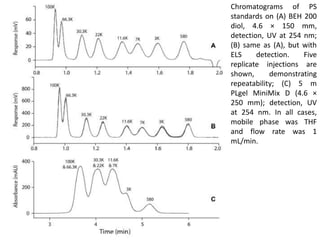
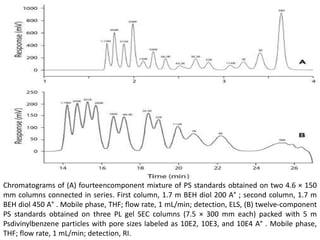
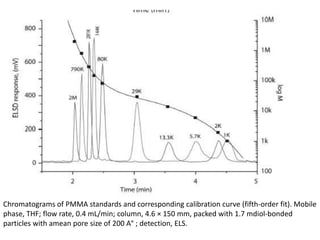

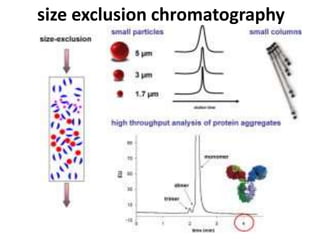
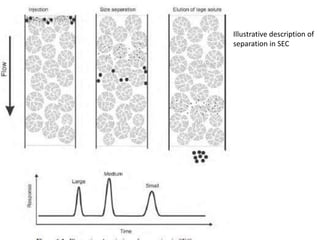
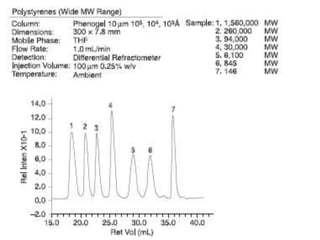
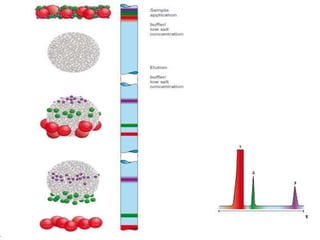
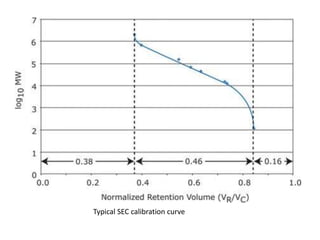
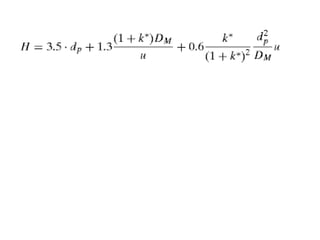
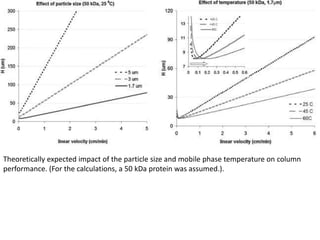
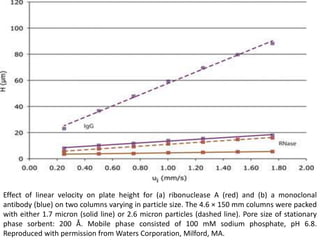
Size exclusion chromatography (SEC) separates molecules based on size, with larger molecules eluting earlier than smaller ones. SEC is driven by entropy rather than adsorption, with no interaction between the stationary and mobile phases. Temperature has little impact on retention in SEC. Separation is achieved as molecules of different sizes access different portions of pores in the stationary phase packing material. The document provides examples of using SEC to analyze various proteins and polymers, demonstrating the impact of parameters like particle size, temperature, mobile phase composition, and column type on separation efficiency and resolution.


