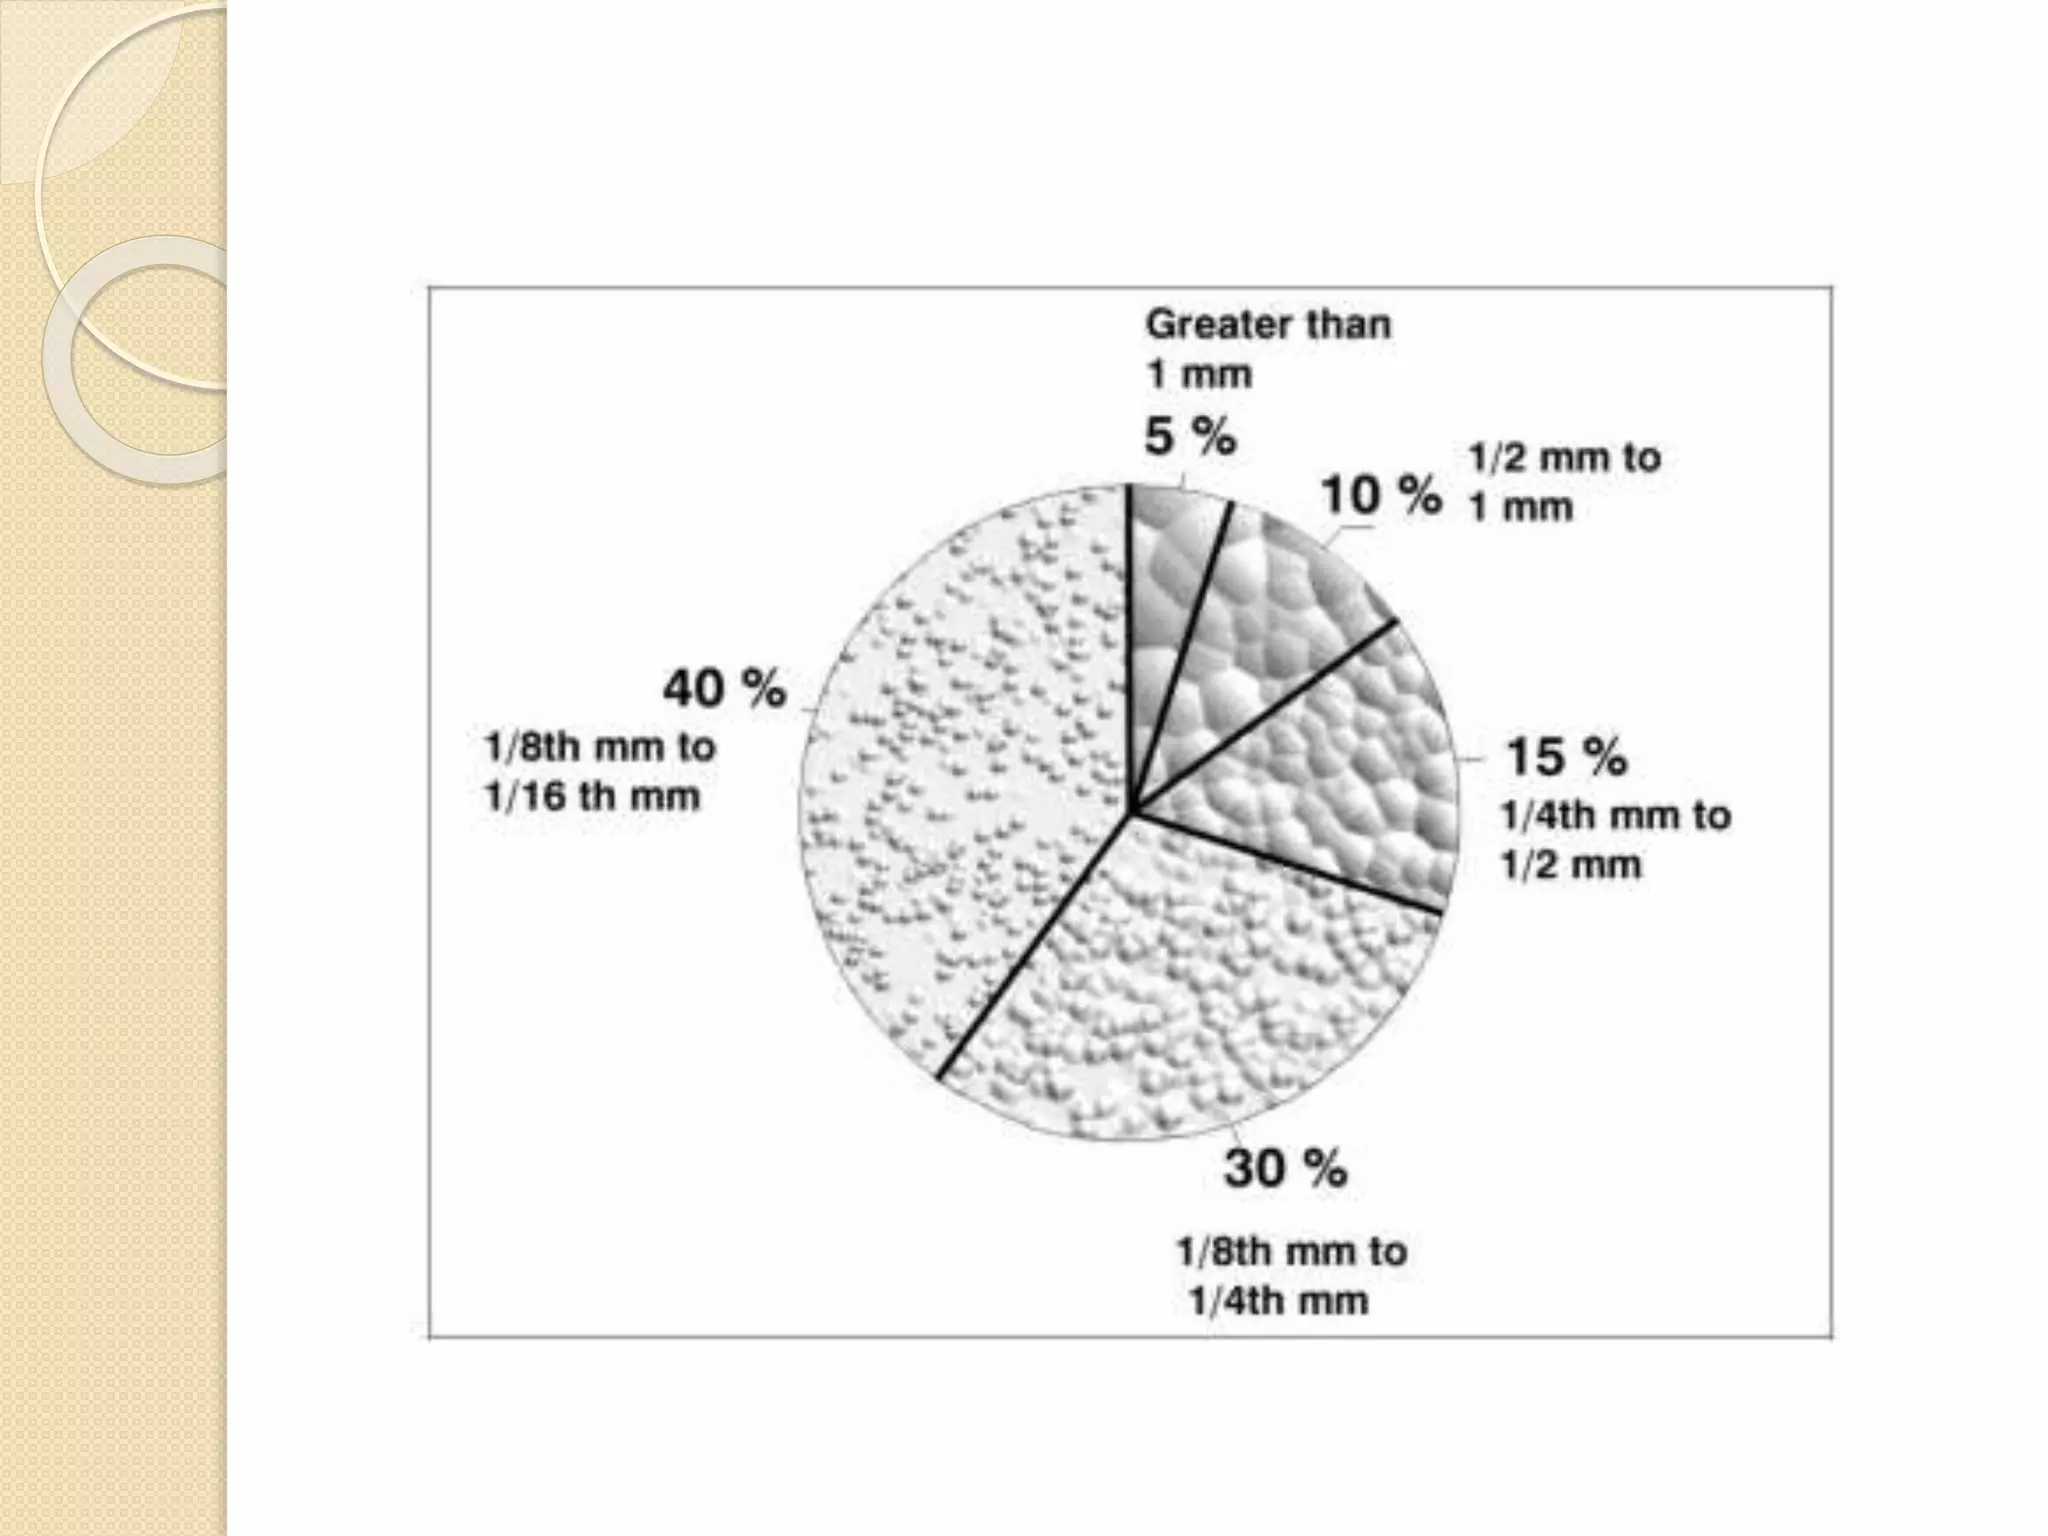
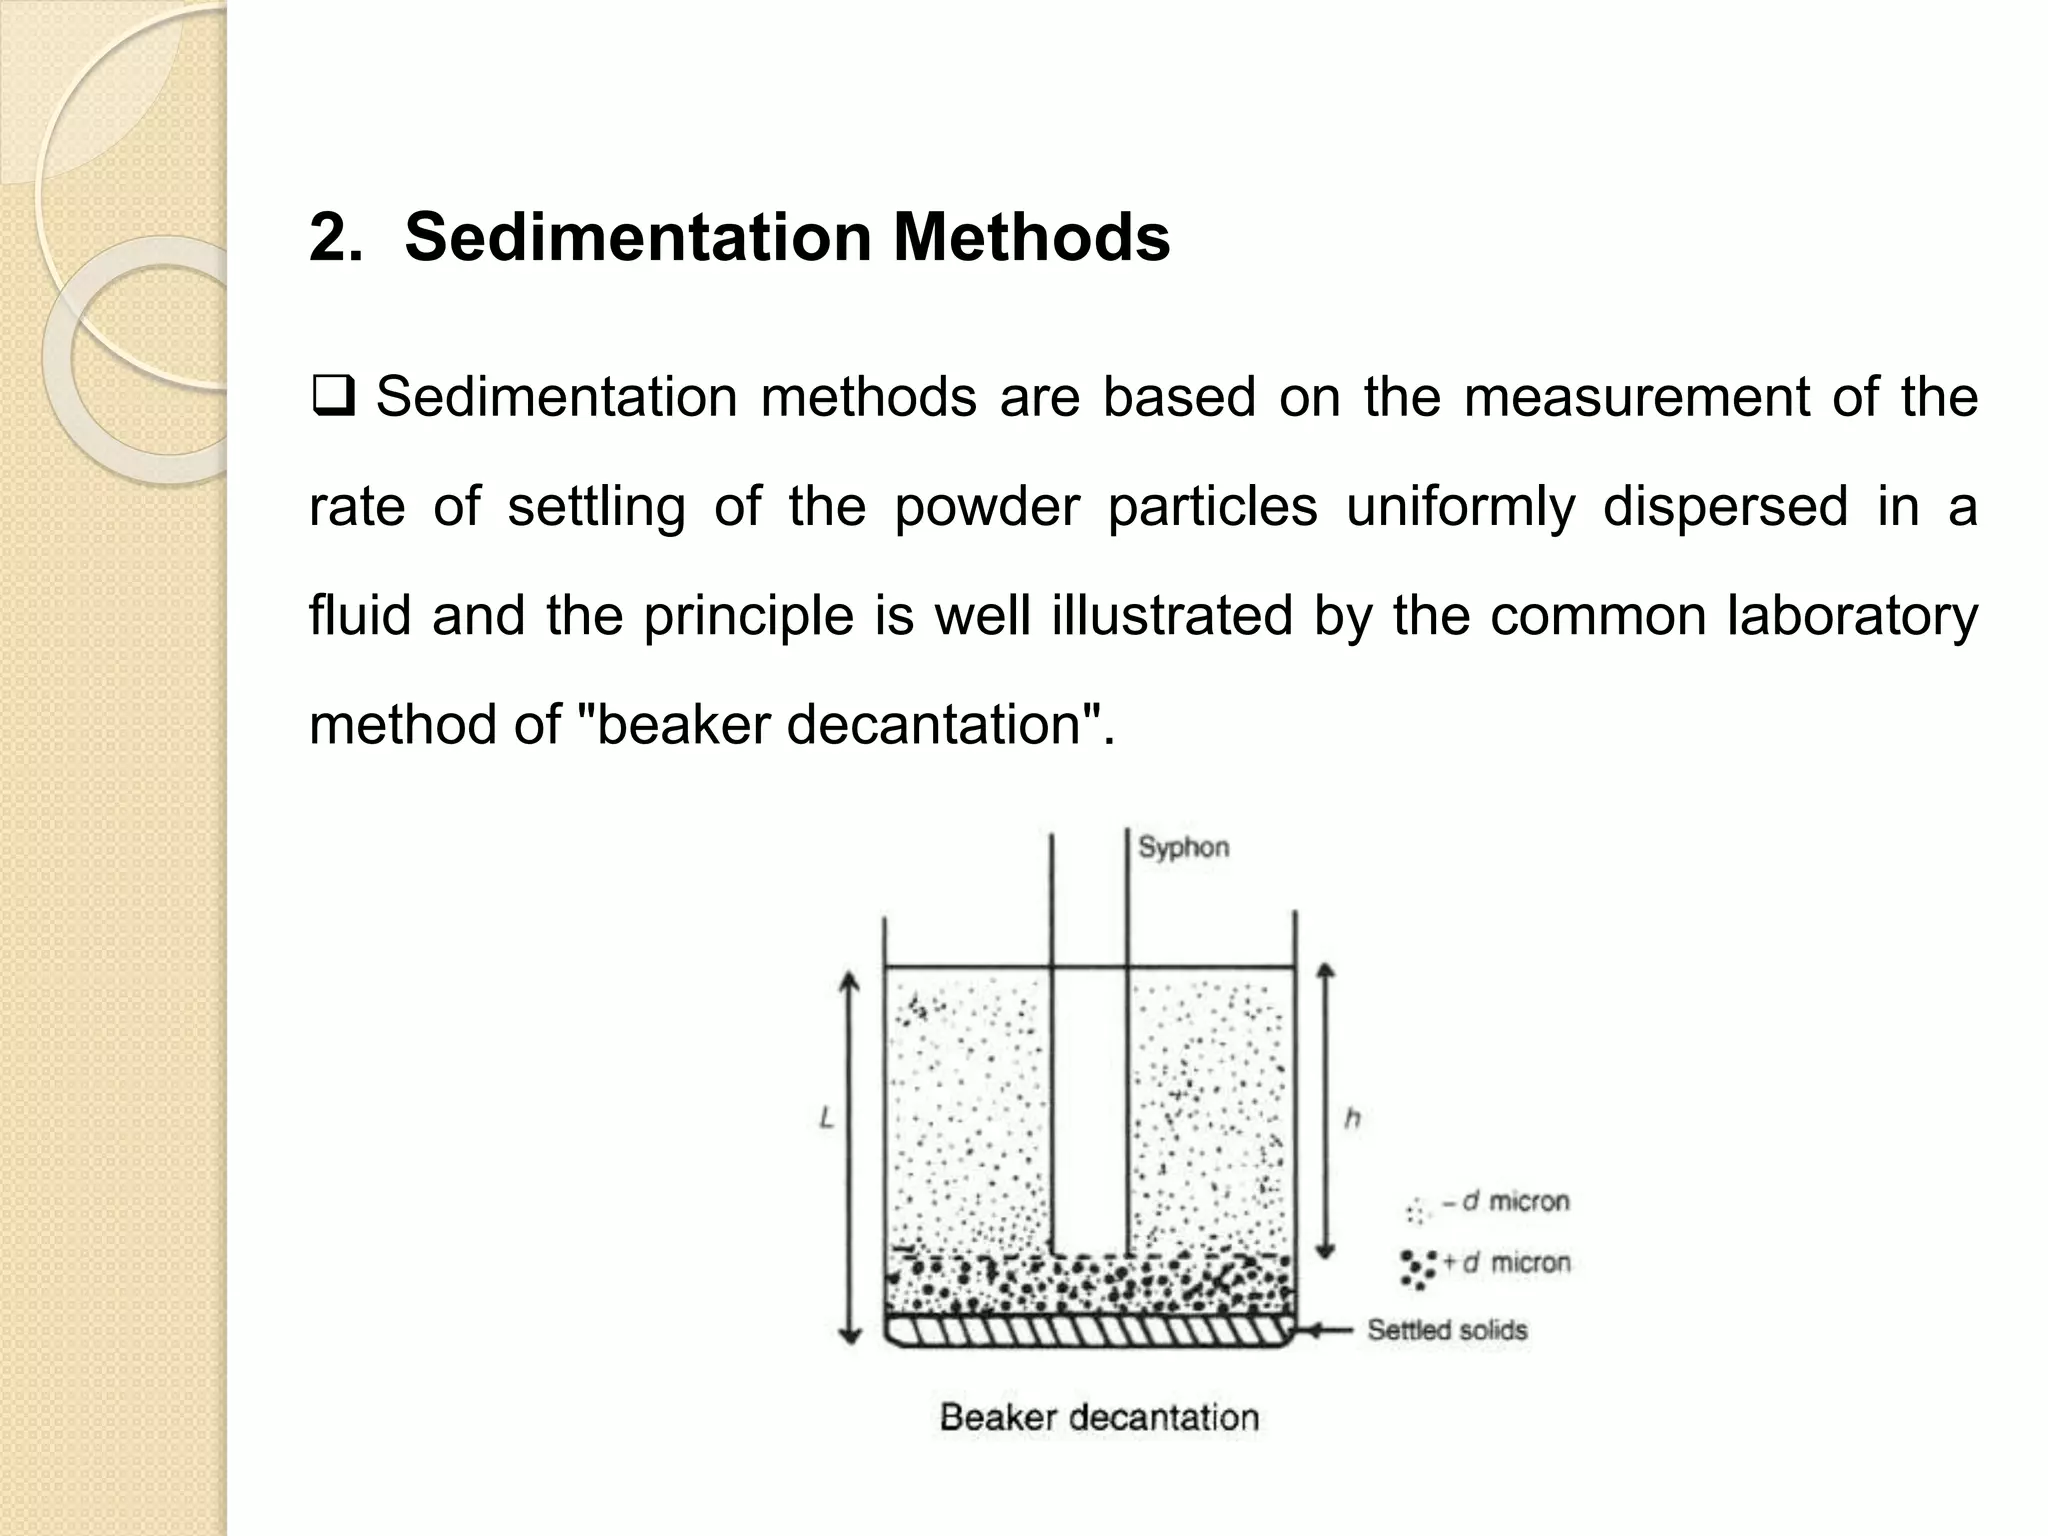
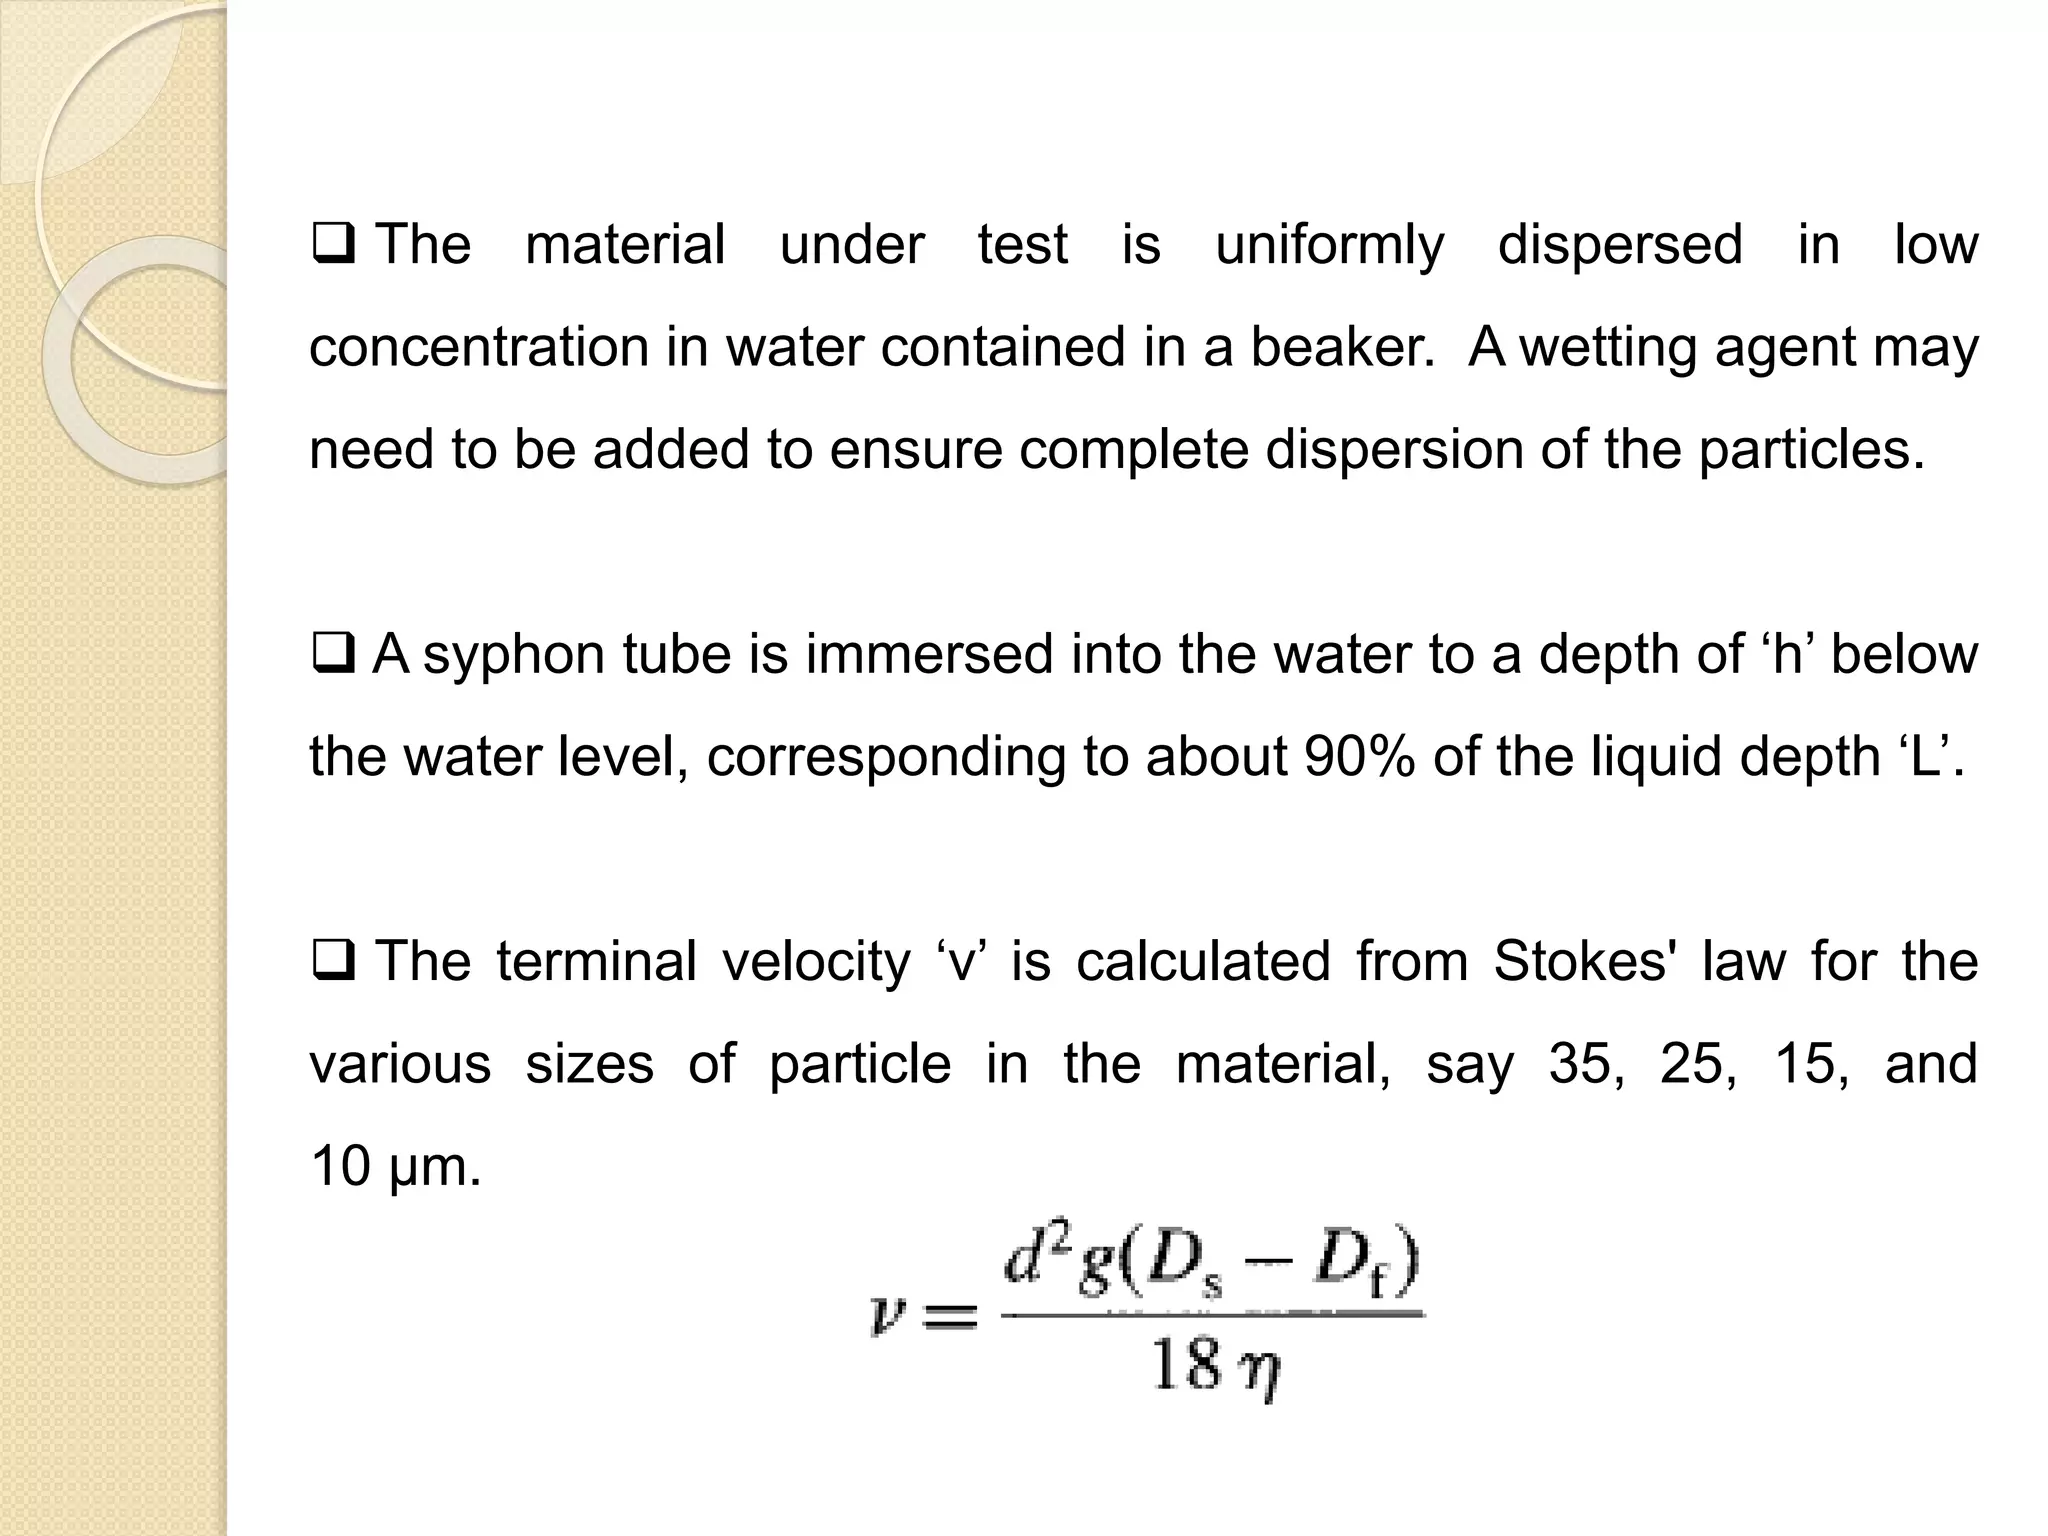
Particle Size
Distribution
(PSD)
Engr. Ayesha Siddiqa
Particle Size Distribution
Objective
 Understanding of Particle Size and Particle Shape
 Particle Size Distribution (PSD)
 Significance of Particle Size Distribution (PSD)
 Particle Size Distribution: Sampling
 Particle Size Distribution: Measurement Techniques
 Particle Size Distribution: Graphical Representation
Particle Size Distribution
Understanding of Particle Size and
Particle Shape
Particle Size
Particle size or grain size refers to the diameter of a grain of
granular material
Particle Size Distribution
 The size of a spherical homogeneous particle is uniquely
defined by its diameter.
 For regular, compact particles such as cubes or regular
tetrahedra, a single dimension can be used to define size.
 With some regular particles it may be necessary to specify
more than one dimension: For a cone the base diameter
and height are required whilst for a cuboid three
dimensions are needed.
Particle Size Distribution
 For irregular particles, it is desirable to quote the size of a
particle in terms of a single quantity, and the expression most
often used is the "equivalent diameter".
This refers to the diameter of a sphere that would behave in the
same manner as the particle when submitted to some specified
operation.
 The assigned equivalent diameter usually depends on the
method of measurement, hence the particle-sizing
technique should, wherever possible, duplicate the
process one wishes to control.
 Several equivalent diameters are commonly encountered.
For example, the Stokes' diameter is measured by
sedimentation and elutriation techniques; the projected
area diameter is measured microscopically and the sieve-
aperture diameter is measured by means of sieving.
Particle Size Distribution
Influences of Particle Size
 Particle size influences dissolution
Small particles dissolve more rapidly than large ones, which is
important not only in determining the behavior of the drug in vivo
but also in various manufacturing processes.
 Particle size influences flow properties of powders
The flow properties of powders are strongly dependent on particle
size and, in particular, particle shape. Since most powders are
moved from one place to another by flowing, control of flow behavior
is highly important. Generally, coarse, roughly spherical particles
flow much more easily than small or elongated particles.
 Particle size influences stability of dispersions
The stability of dispersions, such as suspensions and emulsions,
depends on the size of the dispersed material. The forces between
colloidal particles depend on their dimensions, and the settling.
Particle Size Distribution
 The length is the distance between two tangential planes
which are perpendicular to those defining the thickness and
breadth.
 In practice it may be difficult to measure the particle thickness,
particularly from microscopy, and so often we are limited to using
simply the elongation ratio, as shown in Figure.
Particle Size Distribution
Shape Factor
 The ratio of two equivalent diameters obtained by different
methods is termed a shape factor.
 Shape factors describe the departure of the particle from a
spherical form.
One of the simplest is the sphericity, Ψ, defined by Wadell
(1934) as:
Particle Size Distribution
Effect of Particle Shape
 Particle shape influences such properties as:
Flowability of powders
Packing
Interaction with fluids and the covering power of pigments
 The variation between the diameters increases as the particles
diverge more from the spherical shape.
 Different results from different techniques can be compared by
applying shape factors and shape coefficients.
Particle Size Distribution
SEM picture of Polystyrene
Particle Size Distribution
 The particle size distribution (PSD) may be defined as
“Particle size distribution (PSD) of a powder, or granular material,
or particles dispersed in fluid, is a list of values or a mathematical
function that defines the relative amounts of particles present,
sorted according to size.”
 Particle size distribution is also known as grain size distribution.
Particle Size Distribution
Significance of Particle Size Distribution (PSD)
 The PSD of a material can be important in understanding its
physical and chemical properties.
 It affects the strength and load-bearing properties of rocks and
soils.
 It affects the reactivity of solids participating in chemical
reactions, and needs to be tightly controlled in many industrial
products such as the manufacture of printer toner and cosmetics.
Particle Size Distribution
Particle Size Distribution: Measurement Techniques
 There is a wide range of instrumental and other methods of
particle size analysis available. Some of the more common
methods are:
1. Sieve Analysis
2. Sedimentation Methods
3. Elutriation Techniques
4. Microscopic Sizing and Image Analysis
5. Electrical Impedance Method
6. Laser Diffraction Methods
Particle Size Distribution
1. Sieve Analysis
 Sieve analysis is one of the oldest methods of size analysis.
 Sieve analysis is accomplished by passing a known weight of
sample material successively through finer sieves and weighing
the amount collected on each sieve to determine the percentage
weight in each size fraction.
 Sieving is carried out with wet or dry materials and the sieves
are usually agitated to expose all the particles to the openings.
Particle Size Distribution
Process of Sieving
 The process of sieving may be divided into two stages.
 First, the elimination of particles considerably smaller than the
screen apertures, which should occur fairly rapidly and, second,
the separation of the so-called "near-size" particles, which is a
gradual process rarely reaching final completion.
 The effectiveness of a sieving test depends on the amount of
material put on the sieve (the "charge") and the type of movement
imparted to the sieve.
Particle Size Distribution
Test Sieves
 Test sieves are designated by the nominal aperture size, which
is the nominal central separation of opposite sides of a square
aperture or the nominal diameter of a round aperture.
Particle Size Distribution
 The woven sieve is the oldest design, and it is normally made
by weaving fine metal wire into a square pattern, then soldering
the edges securely into a flattish cylindrical Container.
 Woven-wire sieves were originally designated by a mesh
number, which referred to the number of wires per inch, which is
the same as the number of square apertures per square inch.
Particle Size Distribution
Presentation of Results
 There are several ways in which the results of a sieve test can
be tabulated. The three most convenient methods are shown in
table.
Particle Size Distribution
Table shows:
(1) The sieve size ranges used in the test.
(2) The weight of material in each size range, e.g. 1.32 g of
material passed through the 250 μm sieve, but was
retained on the 180 μm sieve: the material therefore is in
the size range -250 to +180 μm.
(3) The weight of material in each size range expressed as a
percentage of the total weight.
(4) The nominal aperture sizes of the sieves used in the test.
(5) The cumulative percentage of material passing through
the sieves, e.g. 87.5% of the material is less than 125 μm
in size.
(6) The cumulative percentage of material retained on the
sieves.
Particle Size Distribution
Technique Advantages
1) This technique is well-adapted for bulk materials.
2) It is required to produce a separated size fraction for
further study.
3) The material flows easily as discrete particles.
4) The material is fairly coarse, e.g. above 100 μm, and
contains few fines.
5) The powder is composed of materials with a range of
different densities, different refractive indices or is water-
soluble.
Particle Size Distribution
Technique Disadvantages
1) Much fine material below 100 μm is present, unless
specialized microsieving equipment is available.
2) The particles are fragile.
3) The particles are in the form of elongated needles.
4) The material adheres to the sieve or forms clumps.
5) The powder easily acquires an electrostatic charge.
Particle Size Distribution
2. Sedimentation Methods
 Sedimentation methods are based on the measurement of the
rate of settling of the powder particles uniformly dispersed in a
fluid and the principle is well illustrated by the common laboratory
method of "beaker decantation".
Particle Size Distribution
 The material under test is uniformly dispersed in low
concentration in water contained in a beaker. A wetting agent may
need to be added to ensure complete dispersion of the particles.
 A syphon tube is immersed into the water to a depth of ‘h’ below
the water level, corresponding to about 90% of the liquid depth ‘L’.
 The terminal velocity ‘v’ is calculated from Stokes' law for the
various sizes of particle in the material, say 35, 25, 15, and
10 μm.
Particle Size Distribution
 The time required for a 10 μm particle to settle from the water
level to the bottom of the syphon tube, distance ‘h’, is calculated
(t = h/v).
 The pulp is gently stirred to disperse the particles through the
whole volume of water and then it is allowed to stand for the
calculated time.
 The water above the end of the tube is syphoned off and all
particles in this water are assumed to be smaller than 10 μm
diameter.
Particle Size Distribution
Technique Advantages
 The method is simple and cheap.
 This methods has the advantage over many other sub-sieve
techniques in that it produces a true fractional size analysis.
Technique Disadvantages
 This method is, however, extremely tedious, as long settling
times are required for very fine particles, and separate tests must
be performed for each particle size.
Particle Size Distribution
Andreasen Pipette Technique
 A much quicker and less-tedious
method of sedimentation analysis is
the Andreasen Pipette Technique.
 The method is much quicker than
beaker decantation, as samples are
taken off successively throughout the
test for increasingly finer particle
sizes.
Particle Size Distribution
3. Elutriation Techniques
 Elutriation is a process of sizing
particles by means of an upward
current of fluid, usually water or air.
 The process is the reverse of
gravity sedimentation, and Stokes'
law applies.
 All elutriators consist of one or
more "sorting columns“ in which the
fluid is rising at a constant velocity.
Particle Size Distribution
 Feed particles introduced into the sorting column will be
separated into two fractions, according to their terminal velocities,
calculated from Stokes' law.
 Those particles having a terminal velocity less than that of the
velocity of the fluid will report to the overflow, while those particles
having a greater terminal velocity than the fluid velocity will sink to
the underflow.
 Elutriation is carried out until there are no visible signs of further
classification taking place or the rate of change in weights of the
products is negligible.
Particle Size Distribution
Technique Advantages
 Elutriation appears more attractive than decantation, and has
certain practical advantages in that the volume changes need no
operator attention.
Technique Disadvantages
 The fluid velocity is not constant across the sorting column,
being a minimum at the walls of the column, and a maximum at
the centre. The separation size is calculated from the mean
volume flow, so that some coarse particles are misplaced in the
overflow, and some fines are misplaced into the coarse overflow.
Particle Size Distribution
4. Microscopic Sizing and Image Analysis
 Microscopy can be used as an absolute method of particle size
analysis since it is the only method in which individual mineral
particles are observed and measured.
 The image of a particle seen in a microscope is two
dimensional and from this image an estimate of particle size must
be made.
 Microscopic sizing involves comparing the projected area of a
particle with the areas of reference circles, or graticules, of known
sizes.
Particle Size Distribution
 The optical microscope method is applicable to particles in the
size range 0.8-150 μm, and down to 0.001 μm using electron
microscopy.
 Manual analysis of microscope slides is tedious and error
prone; semi-automatic and automatic systems have been
developed which speed up analyses and reduce the tedium of
manual methods.
 The development of quantitative image analysis has made
possible the rapid sizing of fine particles using small laboratory
samples.
Particle Size Distribution
5. Electrical Impedance Method
 The Beckman Coulter Counter makes use of current changes in
an electrical circuit reduced by the presence of a particle.
 The instrument is applicable in the range 0.4-1200 μm.
Particle Size Distribution
5. Laser Diffraction Methods
 Laser light is passed through a dilute suspension of the
particles which circulate through an optical cell. The light is
scattered by the particles, and is detected by a solid state detector
which measures light intensity over a range of angles.
 A theory of light scattering is used to calculate the particle size
distribution from the light distribution pattern, finer particles
inducing more scatter than coarse.
Particle Size Distribution
Particle Size Distribution: Graphical Representation
 A histogram is one of the simplest ways to display a particle
size distribution.
 It is a particle frequency distribution that shows the percentage
of particles found in each size range.
 Frequency can be plotted on the Y-axis by number count,
surface area, or mass and particle diameter in μm can be plotted
on X-axis.
Particle Size Distribution
 The median particle size (mass median particle diameter) is
the particle diameter that divides the frequency distribution in half.
 The arithmetic mean diameter, usually simply termed the
mean diameter, is the arithmetic average particle diameter of the
distribution.
 The mode represents the value that occurs most frequently in a
distribution. In particle size distributions, the mode is the particle
diameter that occurs most frequently.
Particle Size Distribution
References
 Barry A. Wills, Tim Napier-Munn, “ Mineral Processing
Technology", ISBN: 0750644508, Elsevier Science &
Technology Books, Oct. 2006.
 Clive Washington, "Particle Size Analysis in
Pharmaceutics and Other Industries", ISBN 0-203-98417,
Ellis Horwood, 1992.
Thanks

Particle size distribution

  • 1.
  • 2.
    Particle Size Distribution Objective Understanding of Particle Size and Particle Shape  Particle Size Distribution (PSD)  Significance of Particle Size Distribution (PSD)  Particle Size Distribution: Sampling  Particle Size Distribution: Measurement Techniques  Particle Size Distribution: Graphical Representation
  • 3.
    Particle Size Distribution Understandingof Particle Size and Particle Shape Particle Size Particle size or grain size refers to the diameter of a grain of granular material
  • 4.
  • 5.
    Particle Size Distribution The size of a spherical homogeneous particle is uniquely defined by its diameter.  For regular, compact particles such as cubes or regular tetrahedra, a single dimension can be used to define size.  With some regular particles it may be necessary to specify more than one dimension: For a cone the base diameter and height are required whilst for a cuboid three dimensions are needed.
  • 6.
    Particle Size Distribution For irregular particles, it is desirable to quote the size of a particle in terms of a single quantity, and the expression most often used is the "equivalent diameter". This refers to the diameter of a sphere that would behave in the same manner as the particle when submitted to some specified operation.  The assigned equivalent diameter usually depends on the method of measurement, hence the particle-sizing technique should, wherever possible, duplicate the process one wishes to control.  Several equivalent diameters are commonly encountered. For example, the Stokes' diameter is measured by sedimentation and elutriation techniques; the projected area diameter is measured microscopically and the sieve- aperture diameter is measured by means of sieving.
  • 7.
  • 8.
    Particle Size Distribution Influencesof Particle Size  Particle size influences dissolution Small particles dissolve more rapidly than large ones, which is important not only in determining the behavior of the drug in vivo but also in various manufacturing processes.  Particle size influences flow properties of powders The flow properties of powders are strongly dependent on particle size and, in particular, particle shape. Since most powders are moved from one place to another by flowing, control of flow behavior is highly important. Generally, coarse, roughly spherical particles flow much more easily than small or elongated particles.  Particle size influences stability of dispersions The stability of dispersions, such as suspensions and emulsions, depends on the size of the dispersed material. The forces between colloidal particles depend on their dimensions, and the settling.
  • 9.
  • 10.
  • 11.
    Particle Size Distribution The length is the distance between two tangential planes which are perpendicular to those defining the thickness and breadth.  In practice it may be difficult to measure the particle thickness, particularly from microscopy, and so often we are limited to using simply the elongation ratio, as shown in Figure.
  • 12.
    Particle Size Distribution ShapeFactor  The ratio of two equivalent diameters obtained by different methods is termed a shape factor.  Shape factors describe the departure of the particle from a spherical form. One of the simplest is the sphericity, Ψ, defined by Wadell (1934) as:
  • 13.
  • 14.
    Particle Size Distribution Effectof Particle Shape  Particle shape influences such properties as: Flowability of powders Packing Interaction with fluids and the covering power of pigments  The variation between the diameters increases as the particles diverge more from the spherical shape.  Different results from different techniques can be compared by applying shape factors and shape coefficients.
  • 15.
    Particle Size Distribution SEMpicture of Polystyrene
  • 16.
    Particle Size Distribution ParticleSize Distribution  The particle size distribution (PSD) may be defined as “Particle size distribution (PSD) of a powder, or granular material, or particles dispersed in fluid, is a list of values or a mathematical function that defines the relative amounts of particles present, sorted according to size.”  Particle size distribution is also known as grain size distribution.
  • 17.
  • 18.
    Particle Size Distribution Significanceof Particle Size Distribution (PSD)  The PSD of a material can be important in understanding its physical and chemical properties.  It affects the strength and load-bearing properties of rocks and soils.  It affects the reactivity of solids participating in chemical reactions, and needs to be tightly controlled in many industrial products such as the manufacture of printer toner and cosmetics.
  • 19.
    Particle Size Distribution ParticleSize Distribution: Measurement Techniques  There is a wide range of instrumental and other methods of particle size analysis available. Some of the more common methods are: 1. Sieve Analysis 2. Sedimentation Methods 3. Elutriation Techniques 4. Microscopic Sizing and Image Analysis 5. Electrical Impedance Method 6. Laser Diffraction Methods
  • 20.
    Particle Size Distribution 1.Sieve Analysis  Sieve analysis is one of the oldest methods of size analysis.  Sieve analysis is accomplished by passing a known weight of sample material successively through finer sieves and weighing the amount collected on each sieve to determine the percentage weight in each size fraction.  Sieving is carried out with wet or dry materials and the sieves are usually agitated to expose all the particles to the openings.
  • 21.
    Particle Size Distribution Processof Sieving  The process of sieving may be divided into two stages.  First, the elimination of particles considerably smaller than the screen apertures, which should occur fairly rapidly and, second, the separation of the so-called "near-size" particles, which is a gradual process rarely reaching final completion.  The effectiveness of a sieving test depends on the amount of material put on the sieve (the "charge") and the type of movement imparted to the sieve.
  • 22.
    Particle Size Distribution TestSieves  Test sieves are designated by the nominal aperture size, which is the nominal central separation of opposite sides of a square aperture or the nominal diameter of a round aperture.
  • 23.
    Particle Size Distribution The woven sieve is the oldest design, and it is normally made by weaving fine metal wire into a square pattern, then soldering the edges securely into a flattish cylindrical Container.  Woven-wire sieves were originally designated by a mesh number, which referred to the number of wires per inch, which is the same as the number of square apertures per square inch.
  • 24.
    Particle Size Distribution Presentationof Results  There are several ways in which the results of a sieve test can be tabulated. The three most convenient methods are shown in table.
  • 25.
    Particle Size Distribution Tableshows: (1) The sieve size ranges used in the test. (2) The weight of material in each size range, e.g. 1.32 g of material passed through the 250 μm sieve, but was retained on the 180 μm sieve: the material therefore is in the size range -250 to +180 μm. (3) The weight of material in each size range expressed as a percentage of the total weight. (4) The nominal aperture sizes of the sieves used in the test. (5) The cumulative percentage of material passing through the sieves, e.g. 87.5% of the material is less than 125 μm in size. (6) The cumulative percentage of material retained on the sieves.
  • 26.
    Particle Size Distribution TechniqueAdvantages 1) This technique is well-adapted for bulk materials. 2) It is required to produce a separated size fraction for further study. 3) The material flows easily as discrete particles. 4) The material is fairly coarse, e.g. above 100 μm, and contains few fines. 5) The powder is composed of materials with a range of different densities, different refractive indices or is water- soluble.
  • 27.
    Particle Size Distribution TechniqueDisadvantages 1) Much fine material below 100 μm is present, unless specialized microsieving equipment is available. 2) The particles are fragile. 3) The particles are in the form of elongated needles. 4) The material adheres to the sieve or forms clumps. 5) The powder easily acquires an electrostatic charge.
  • 28.
    Particle Size Distribution 2.Sedimentation Methods  Sedimentation methods are based on the measurement of the rate of settling of the powder particles uniformly dispersed in a fluid and the principle is well illustrated by the common laboratory method of "beaker decantation".
  • 29.
    Particle Size Distribution The material under test is uniformly dispersed in low concentration in water contained in a beaker. A wetting agent may need to be added to ensure complete dispersion of the particles.  A syphon tube is immersed into the water to a depth of ‘h’ below the water level, corresponding to about 90% of the liquid depth ‘L’.  The terminal velocity ‘v’ is calculated from Stokes' law for the various sizes of particle in the material, say 35, 25, 15, and 10 μm.
  • 30.
    Particle Size Distribution The time required for a 10 μm particle to settle from the water level to the bottom of the syphon tube, distance ‘h’, is calculated (t = h/v).  The pulp is gently stirred to disperse the particles through the whole volume of water and then it is allowed to stand for the calculated time.  The water above the end of the tube is syphoned off and all particles in this water are assumed to be smaller than 10 μm diameter.
  • 31.
    Particle Size Distribution TechniqueAdvantages  The method is simple and cheap.  This methods has the advantage over many other sub-sieve techniques in that it produces a true fractional size analysis. Technique Disadvantages  This method is, however, extremely tedious, as long settling times are required for very fine particles, and separate tests must be performed for each particle size.
  • 32.
    Particle Size Distribution AndreasenPipette Technique  A much quicker and less-tedious method of sedimentation analysis is the Andreasen Pipette Technique.  The method is much quicker than beaker decantation, as samples are taken off successively throughout the test for increasingly finer particle sizes.
  • 33.
    Particle Size Distribution 3.Elutriation Techniques  Elutriation is a process of sizing particles by means of an upward current of fluid, usually water or air.  The process is the reverse of gravity sedimentation, and Stokes' law applies.  All elutriators consist of one or more "sorting columns“ in which the fluid is rising at a constant velocity.
  • 34.
    Particle Size Distribution Feed particles introduced into the sorting column will be separated into two fractions, according to their terminal velocities, calculated from Stokes' law.  Those particles having a terminal velocity less than that of the velocity of the fluid will report to the overflow, while those particles having a greater terminal velocity than the fluid velocity will sink to the underflow.  Elutriation is carried out until there are no visible signs of further classification taking place or the rate of change in weights of the products is negligible.
  • 35.
    Particle Size Distribution TechniqueAdvantages  Elutriation appears more attractive than decantation, and has certain practical advantages in that the volume changes need no operator attention. Technique Disadvantages  The fluid velocity is not constant across the sorting column, being a minimum at the walls of the column, and a maximum at the centre. The separation size is calculated from the mean volume flow, so that some coarse particles are misplaced in the overflow, and some fines are misplaced into the coarse overflow.
  • 36.
    Particle Size Distribution 4.Microscopic Sizing and Image Analysis  Microscopy can be used as an absolute method of particle size analysis since it is the only method in which individual mineral particles are observed and measured.  The image of a particle seen in a microscope is two dimensional and from this image an estimate of particle size must be made.  Microscopic sizing involves comparing the projected area of a particle with the areas of reference circles, or graticules, of known sizes.
  • 37.
    Particle Size Distribution The optical microscope method is applicable to particles in the size range 0.8-150 μm, and down to 0.001 μm using electron microscopy.  Manual analysis of microscope slides is tedious and error prone; semi-automatic and automatic systems have been developed which speed up analyses and reduce the tedium of manual methods.  The development of quantitative image analysis has made possible the rapid sizing of fine particles using small laboratory samples.
  • 38.
    Particle Size Distribution 5.Electrical Impedance Method  The Beckman Coulter Counter makes use of current changes in an electrical circuit reduced by the presence of a particle.  The instrument is applicable in the range 0.4-1200 μm.
  • 39.
    Particle Size Distribution 5.Laser Diffraction Methods  Laser light is passed through a dilute suspension of the particles which circulate through an optical cell. The light is scattered by the particles, and is detected by a solid state detector which measures light intensity over a range of angles.  A theory of light scattering is used to calculate the particle size distribution from the light distribution pattern, finer particles inducing more scatter than coarse.
  • 40.
    Particle Size Distribution ParticleSize Distribution: Graphical Representation  A histogram is one of the simplest ways to display a particle size distribution.  It is a particle frequency distribution that shows the percentage of particles found in each size range.  Frequency can be plotted on the Y-axis by number count, surface area, or mass and particle diameter in μm can be plotted on X-axis.
  • 41.
    Particle Size Distribution The median particle size (mass median particle diameter) is the particle diameter that divides the frequency distribution in half.  The arithmetic mean diameter, usually simply termed the mean diameter, is the arithmetic average particle diameter of the distribution.  The mode represents the value that occurs most frequently in a distribution. In particle size distributions, the mode is the particle diameter that occurs most frequently.
  • 42.
    Particle Size Distribution References Barry A. Wills, Tim Napier-Munn, “ Mineral Processing Technology", ISBN: 0750644508, Elsevier Science & Technology Books, Oct. 2006.  Clive Washington, "Particle Size Analysis in Pharmaceutics and Other Industries", ISBN 0-203-98417, Ellis Horwood, 1992.
  • 43.