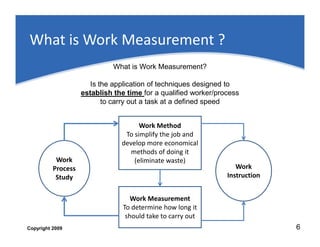
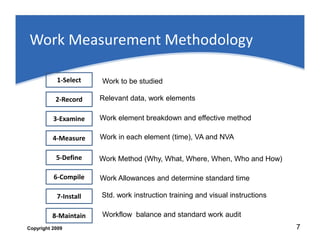
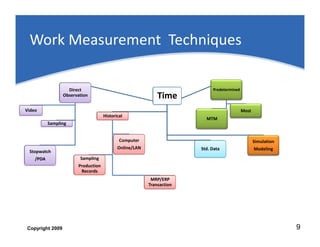
Work Measurement and Lean 
Applications in the Process Industries 
Reduce Cost and Improve Flow 
Copyright 2009 
Luis Armendariz, P.E.,MBA,Six Sigma Engineer 
Lean Physics and Operations Modeling Consultant
Agenda 
• Contributors & Origins of Work Measurement 
• Global Economy and Work Measurement 
• What’s Work ? Lean Principles 
• Work Measurement Tools 
• Work Measurement Case Studies/AApppplliiccaattiioonnss 
Traditional and Non-Traditional 
• Improvement Challenges & Survey Results 
Copyright 2009 2
Contributors and Origins of Work 
Measurement 
The Mayas in Mesoamerican 
Civilization 
ProtimeSystems.com 
Issac Newton 
1643-1727 
W= F d 
F = m a 
Long Time Count 
Estimated Current and Historical Dates 
2600 B.C. 
Lilian and Frank Gilbreth 1931 
Lilian 1878-1972 
Fredreric Taylor 
1856-1915 
Henry Ford 
1863-1947 
Greece and Egypt 
Hour Glass 
Predetermine Time System (PTS) 
1910 
Computer Video-Based Work 
USA-Sweden-Germany 
1940 
PTS…. And Others 
Workfactor, MOST, Modaps 
Measurement 
and 
Video & Pictorial Instruction Systems 
1996 
Taiichi Ohno 
1912-1990 
Copyright 2009 3
Current Economic Issues and WM 
GDP Global Level 
Country Level 
Product demand unstable (high variability) creating waste of resources 
•State of CA job growth fell 5.0% in July 2009 from a year ago; national job growth fell 4.2%. 
•State CA unemployment averaged 11.9% in July 2009; the national average was 9.4% 
•Personal income fell 0.2% to $1.5 trillion in Q1 2009 from a year ago. 
•Tax revenue fell 16.2% in Q1 2009 from the previous year. 
•Exports fell 22.4% to $48.8 billion in the first five months of 2009 from a year ago. 
•Venture capital investment in CA fell 63% to $1.4 billion in Q1 2009 from a year ago. 
State Level 
Copyright 2009 4
What is Work & Lean Principles 
What is Work ? 
Any activity that consumes resources and creates 
value or non-value added for the customer 
Work Measurement 
MPI 
Copyright 2009 5
What is Work Measurement ? 
What is Work Measurement? 
Is the application of techniques designed to 
establish the time for a qualified worker/process 
to carry out a task at a defined speed 
Work Method 
Work 
Process 
Study 
To simplify the job and 
develop more economical 
methods of doing it 
(eliminate waste) 
Work Measurement 
To determine how long it 
should take to carry out 
Work 
Instruction 
Copyright 2009 6
Work Measurement Methodology 
1-Select 
2-Record 
3-Examine 
Work to be studied 
Relevant data, work elements 
Work element breakdown and effective method 
4-Measure 
5-Define 
7-Install 
8-Maintain 
Work in each element (time), VA and NVA 
Work Method (Why, What, Where, When, Who and How) 
6-Compile Work Allowances and determine standard time 
Std. work instruction training and visual instructions 
Workflow balance and standard work audit 
Copyright 2009 7
Work Measurement Applications 
• Value Stream/Process Flow Mapping 
• Capacity and Lead Time Analysis 
• Production Plan/Production Standards 
• Scheduling 
• Labor/Staffing Analysis/Labor Standards 
• Production Incentives 
• Machine Efficiencies (OEE) 
The Work Flows of : 
• Material 
• People 
• Machine 
• Costing 
• Product Design 
• Layout Planning 
• Ergonomics 
• Inventory Planning/ERP 
• Information Systems 
• Simulation Modeling 
• Flow Manufacturing & Service 
• Learning Curves and Training 
• Productivity/Efficiency & Effectiveness 
TIME 
• Information 
• Service 
• Layout 
• Cash 
• Environment 
Copyright 2009 8
Work Measurement Techniques 
Time 
Direct 
Observation 
Video 
SSaammpplliinngg 
Historical 
Predetermined 
MTM 
Most 
Stopwatch 
/PDA 
Sampling 
Sampling 
Production 
Records 
Computer 
Online/LAN 
MRP/ERP 
Transaction 
Std. Data 
Simulation 
Modeling 
Copyright 2009 9
Work Measurement Approach 
Engineer Based Standards Team Video Based Standards 
1. Engineer Conducts Work 
Measurement 
1. Engineer /Supv. Facilitates Study 
2. Cross Functional Team Conducts Work 
2. Engineer Compiles Standard 
3. Engineer Develops Std Work 
Instruction 
4. Management Enforces Standard 
5. Operators Follow Instructions 
Measurement (Including Operators) 
3. Team Develops Std Work Instruction 
(Including Operators) 
4. Management provides training, removes 
barriers and motivate operators 
5. Operators are accountable to sustain 
6. Operators are motivated to improve 
standards 
7. Engineer/Mgt. installs the control systems 
and operating mechanisms 
Copyright 2009 10
Work Measurement (7 Workflows) 
1-Does the Material flow ? 
Move from one value adding processing step right to the next value adding step 
2-Do the Operators flow ? 
Is the operator’s work repeatable and consistent within each cycle ? 
Can the operator perform efficiently from one value adding work element to the next ? 
3-Do Machines/Equipment/Tools flow ? Are the machines or equipment adding value 
to the product/service ? 
4-Does Information flow ? 
Is there a plan and schedule that maximizes flow 
Does everyone know the hourly production target ? 
How quickly are problems and abnormalities noticed? 
What happens when there are problems and abnormalities ? 
5-Does the Service or Mgt Business Support Function flow ? 
Are the service functions in the company flowing efficiently and supporting mfg. flow 
6-Does the Layout (facility) flow ? 
Are the material, operators, equipment and information flowing efficiently 
7-Does the Cash flow ? 
Copyright 2009 What is the material idle time (cash in-idle), WIP, TH, CT and inventory turn over 11
Beyond 5S/Ergonomics-Human Factors 
Arrangement and 
Storage of Tools 
Lighting 
Color 
Noise & Vibration 
PFD Allowances 
Personal 
Fatigue 
Climate & Ventilation 
Toxic Substances 
PPE 
Work Time and Rests 
Facilities 
Delays 
Copyright 2009 12
The 5 Work Symbols and 7 Waste 
7 Waste 
Motion 
What is Work ? 
Any activity that consumes resources and creates 
value or non-value added for the customer 
V 
A 
5 Work Symbols 
Operation 
Overproduction 
Waiting 
Transportation 
Inventory 
Unnecessary Processing 
Defects 
“8” Tap into human potential and creativity 
N 
V 
A 
Storage 
Delay 
Transport 
Inspection 
Copyright 2009 13
Process Flow and The 5 Work Symbols 
Process Flow Analysis 
Process Description: XXXXXX 
Date: XX-XX-XX Material People Machine Information 
No. Task Description 
Cum. Time (min) 
Interval Time (min) 
Distance (Ft) 
Operation 
Transport 
Storage 
Delay 
Inspection 
1 Get tube and place to bender 5 5 6 5 
2 Get bent tube & place to assy 10 5 1 5 
3 Get connector 15 5 5 5 
4 Get hose & place 20 4 3 4 
5 Start assembly cycle 24 5 0 5 
6 Walk and bring finished piece 29 7 6 7 
7 Attach to convolute 36 4 0 4 
8 Start assembly cycle 40 6 0 6 
9 Place to tester fixture 46 6 3 6 
10 inspect part 52 5 0 5 
11 Attach to Coiler 57 5 0 5 
Total 57 24 20 32 0 0 5 
Steps Count 12 5 6 1 
Work Flow Cycle Efficiency 35% 
Total 
Steps Count 
Work Flow Cycle Efficiency 
This tool is used to measure service or manufacturing processes, collecting 
information using sticky notes to build the VSM 
Proposed Current 
Copyright 2009 14
Work Measurement (Material) 
at VSM Level 
A B C 
2d 4d 1d 
1d 
Supplier 
Customer 
Min 
TAKT 
CT= 400 m 
C/O= 160 m 
TBF = 4 D 
TTR = 2 H 
Yield = 92% 
HCT = 8 FT 
EPEI = 4 
VA = 300 m VA = 200 m VA = 300 m 
Work Cycle Efficiency = 
A B C 
(WCE) 
VA/(VA+NVA) 
= 300+200+300 
(800+12000) 
WCE= 6.3% 
CT= 213 H 
WIP = 20 
TH = 4 
Copyright 2009 15
Work Measurement (Labor Unrestricted) 
Assy1 
Current State 
Constant Work Elements Time 
1- Pick up part 3 
2- Move to table 2 
3 3- Assemble housing 10 
4 
2 
4- Inspect assembly 7 
5- Move part to bin 2 
Assy1 1 5 
S/E- Starts and End in container 
CT= 30 S 
C/O= 0 m 
TBF = 0 D 
TTR = 0 H 
Yield = 92% 
HCT = 1 FT 
VA = 10 S 
Variable Work Elements Time 
- Re-fill container f=100 60 
Indicators 
WCE= 33% 
CT= 30 S 
TH = 120/hr 
WIP=110 
S E 
Observed Time = Constant + Variable Work Elements 
Observed Time = (3 + 2+10+7+2 ) + (60/100) 
Observed Time = 24+ 0.6 = 24.6 Sec 
Normal Time = Total Observed Time x Efficiency 
Normal Time = 24.6 x 1.05 = 25.83 Sec 
Standard Time = Total Normal Time x PFD 
Standard Time = 25.83 x 1.15 = 29.7 Sec, ~30 S 
Copyright 2009 16
Work Measurement (Labor Unrestricted) 
Assy1 
Constant Work Elements Time 
1- Pick up part 2 
2- Move to table 1 
3- Assemble & test housing 12 
4- Inspect assembly 7 
5- Move part to bin 2 
S/E- Starts and End in container 
1 
2 3 
Assy1 
Future State 
CT= 17.3 S 
C/O= 0 m 
TBF = 0 D 
TTR = 0 H 
Yield = 92% 
HCT = 1 FT 
VA = 12 S 
Variable Work Elements Time 
- Re-fill container f=100 60 
Indicators 
Current (Future) 
Observed Time = Constant + Variable Work Elements 
Observed Time = (2+ 1+12 ) + 0 
Observed Time = 15 Sec 
WCE= 33% (70%) 
CT= 30 S (17 S) 
TH = 120/hr (208/hr) 
WIP=110 (3) 
Normal Time = Total Observed Time x Eff. Rating 
Normal Time = 15 x 1.05 = 15.75 Sec 
Standard Time = Total Normal Time x PFD 
Standard Time = 15.75 x 1.10 = 17.3 Sec 
Copyright 2009 17
Work Measurement (Labor Restricted) 
Operator and Machine 
A 
Restricted Work 
Is work in which the output is limited by factors 
outside the control of the worker 
Operator Working Operator Idle 
Current 
1.2 min 
2.0 min 
CT= 1.36 m 
C/O= 1 m 
TBF = 4 D 
TTR = 2 H 
Yield = 92% 
HCT = 8 FT 
VA = 0.8 m 
Machine Idle Machine Working 
Future 
0.8 min 
1.12 min 
Operator Working Operator Idle 
Machine Idle Machine Working 
0.8 min 
1.36 min 
Copyright 2009 18
Work Measurement (Labor Restricted) 
Operator and Machine «Pump Diagram» 
1.36 min 
A Machine Process Time 0.8 min 
Operator Time 
CT= 1.36 m 
C/O= 1 m 
TBF = 4 D 
TTR = 2 H 
Yield = 92% 
HCT = 8 FT 
VA = 0.8 m 
Internal Time 0.56 min External 0.56 min Idle 0.24 min 
Status 
• Idle Time 
•Working Time 
• Total Cycle 
• Utilization 
Operator 
• 0.24 min 
• 1.12 min 
• 1.36 min 
• 82% (1.12/1.36) 
Machine 
• 0.56 min 
• 0.80 min 
• 1.36 min 
• 59% (0.8/1.36) 
Summary 
Copyright 2009 19
Work Measurement (Setup Time) 
Operators and Machine « Pump Diagram » 
Observed 
CT = 648 Min 
Setup Run Time 
Prep (11min) External 
Extract(70min) 
Internal-Reduce 
Rinse I (50min) 
Rinse II (60min) 
Int-Reduce 
Int-Reduce 
MC Breakdown (200 min) 
Remove Gasket (80min) 
Clean Gasket (30 min) 
Eliminate 
Install Gasket (145 min) 
Int-Reduce 
Int-Reduce 
Int-Combine 
Copyright 2009 20
Work Measurement (Setup Time) 
Operators and Machine « Pump Diagram » 
Capacity Gain = 416 min 
Observed = 648 min Reduced = 232 min 
External 
Reduce 
Reduce 
Reduce 
Reduce 
Reduce 
Combine 
Eliminate 
Copyright 2009 21
Work Measurement (Single Machine ) 
« OEE » 
OEE = Availability x Performance x Quality 
Availability (Downtime Loss) = Operating Time / Planned Production Time 
Performance (Speed Loss) = Ideal Cycle Time / (Operating Time / Total Pieces) 
Quality (Quality Loss) = Good Pieces / Total Pieces 
OEE Factor Shift 1 Shift 2 
Availability 90% 95% 
Performance 95% 95% 
Quality 99.5% 96% 
OEE 85.1% 86.6% 
Note: Availability (TBF and TTR) 
Copyright 2009 22
Work Measurement (Multiple Machine) 
« Waterfall Diagram » 
A 
Multiple Machine and Operator Work 
Is work which requires the worker/team to attend two 
or more machines/equipment 
Machine 
A 
CTq1 
CT= 1.36 m 
C/O= 1 m 
TBF = 4 D 
TTR = 2 H 
Yield = 92% 
HCT = 8 FT 
VA = 0.8 m 
B 
C 
CTq2 
CT= SetupTime + Process Run Time + Ctq 
Copyright 2009 23
Work Measurement (People Flow) 
« Spaghetti Diagram » 
Process Layout: 6 People -Crew 
3 Op to unload 
printing frames 
30 ft 
and remove gaskets 
3 Op to change inks 
and spray pins 
50 ft 
Copyright 2009 24
Work Measurement (People Flow) 
Outgoing 
10 
3 
Process 
Sequence 
Work 
Sequence 
Operator A 
1 
2 
Incoming 
1 9 
2 
3 
4 
Operator B 
Operator C 
5 
8 
7 
6 
1 
2 
1 
4 
3 
3 
2 
Copyright 2009 25
Work Measurement 
(Material-Facility Flow) 
Copyright 2009 26
Work Measurement 
(Material-Facility Flow) 
Copyright 2009 27
Work Measurement PTS 
Predetermined Time Standards 
PTS 
Are pre-established times for basic human motions 
and are used to build up the time for a job at a 
defined level of performance 
Base assembly workplace layout 
Studs 
18” 
12” 
8” 8” 8” 
12” 
Copyright 2009 28
Work Measurement 
Work Sampling 
WS 
Is a method of finding the % of occurrence of a certain 
activity by statistical sampling and random observations 
Sample Size 
pq 
n 
¶p = 
Observations 
Machine Working 
Machine Idle 
Preliminary Study 
100 observations 
P = 25 % machine idle 
q = 75% working 
95% conf level 10% error 
1.96´¶p =10 
5 = ´ 
25 75 
n 
n = 75 observations 
Waiting for Repairs Waiting for Supplies 
Personal needs of 
workers 
Idle 
Numb er of Observations: 75 Total % 
Machine Running 
11111 11111 11111 11111 11111 11111 11111 11111 11111 
11111 11111 11111 11 62 82.7% 
Machine Idle Repairs 11 2 2.7% 
Supplies 111111 6 8.0% 
Personal 1 1 1.3% 
Idle 1111 4 5.3% 
100% 
Copyright 2009 29
Work Measurement 
Service /Business Function 
Time To Fill Vacancies 
(Intellectual Capital Losses) 
Lost Hours of Productive Hourly Employees 
Lost Hours of Productive Salary Employees 
Lost Hours of Productive Executive Employees 
A 
CT= 1.36 m 
C/O= 1 m 
TBF = 4 D 
TTR = 2 H 
Yield = 92% 
HCT = 8 FT 
VA = 0.8 m 
Time To Train New Employees 
Time To Process Purchase Orders 
Time To Generate Financial Reports 
Time and Resources To Service Machinery and Equipment 
Time and Resources To Execute a Project 
Copyright 2009 30
Distributing the Work Load 
Line Balancing 
a. Reduce NVA time to improve wwoorrkk bbaallaannccee 
bb.. RReedduuccee pprroodduucctt ccoosstt bbyy rreemmoovviinngg wwoorrkk ttiimmee ffrroomm pprroodduucctt 
cc.. CCyyccllee TTiimmee aanndd WWIIPP wwiillll bbee rreedduucceedd 
dd.. PPrroodduuccttiivviittyy wwiillll iinnccrreeaassee dduuee ttoo mmoorree ttiimmee ffoorr VVAA ttaasskkss 
16 
14 
12 
10 
8 
6 
4 
2 
0 
Step 1 Step 2 Step 3 Step 4 Step 5 
TTaakktt 
TTiimmee 
Set-up 
NVAT 
VAT 
min 
Copyright 2009 31
Work Measurement (Information Flow) 
Does everyone know the target and the method ? 
Video Instruction 
Information Board 
CT 
WIP 
TH 
Text Instruction 
Align plate on table 
Copyright 2009 32
Achieving Standard Work 
Routine for work to be performed right the first time, every time 
Elements of Standard Work 
1- Takt (Demand Rate) 
Min 
A B C 
TAKT 
2- Standard WIP 
3-Work sequence (Work Instruction, 
Documentation & Training) 
WIP = CT x TH 
Copyright 2009 33
Sustaining and Improving 
Standardization Drives Sustainable Results 
K 
S 
TIME 
IMPROVEMENT 
K 
K 
K 
K 
K 
K 
K 
K 
S 
S 
S 
K-S-Kaizen 
event 
Sustained 
performance 
Copyright 2009 34
Q&A 
Cannot manage if you don’t measure ! 
Contact IIE Membership 
Luis Armendariz, P.E. 
Copyright 2009 35

Work measurement

  • 1.
    Work Measurement andLean Applications in the Process Industries Reduce Cost and Improve Flow Copyright 2009 Luis Armendariz, P.E.,MBA,Six Sigma Engineer Lean Physics and Operations Modeling Consultant
  • 2.
    Agenda • Contributors& Origins of Work Measurement • Global Economy and Work Measurement • What’s Work ? Lean Principles • Work Measurement Tools • Work Measurement Case Studies/AApppplliiccaattiioonnss Traditional and Non-Traditional • Improvement Challenges & Survey Results Copyright 2009 2
  • 3.
    Contributors and Originsof Work Measurement The Mayas in Mesoamerican Civilization ProtimeSystems.com Issac Newton 1643-1727 W= F d F = m a Long Time Count Estimated Current and Historical Dates 2600 B.C. Lilian and Frank Gilbreth 1931 Lilian 1878-1972 Fredreric Taylor 1856-1915 Henry Ford 1863-1947 Greece and Egypt Hour Glass Predetermine Time System (PTS) 1910 Computer Video-Based Work USA-Sweden-Germany 1940 PTS…. And Others Workfactor, MOST, Modaps Measurement and Video & Pictorial Instruction Systems 1996 Taiichi Ohno 1912-1990 Copyright 2009 3
  • 4.
    Current Economic Issuesand WM GDP Global Level Country Level Product demand unstable (high variability) creating waste of resources •State of CA job growth fell 5.0% in July 2009 from a year ago; national job growth fell 4.2%. •State CA unemployment averaged 11.9% in July 2009; the national average was 9.4% •Personal income fell 0.2% to $1.5 trillion in Q1 2009 from a year ago. •Tax revenue fell 16.2% in Q1 2009 from the previous year. •Exports fell 22.4% to $48.8 billion in the first five months of 2009 from a year ago. •Venture capital investment in CA fell 63% to $1.4 billion in Q1 2009 from a year ago. State Level Copyright 2009 4
  • 5.
    What is Work& Lean Principles What is Work ? Any activity that consumes resources and creates value or non-value added for the customer Work Measurement MPI Copyright 2009 5
  • 6.
    What is WorkMeasurement ? What is Work Measurement? Is the application of techniques designed to establish the time for a qualified worker/process to carry out a task at a defined speed Work Method Work Process Study To simplify the job and develop more economical methods of doing it (eliminate waste) Work Measurement To determine how long it should take to carry out Work Instruction Copyright 2009 6
  • 7.
    Work Measurement Methodology 1-Select 2-Record 3-Examine Work to be studied Relevant data, work elements Work element breakdown and effective method 4-Measure 5-Define 7-Install 8-Maintain Work in each element (time), VA and NVA Work Method (Why, What, Where, When, Who and How) 6-Compile Work Allowances and determine standard time Std. work instruction training and visual instructions Workflow balance and standard work audit Copyright 2009 7
  • 8.
    Work Measurement Applications • Value Stream/Process Flow Mapping • Capacity and Lead Time Analysis • Production Plan/Production Standards • Scheduling • Labor/Staffing Analysis/Labor Standards • Production Incentives • Machine Efficiencies (OEE) The Work Flows of : • Material • People • Machine • Costing • Product Design • Layout Planning • Ergonomics • Inventory Planning/ERP • Information Systems • Simulation Modeling • Flow Manufacturing & Service • Learning Curves and Training • Productivity/Efficiency & Effectiveness TIME • Information • Service • Layout • Cash • Environment Copyright 2009 8
  • 9.
    Work Measurement Techniques Time Direct Observation Video SSaammpplliinngg Historical Predetermined MTM Most Stopwatch /PDA Sampling Sampling Production Records Computer Online/LAN MRP/ERP Transaction Std. Data Simulation Modeling Copyright 2009 9
  • 10.
    Work Measurement Approach Engineer Based Standards Team Video Based Standards 1. Engineer Conducts Work Measurement 1. Engineer /Supv. Facilitates Study 2. Cross Functional Team Conducts Work 2. Engineer Compiles Standard 3. Engineer Develops Std Work Instruction 4. Management Enforces Standard 5. Operators Follow Instructions Measurement (Including Operators) 3. Team Develops Std Work Instruction (Including Operators) 4. Management provides training, removes barriers and motivate operators 5. Operators are accountable to sustain 6. Operators are motivated to improve standards 7. Engineer/Mgt. installs the control systems and operating mechanisms Copyright 2009 10
  • 11.
    Work Measurement (7Workflows) 1-Does the Material flow ? Move from one value adding processing step right to the next value adding step 2-Do the Operators flow ? Is the operator’s work repeatable and consistent within each cycle ? Can the operator perform efficiently from one value adding work element to the next ? 3-Do Machines/Equipment/Tools flow ? Are the machines or equipment adding value to the product/service ? 4-Does Information flow ? Is there a plan and schedule that maximizes flow Does everyone know the hourly production target ? How quickly are problems and abnormalities noticed? What happens when there are problems and abnormalities ? 5-Does the Service or Mgt Business Support Function flow ? Are the service functions in the company flowing efficiently and supporting mfg. flow 6-Does the Layout (facility) flow ? Are the material, operators, equipment and information flowing efficiently 7-Does the Cash flow ? Copyright 2009 What is the material idle time (cash in-idle), WIP, TH, CT and inventory turn over 11
  • 12.
    Beyond 5S/Ergonomics-Human Factors Arrangement and Storage of Tools Lighting Color Noise & Vibration PFD Allowances Personal Fatigue Climate & Ventilation Toxic Substances PPE Work Time and Rests Facilities Delays Copyright 2009 12
  • 13.
    The 5 WorkSymbols and 7 Waste 7 Waste Motion What is Work ? Any activity that consumes resources and creates value or non-value added for the customer V A 5 Work Symbols Operation Overproduction Waiting Transportation Inventory Unnecessary Processing Defects “8” Tap into human potential and creativity N V A Storage Delay Transport Inspection Copyright 2009 13
  • 14.
    Process Flow andThe 5 Work Symbols Process Flow Analysis Process Description: XXXXXX Date: XX-XX-XX Material People Machine Information No. Task Description Cum. Time (min) Interval Time (min) Distance (Ft) Operation Transport Storage Delay Inspection 1 Get tube and place to bender 5 5 6 5 2 Get bent tube & place to assy 10 5 1 5 3 Get connector 15 5 5 5 4 Get hose & place 20 4 3 4 5 Start assembly cycle 24 5 0 5 6 Walk and bring finished piece 29 7 6 7 7 Attach to convolute 36 4 0 4 8 Start assembly cycle 40 6 0 6 9 Place to tester fixture 46 6 3 6 10 inspect part 52 5 0 5 11 Attach to Coiler 57 5 0 5 Total 57 24 20 32 0 0 5 Steps Count 12 5 6 1 Work Flow Cycle Efficiency 35% Total Steps Count Work Flow Cycle Efficiency This tool is used to measure service or manufacturing processes, collecting information using sticky notes to build the VSM Proposed Current Copyright 2009 14
  • 15.
    Work Measurement (Material) at VSM Level A B C 2d 4d 1d 1d Supplier Customer Min TAKT CT= 400 m C/O= 160 m TBF = 4 D TTR = 2 H Yield = 92% HCT = 8 FT EPEI = 4 VA = 300 m VA = 200 m VA = 300 m Work Cycle Efficiency = A B C (WCE) VA/(VA+NVA) = 300+200+300 (800+12000) WCE= 6.3% CT= 213 H WIP = 20 TH = 4 Copyright 2009 15
  • 16.
    Work Measurement (LaborUnrestricted) Assy1 Current State Constant Work Elements Time 1- Pick up part 3 2- Move to table 2 3 3- Assemble housing 10 4 2 4- Inspect assembly 7 5- Move part to bin 2 Assy1 1 5 S/E- Starts and End in container CT= 30 S C/O= 0 m TBF = 0 D TTR = 0 H Yield = 92% HCT = 1 FT VA = 10 S Variable Work Elements Time - Re-fill container f=100 60 Indicators WCE= 33% CT= 30 S TH = 120/hr WIP=110 S E Observed Time = Constant + Variable Work Elements Observed Time = (3 + 2+10+7+2 ) + (60/100) Observed Time = 24+ 0.6 = 24.6 Sec Normal Time = Total Observed Time x Efficiency Normal Time = 24.6 x 1.05 = 25.83 Sec Standard Time = Total Normal Time x PFD Standard Time = 25.83 x 1.15 = 29.7 Sec, ~30 S Copyright 2009 16
  • 17.
    Work Measurement (LaborUnrestricted) Assy1 Constant Work Elements Time 1- Pick up part 2 2- Move to table 1 3- Assemble & test housing 12 4- Inspect assembly 7 5- Move part to bin 2 S/E- Starts and End in container 1 2 3 Assy1 Future State CT= 17.3 S C/O= 0 m TBF = 0 D TTR = 0 H Yield = 92% HCT = 1 FT VA = 12 S Variable Work Elements Time - Re-fill container f=100 60 Indicators Current (Future) Observed Time = Constant + Variable Work Elements Observed Time = (2+ 1+12 ) + 0 Observed Time = 15 Sec WCE= 33% (70%) CT= 30 S (17 S) TH = 120/hr (208/hr) WIP=110 (3) Normal Time = Total Observed Time x Eff. Rating Normal Time = 15 x 1.05 = 15.75 Sec Standard Time = Total Normal Time x PFD Standard Time = 15.75 x 1.10 = 17.3 Sec Copyright 2009 17
  • 18.
    Work Measurement (LaborRestricted) Operator and Machine A Restricted Work Is work in which the output is limited by factors outside the control of the worker Operator Working Operator Idle Current 1.2 min 2.0 min CT= 1.36 m C/O= 1 m TBF = 4 D TTR = 2 H Yield = 92% HCT = 8 FT VA = 0.8 m Machine Idle Machine Working Future 0.8 min 1.12 min Operator Working Operator Idle Machine Idle Machine Working 0.8 min 1.36 min Copyright 2009 18
  • 19.
    Work Measurement (LaborRestricted) Operator and Machine «Pump Diagram» 1.36 min A Machine Process Time 0.8 min Operator Time CT= 1.36 m C/O= 1 m TBF = 4 D TTR = 2 H Yield = 92% HCT = 8 FT VA = 0.8 m Internal Time 0.56 min External 0.56 min Idle 0.24 min Status • Idle Time •Working Time • Total Cycle • Utilization Operator • 0.24 min • 1.12 min • 1.36 min • 82% (1.12/1.36) Machine • 0.56 min • 0.80 min • 1.36 min • 59% (0.8/1.36) Summary Copyright 2009 19
  • 20.
    Work Measurement (SetupTime) Operators and Machine « Pump Diagram » Observed CT = 648 Min Setup Run Time Prep (11min) External Extract(70min) Internal-Reduce Rinse I (50min) Rinse II (60min) Int-Reduce Int-Reduce MC Breakdown (200 min) Remove Gasket (80min) Clean Gasket (30 min) Eliminate Install Gasket (145 min) Int-Reduce Int-Reduce Int-Combine Copyright 2009 20
  • 21.
    Work Measurement (SetupTime) Operators and Machine « Pump Diagram » Capacity Gain = 416 min Observed = 648 min Reduced = 232 min External Reduce Reduce Reduce Reduce Reduce Combine Eliminate Copyright 2009 21
  • 22.
    Work Measurement (SingleMachine ) « OEE » OEE = Availability x Performance x Quality Availability (Downtime Loss) = Operating Time / Planned Production Time Performance (Speed Loss) = Ideal Cycle Time / (Operating Time / Total Pieces) Quality (Quality Loss) = Good Pieces / Total Pieces OEE Factor Shift 1 Shift 2 Availability 90% 95% Performance 95% 95% Quality 99.5% 96% OEE 85.1% 86.6% Note: Availability (TBF and TTR) Copyright 2009 22
  • 23.
    Work Measurement (MultipleMachine) « Waterfall Diagram » A Multiple Machine and Operator Work Is work which requires the worker/team to attend two or more machines/equipment Machine A CTq1 CT= 1.36 m C/O= 1 m TBF = 4 D TTR = 2 H Yield = 92% HCT = 8 FT VA = 0.8 m B C CTq2 CT= SetupTime + Process Run Time + Ctq Copyright 2009 23
  • 24.
    Work Measurement (PeopleFlow) « Spaghetti Diagram » Process Layout: 6 People -Crew 3 Op to unload printing frames 30 ft and remove gaskets 3 Op to change inks and spray pins 50 ft Copyright 2009 24
  • 25.
    Work Measurement (PeopleFlow) Outgoing 10 3 Process Sequence Work Sequence Operator A 1 2 Incoming 1 9 2 3 4 Operator B Operator C 5 8 7 6 1 2 1 4 3 3 2 Copyright 2009 25
  • 26.
    Work Measurement (Material-FacilityFlow) Copyright 2009 26
  • 27.
    Work Measurement (Material-FacilityFlow) Copyright 2009 27
  • 28.
    Work Measurement PTS Predetermined Time Standards PTS Are pre-established times for basic human motions and are used to build up the time for a job at a defined level of performance Base assembly workplace layout Studs 18” 12” 8” 8” 8” 12” Copyright 2009 28
  • 29.
    Work Measurement WorkSampling WS Is a method of finding the % of occurrence of a certain activity by statistical sampling and random observations Sample Size pq n ¶p = Observations Machine Working Machine Idle Preliminary Study 100 observations P = 25 % machine idle q = 75% working 95% conf level 10% error 1.96´¶p =10 5 = ´ 25 75 n n = 75 observations Waiting for Repairs Waiting for Supplies Personal needs of workers Idle Numb er of Observations: 75 Total % Machine Running 11111 11111 11111 11111 11111 11111 11111 11111 11111 11111 11111 11111 11 62 82.7% Machine Idle Repairs 11 2 2.7% Supplies 111111 6 8.0% Personal 1 1 1.3% Idle 1111 4 5.3% 100% Copyright 2009 29
  • 30.
    Work Measurement Service/Business Function Time To Fill Vacancies (Intellectual Capital Losses) Lost Hours of Productive Hourly Employees Lost Hours of Productive Salary Employees Lost Hours of Productive Executive Employees A CT= 1.36 m C/O= 1 m TBF = 4 D TTR = 2 H Yield = 92% HCT = 8 FT VA = 0.8 m Time To Train New Employees Time To Process Purchase Orders Time To Generate Financial Reports Time and Resources To Service Machinery and Equipment Time and Resources To Execute a Project Copyright 2009 30
  • 31.
    Distributing the WorkLoad Line Balancing a. Reduce NVA time to improve wwoorrkk bbaallaannccee bb.. RReedduuccee pprroodduucctt ccoosstt bbyy rreemmoovviinngg wwoorrkk ttiimmee ffrroomm pprroodduucctt cc.. CCyyccllee TTiimmee aanndd WWIIPP wwiillll bbee rreedduucceedd dd.. PPrroodduuccttiivviittyy wwiillll iinnccrreeaassee dduuee ttoo mmoorree ttiimmee ffoorr VVAA ttaasskkss 16 14 12 10 8 6 4 2 0 Step 1 Step 2 Step 3 Step 4 Step 5 TTaakktt TTiimmee Set-up NVAT VAT min Copyright 2009 31
  • 32.
    Work Measurement (InformationFlow) Does everyone know the target and the method ? Video Instruction Information Board CT WIP TH Text Instruction Align plate on table Copyright 2009 32
  • 33.
    Achieving Standard Work Routine for work to be performed right the first time, every time Elements of Standard Work 1- Takt (Demand Rate) Min A B C TAKT 2- Standard WIP 3-Work sequence (Work Instruction, Documentation & Training) WIP = CT x TH Copyright 2009 33
  • 34.
    Sustaining and Improving Standardization Drives Sustainable Results K S TIME IMPROVEMENT K K K K K K K K S S S K-S-Kaizen event Sustained performance Copyright 2009 34
  • 35.
    Q&A Cannot manageif you don’t measure ! Contact IIE Membership Luis Armendariz, P.E. Copyright 2009 35