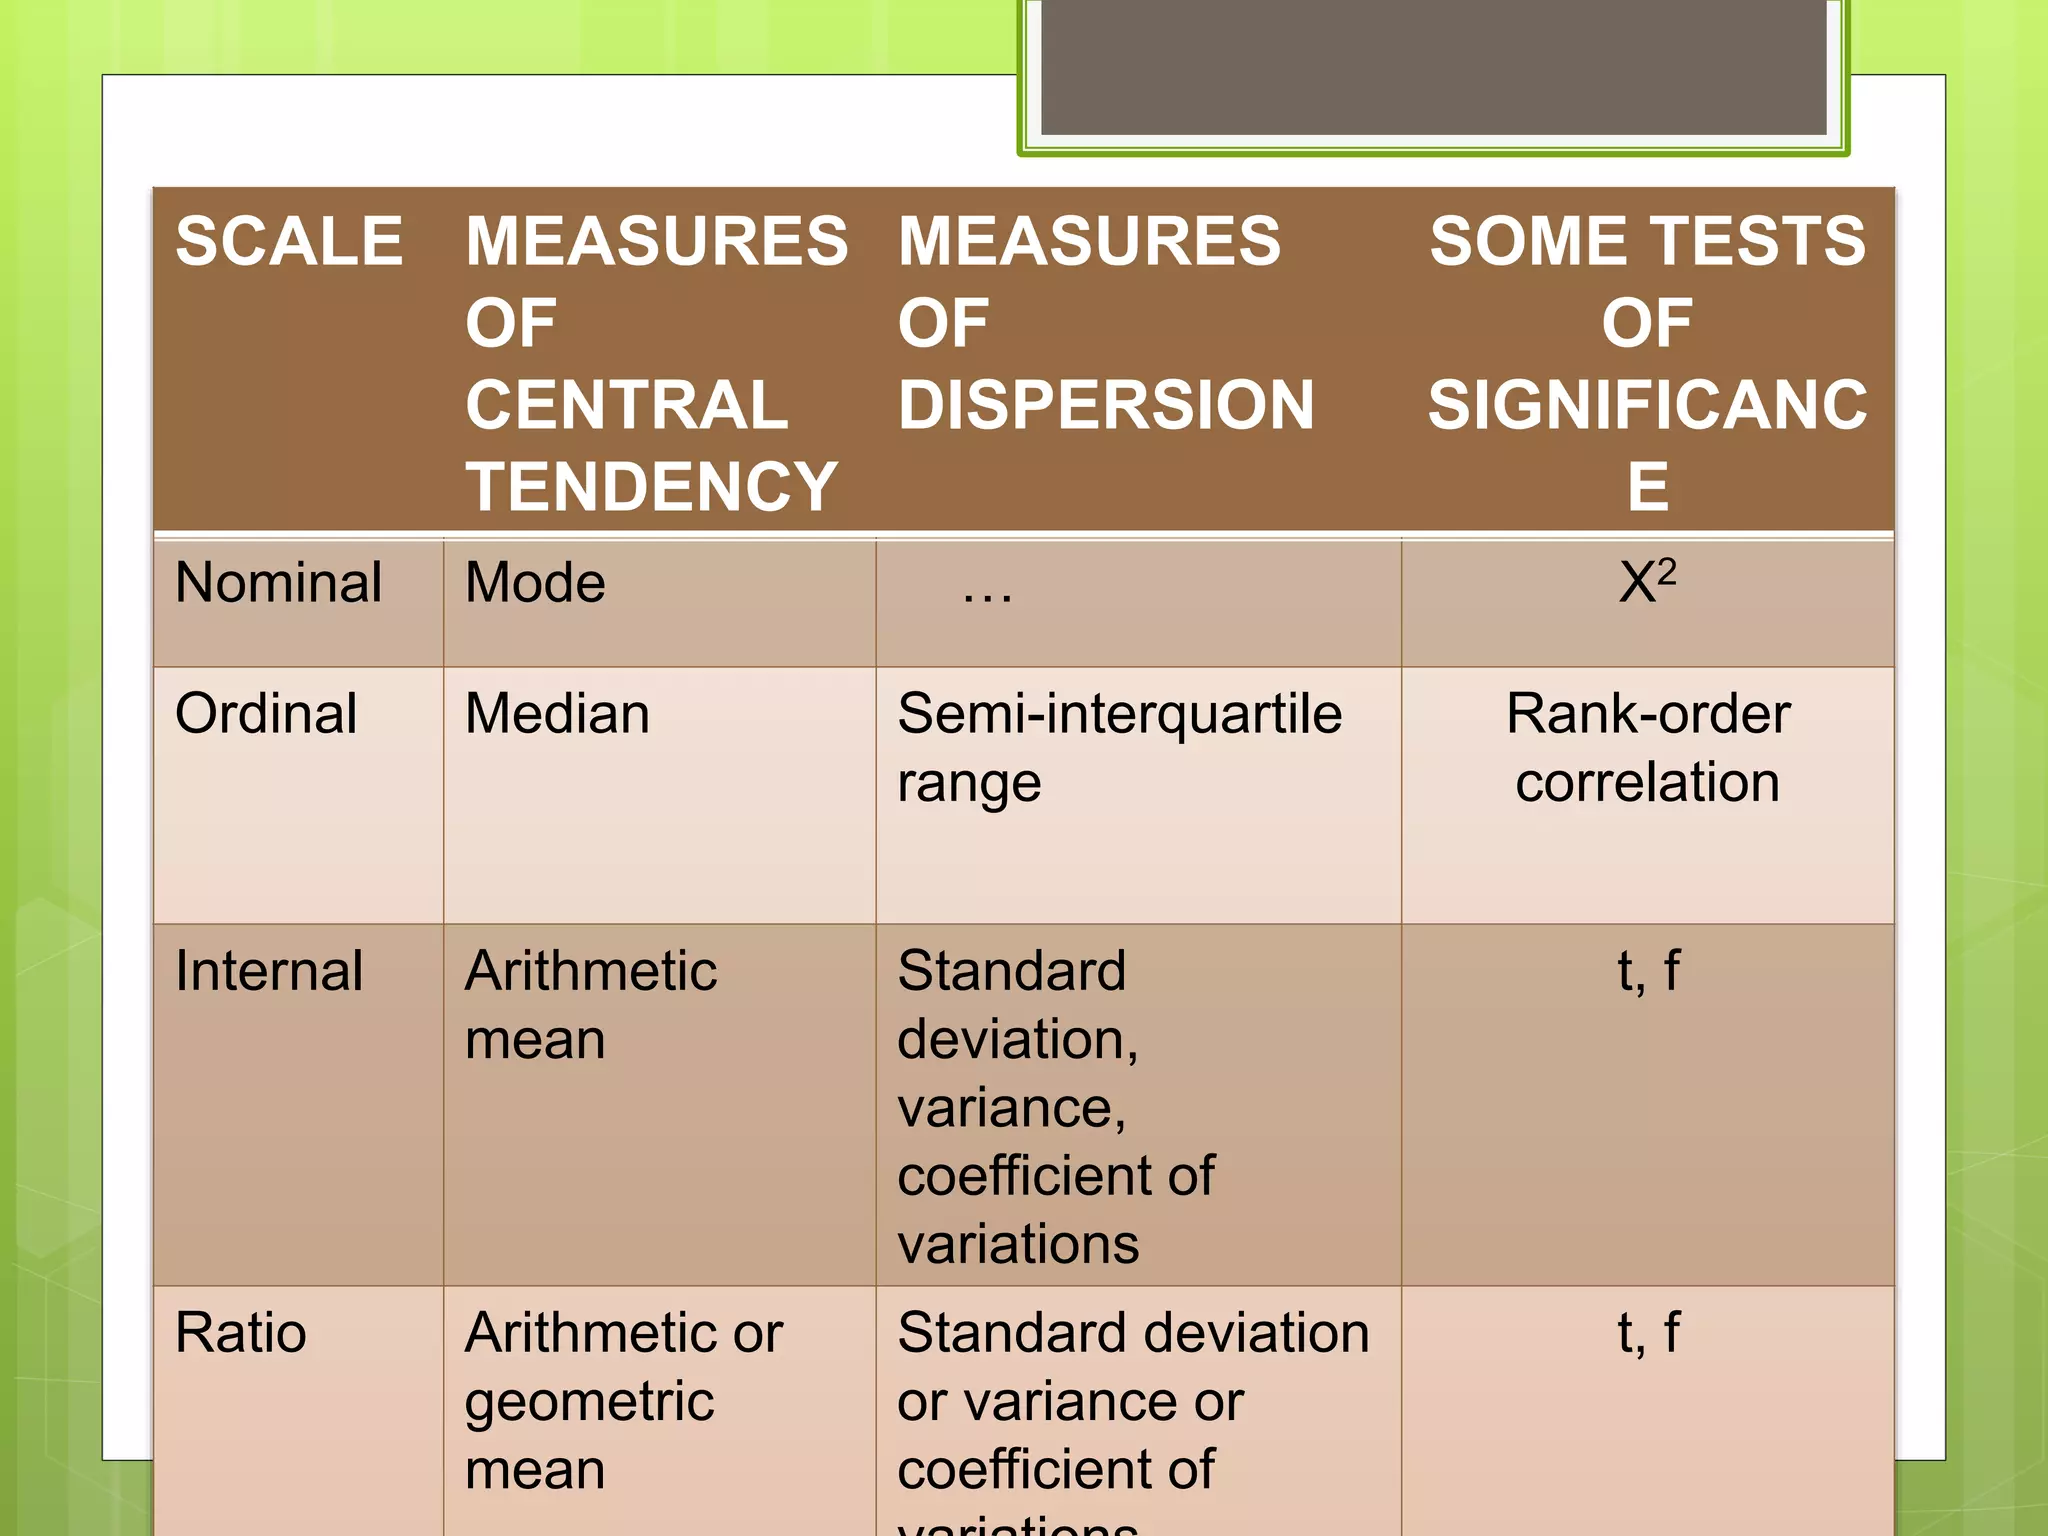
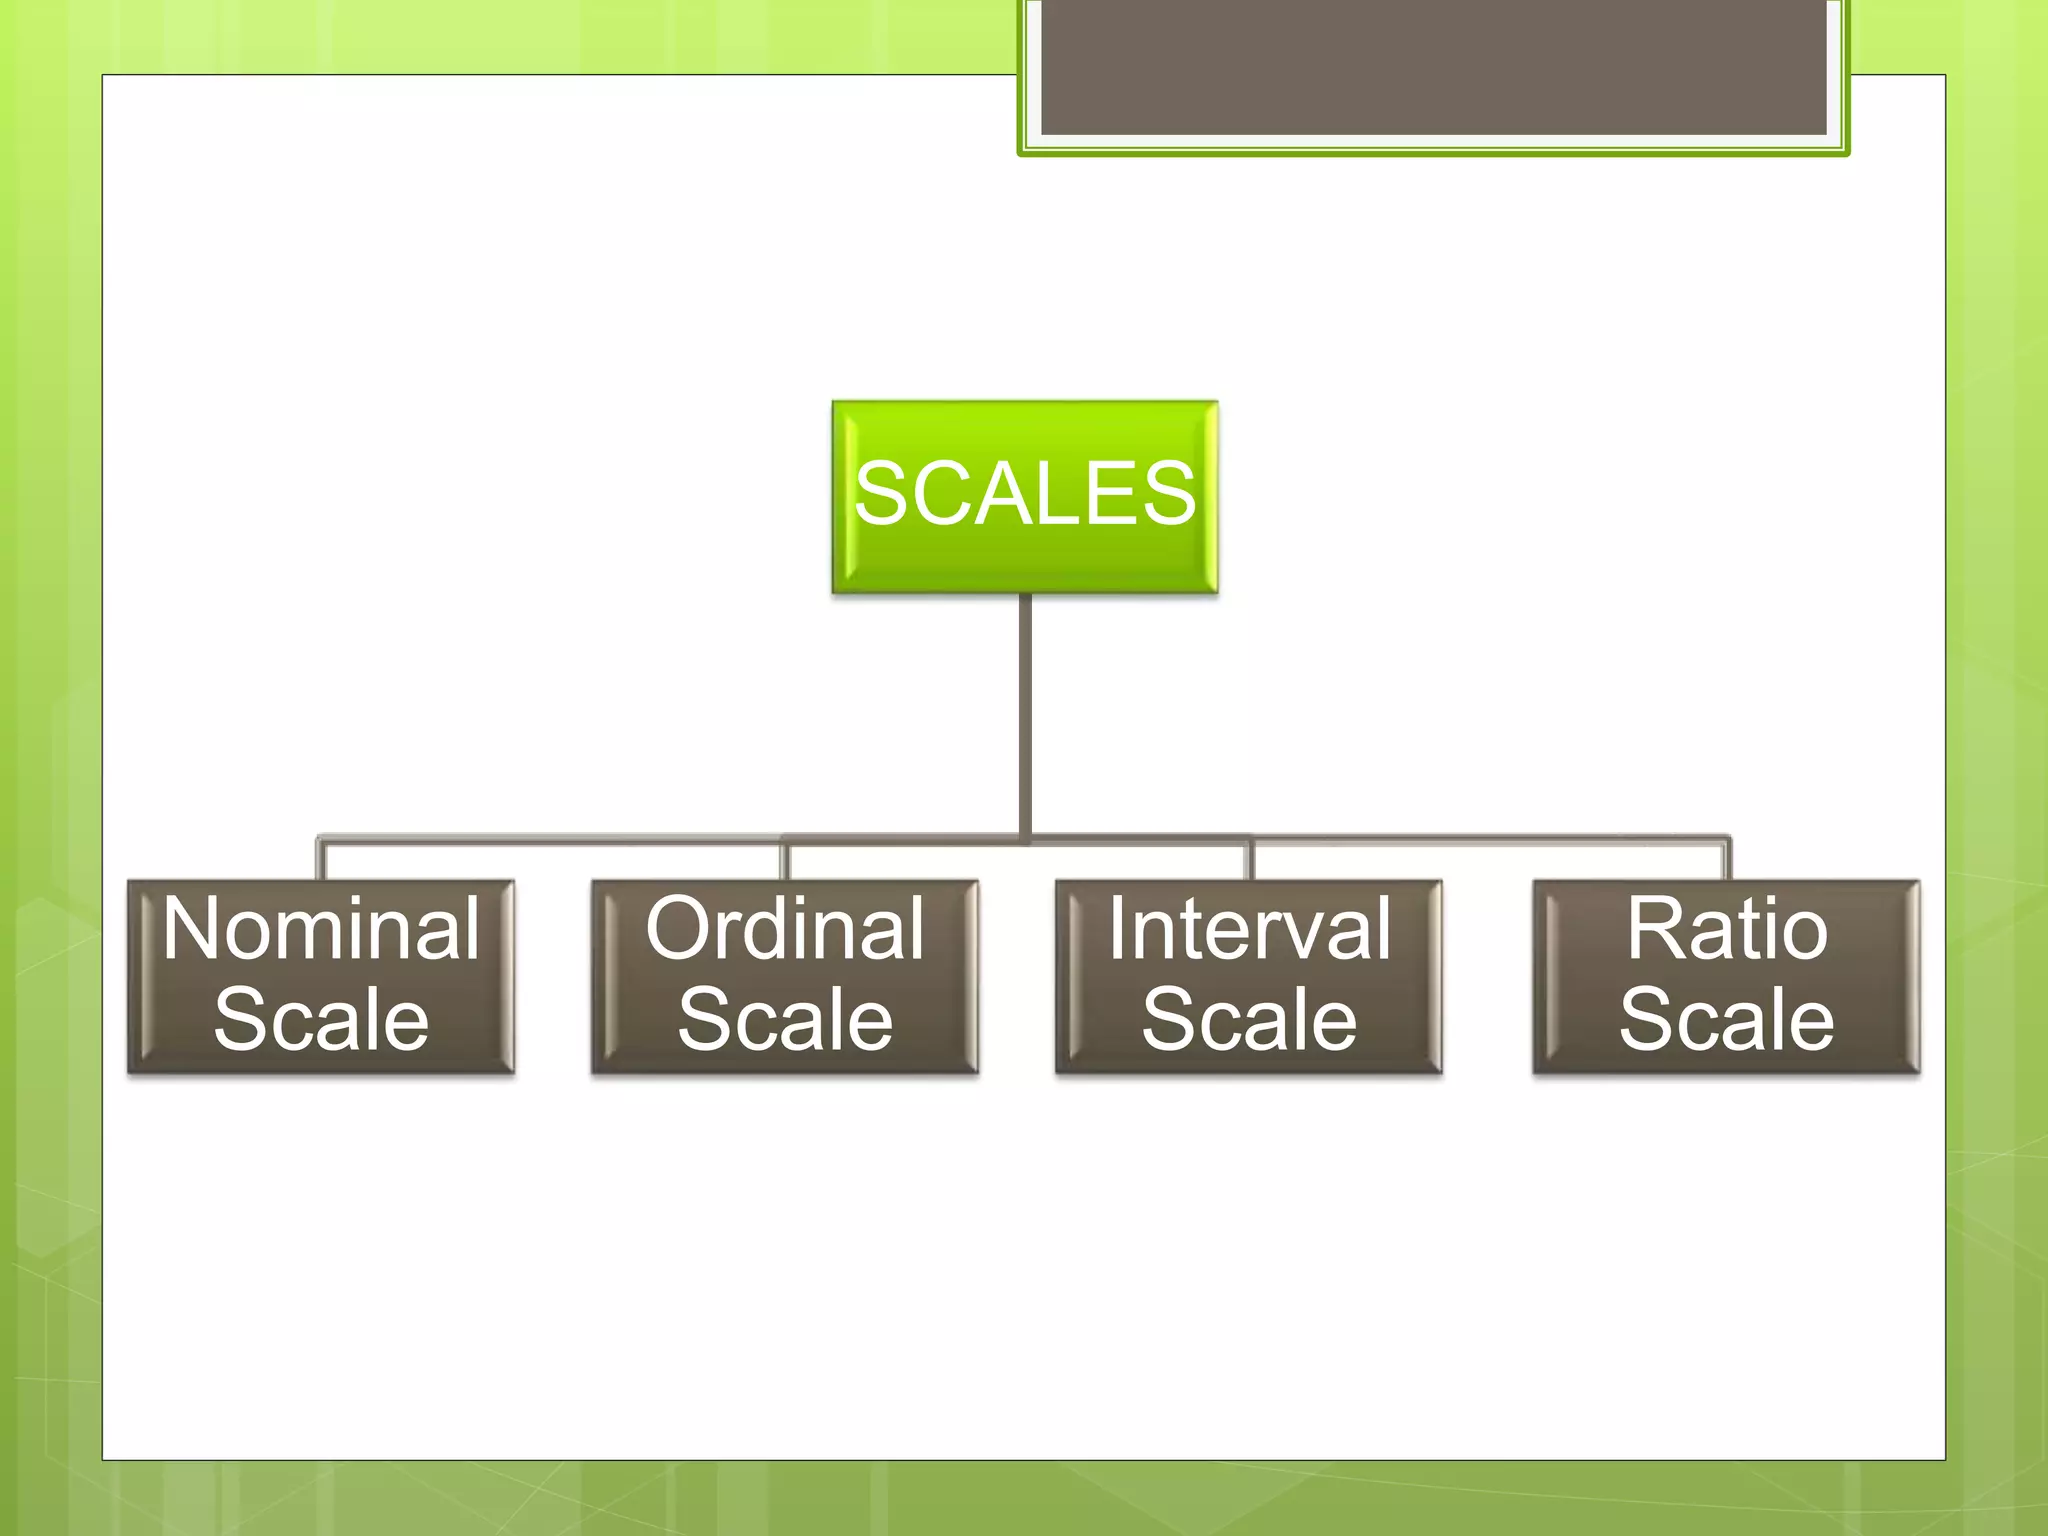
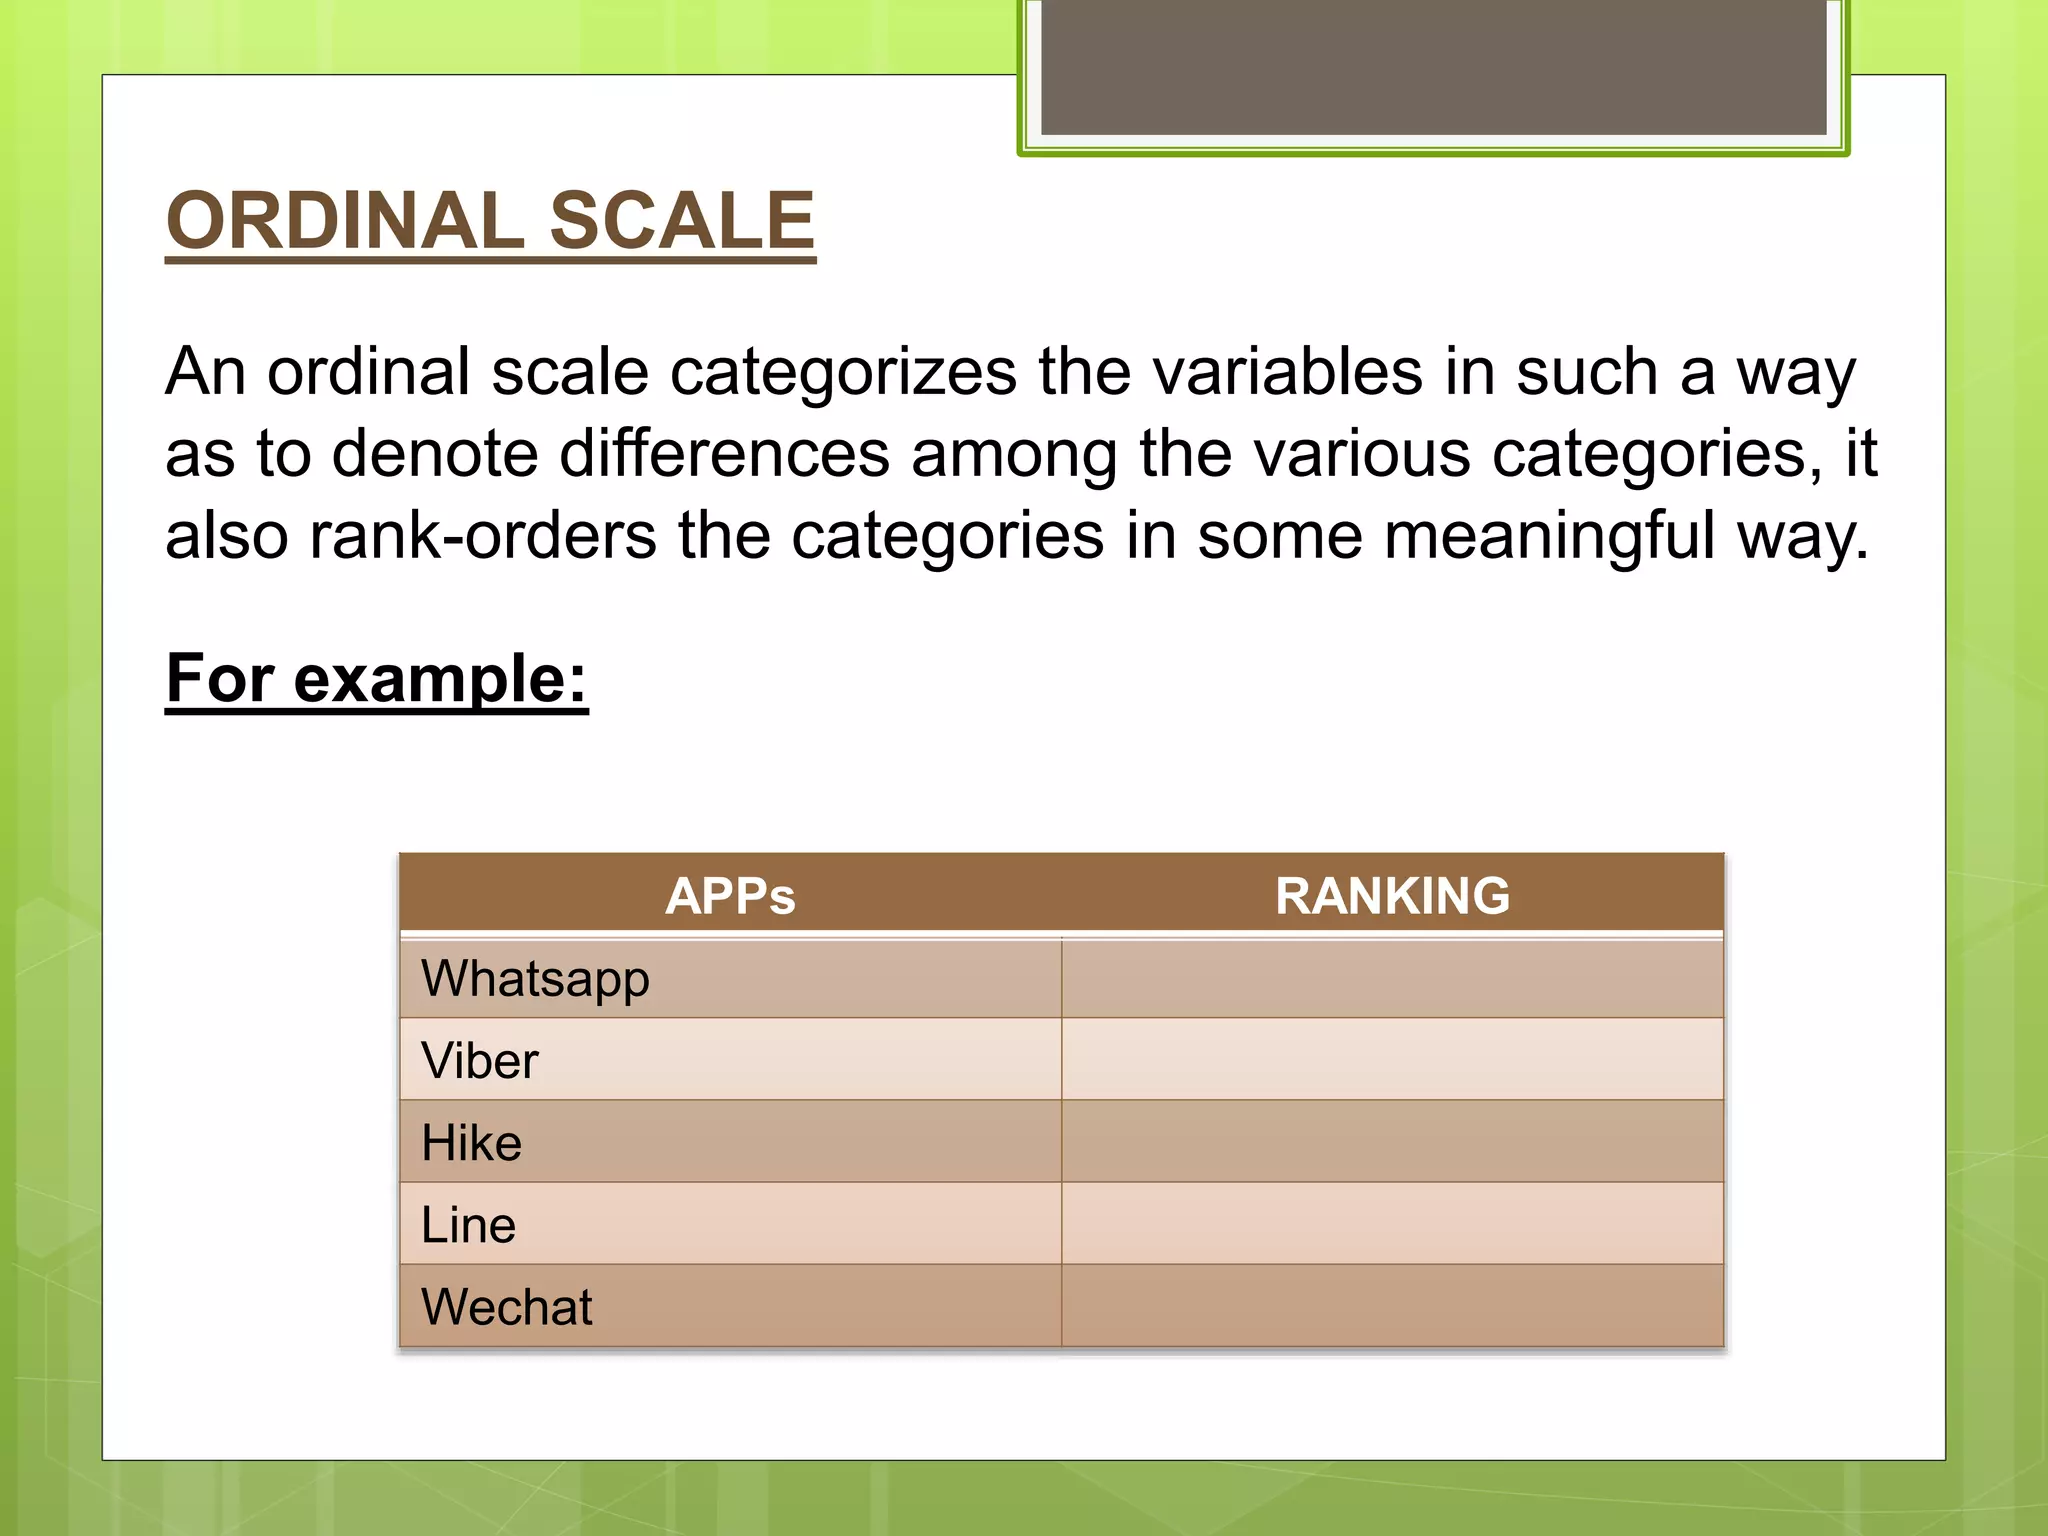
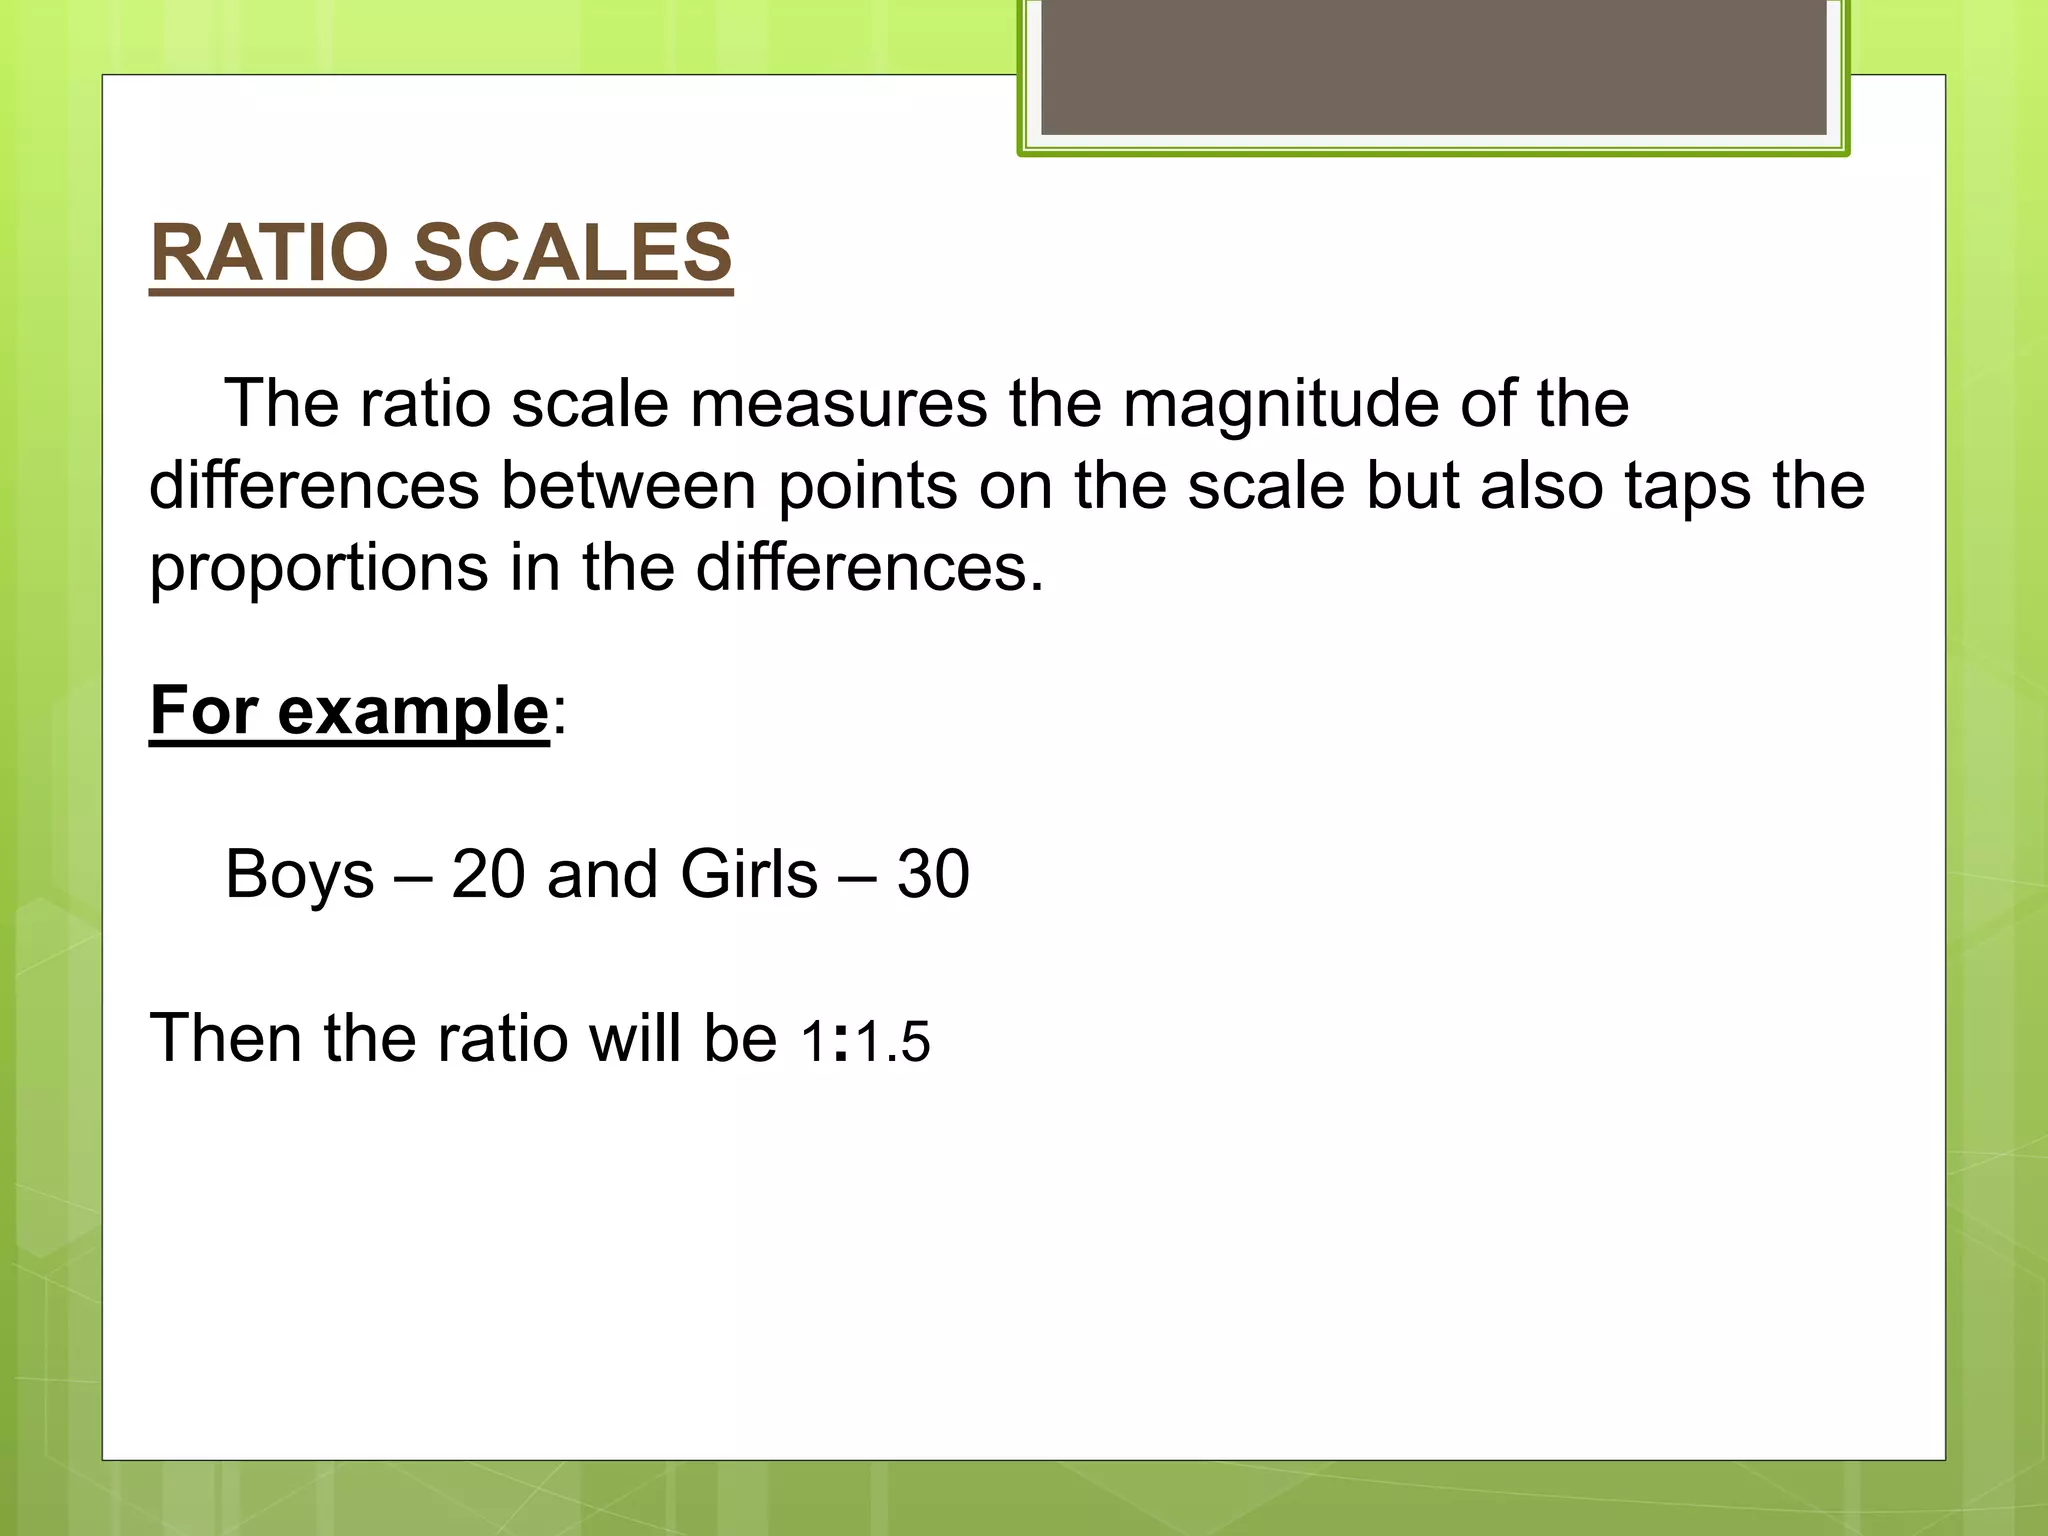
Scales are tools used to measure how individuals differ on variables of interest. There are four main types of scales: nominal scales assign subjects to categories, ordinal scales denote differences and rank categories, interval scales allow arithmetic operations on data, and ratio scales measure magnitude and proportions of differences. Examples provided include using Likert scales to rate agreement, ranking apps, and comparing boys and girls in a ratio. Various other scale types were also outlined such as dichotomous, category, semantic differential, numerical, Stapel, graphic rating, and forced choice scales. The presentation concluded with describing measures of central tendency and dispersion that correspond to each scale type, along with some common tests of significance.
caling is the branch of measurement that involves the construction of an instrument that associates qualitative constructs with quantitative metric units. Scaling evolved out of efforts in psychology and education to measure “unmeasurable” constructs like authoritarianism and self-esteem. In many ways, scaling remains one of the most arcane and misunderstood aspects of social research measurement. And, it attempts to do one of the most difficult of research tasks – measure abstract concepts.
Most people don’t even understand what scaling is. The basic idea of scaling is described in General Issues in Scaling, including the important distinction between a scale and a response format. Scales are generally divided into two broad categories: unidimensional and multidimensional. The unidimensional scaling methods were developed in the first half of the twentieth century and are generally named after their inventor. We’ll look at three types of unidimensional scaling methods here:
Thurstone or Equal-Appearing Interval Scaling
Likert or “Summative” Scaling
Guttman or “Cumulative” Scaling
In the late 1950s and early 1960s, measurement theorists developed more advanced techniques for creating multidimensional scales. Although these techniques are not considered here, you may want to look at the method of concept mapping that relies on that approach to see the power of these multivariate methods.
Its a fully detailed topic about Editing , Coding, Tabulation o Data in research work.
The editing , coding , tabulation of data is been explained in this ppt.
Research methodology - Analysis of DataThe Stockker
Processing & Analysis of Data, Data editing, Benefits of data editing, Data coding, Classification of data, CLASSIFICATION ACCORDING THE ATTRIBUTES, CLASSIFICATION ON THE BASIS OF INTERVAL, TABULATION of data, Types of tables, Graphing of data, Bar chart, Pie chart, Line graph, histogram, Polygon / ogive, Analysis of Data, Descriptive Analysis, Uni-Variate Analysis, Bivariate Analysis, Multi-Variate Analysis, Causal Analysis, Inferential Analysis, PARAMETRIC TESTS, Non parametric Test,
Data Collection tools: Questionnaire vs ScheduleAmit Uraon
Questionnaire is one of the important method of data collection in which a researcher distributes a questionnaire to the respondents and requests them to fill up the questionnaire and return.
Same way Schedule is also a set of structured questions and the answers in questionnaire is not filled up by respondents themselves but by enumerators.
Scope of research - Research Methodology - Manu Melwin Joymanumelwin
Technological innovations: Research is conducted to know & adapt new technological innovations, developments in machinery, method, etc. used . For e.g., to know level of use of information technology e.g. Networking, Tally, SAP, etc. in the organization.
Measurement is a procedure for assigning symbols, letters, or numbers to empirical properties of variables according to rules. A Scale is a tool or mechanism by which individuals are distinguished as to how they differ from one another on the variables of interest to our study There are four levels of measurements: nominal, ordinal, interval, and ratio. The measurement scales, commonly used in marketing research, can be divided into two types; comparative and non-comparative scales. A number of scaling techniques are available for measurement of attitudes. There is no unique way that you can use to select a particular scaling technique for your research study.
Research methodlogy unit-iv-measurement and data preperation_For BBA_B.com_M...Manoj Kumar
This PPT will be helpful understanding Research Methodology concepts like
Measurement
Types of Scales
Scaling Technique
Data Processing
Data Analysis & Interpretation
Displaying of Data
Links for other units are also given below kindly use that too.
Unit-I
https://www2.slideshare.net/ManojKumar730/research-methodology-unitiresearch-and-its-various-process
Unit-II
https://www2.slideshare.net/ManojKumar730/research-methodology-unit-iidata-collection
Unit-iii
https://www2.slideshare.net/ManojKumar730/research-methodlogy-unitiiisampling
Unit-IV
https://www2.slideshare.net/ManojKumar730/research-methodlogy-unitivmeasurement-and-data-preperationfor-bbabcommba-and-for-other-ug-and-pg-students
Unit-V
https://www2.slideshare.net/ManojKumar730/research-methodlogy-unitvreseach-report-for-bcom-bba-mba-and-other-ug-and-pg-courses
Macroeconomics- Movie Location
This will be used as part of your Personal Professional Portfolio once graded.
Objective:
Prepare a presentation or a paper using research, basic comparative analysis, data organization and application of economic information. You will make an informed assessment of an economic climate outside of the United States to accomplish an entertainment industry objective.
Read| The latest issue of The Challenger is here! We are thrilled to announce that our school paper has qualified for the NATIONAL SCHOOLS PRESS CONFERENCE (NSPC) 2024. Thank you for your unwavering support and trust. Dive into the stories that made us stand out!
Operation “Blue Star” is the only event in the history of Independent India where the state went into war with its own people. Even after about 40 years it is not clear if it was culmination of states anger over people of the region, a political game of power or start of dictatorial chapter in the democratic setup.
The people of Punjab felt alienated from main stream due to denial of their just demands during a long democratic struggle since independence. As it happen all over the word, it led to militant struggle with great loss of lives of military, police and civilian personnel. Killing of Indira Gandhi and massacre of innocent Sikhs in Delhi and other India cities was also associated with this movement.
Biological screening of herbal drugs: Introduction and Need for
Phyto-Pharmacological Screening, New Strategies for evaluating
Natural Products, In vitro evaluation techniques for Antioxidants, Antimicrobial and Anticancer drugs. In vivo evaluation techniques
for Anti-inflammatory, Antiulcer, Anticancer, Wound healing, Antidiabetic, Hepatoprotective, Cardio protective, Diuretics and
Antifertility, Toxicity studies as per OECD guidelines
Welcome to TechSoup New Member Orientation and Q&A (May 2024).pdfTechSoup
In this webinar you will learn how your organization can access TechSoup's wide variety of product discount and donation programs. From hardware to software, we'll give you a tour of the tools available to help your nonprofit with productivity, collaboration, financial management, donor tracking, security, and more.
The French Revolution, which began in 1789, was a period of radical social and political upheaval in France. It marked the decline of absolute monarchies, the rise of secular and democratic republics, and the eventual rise of Napoleon Bonaparte. This revolutionary period is crucial in understanding the transition from feudalism to modernity in Europe.
For more information, visit-www.vavaclasses.com
Acetabularia Information For Class 9 .docxvaibhavrinwa19
Acetabularia acetabulum is a single-celled green alga that in its vegetative state is morphologically differentiated into a basal rhizoid and an axially elongated stalk, which bears whorls of branching hairs. The single diploid nucleus resides in the rhizoid.
Model Attribute Check Company Auto PropertyCeline George
In Odoo, the multi-company feature allows you to manage multiple companies within a single Odoo database instance. Each company can have its own configurations while still sharing common resources such as products, customers, and suppliers.
How to Make a Field invisible in Odoo 17Celine George
It is possible to hide or invisible some fields in odoo. Commonly using “invisible” attribute in the field definition to invisible the fields. This slide will show how to make a field invisible in odoo 17.
A Strategic Approach: GenAI in EducationPeter Windle
Artificial Intelligence (AI) technologies such as Generative AI, Image Generators and Large Language Models have had a dramatic impact on teaching, learning and assessment over the past 18 months. The most immediate threat AI posed was to Academic Integrity with Higher Education Institutes (HEIs) focusing their efforts on combating the use of GenAI in assessment. Guidelines were developed for staff and students, policies put in place too. Innovative educators have forged paths in the use of Generative AI for teaching, learning and assessments leading to pockets of transformation springing up across HEIs, often with little or no top-down guidance, support or direction.
This Gasta posits a strategic approach to integrating AI into HEIs to prepare staff, students and the curriculum for an evolving world and workplace. We will highlight the advantages of working with these technologies beyond the realm of teaching, learning and assessment by considering prompt engineering skills, industry impact, curriculum changes, and the need for staff upskilling. In contrast, not engaging strategically with Generative AI poses risks, including falling behind peers, missed opportunities and failing to ensure our graduates remain employable. The rapid evolution of AI technologies necessitates a proactive and strategic approach if we are to remain relevant.
2. SCALES
A Scale is a tool or mechanism by which
individuals are distinguished as to how they differ
from one another on the variables of interest to our
study.
4. NOMINAL SCALE
A nominal scale is one that allows the researcher to
assign subjects to certain categories or groups.
For example: Your department
-Production
-Sales
-Accounting
-Personnel
-R&D
-Others (specify)
5. ORDINAL SCALE
An ordinal scale categorizes the variables in such a way
as to denote differences among the various categories, it
also rank-orders the categories in some meaningful way.
For example:
APPs RANKING
Whatsapp
Viber
Hike
Line
Wechat
6. INTERVAL SCALE
An interval scale allows to perform certain arithmetical
operations on the data collected from the respondents.
For example:
Strongl
y
Disagr
ee
Disagr
ee
Neither
agree
nor
Disagre
e
Agre
e
Strongl
y Agree
• My job offers me a chance
to test myself and my
abilities
7. RATIO SCALES
The ratio scale measures the magnitude of the
differences between points on the scale but also taps the
proportions in the differences.
For example:
Boys – 20 and Girls – 30
Then the ratio will be 1:1.5
8. Dichotomous scale
• to elicit yes or no answer
For example: Do you own a car? o Yes o
No
Category scale
• for multiple items to elicit a single response
For example: your caste
o OC o BC o MBC o ST o
Others
9. Semantic differential scale
• several bipolar attributes are identified
• respondents are asked to indicate their attitudes
For example: Courageous Timid
Honest
Dishonest
Numerical scale
• The scale provides number on a five-point or seven
point
• with bipolar adjectives at end
For example: Honest [7 6 5 4 3 2 1 ] Dishonest
10. Stapel scale
• it measures both the direction and intensity of the
attitude
For example:
state how you would rate your supervisor’s abilities
with respect to each of the characteristics mentioned
below
+3 +2 +1 product innovation -1 -2 -3
+3 +2 +1 interpersonal skills -1 -2 -3
11. Graphic rating scale
• it is a graphical representation
For example:
on a scale of 1 to 10, how would you rate your
supervisor?
Adequate
very bad 1 2 3 4 5 6 7 8 9 10 excellent
12. Forced choice scale
• there will be two alternatives
• choice is to select one alone
For example:
which is your favorite subject?
o maths o science