Healthcare global enterprises ltd. ipo update
•
0 likes•60 views

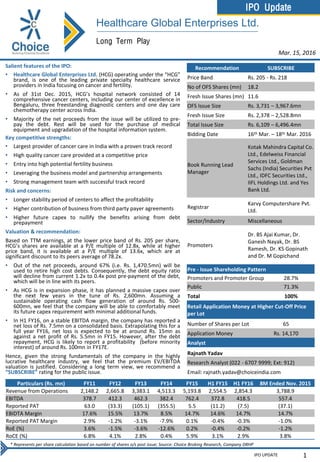
Price Band Rs. 205 - Rs. 218 No of OFS Shares (mn) 18.2 Fresh Issue Shares (mn) 11.6 OFS Issue Size Rs. 3,731 – 3,967.6mn Fresh Issue Size Rs. 2,378 – 2,528.8mn Total Issue Size Rs. 6,109 – 6,496.4mn Bidding Date 16th Mar. – 18th Mar. 2016

Recommended
Recommended
More Related Content
What's hot
What's hot (20)
Viewers also liked
Viewers also liked (15)
Similar to Healthcare global enterprises ltd. ipo update
Similar to Healthcare global enterprises ltd. ipo update (20)
Recently uploaded
Recently uploaded (20)
Healthcare global enterprises ltd. ipo update
- 1. IPO Update IPO UPDATE Long Term Play Salient features of the IPO: • Healthcare Global Enterprises Ltd. (HCG) operating under the “HCG” brand, is one of the leading private specialty healthcare service providers in India focusing on cancer and fertility. • As of 31st Dec. 2015, HCG’s hospital network consisted of 14 comprehensive cancer centers, including our center of excellence in Bengaluru, three freestanding diagnostic centers and one day care chemotherapy center across India. • Majority of the net proceeds from the issue will be utilized to pre- pay the debt. Rest will be used for the purchase of medical equipment and upgradation of the hospital information system. Key competitive strengths: • Largest provider of cancer care in India with a proven track record • High quality cancer care provided at a competitive price • Entry into high potential fertility business • Leveraging the business model and partnership arrangements • Strong management team with successful track record Risk and concerns: • Longer stability period of centers to affect the profitability • Higher contribution of business from third party payer agreements • Higher future capex to nullify the benefits arising from debt prepayment Valuation & recommendation: Based on TTM earnings, at the lower price band of Rs. 205 per share, HCG’s shares are available at a P/E multiple of 12.8x, while at higher price band, it is available at a P/E multiple of 13.6x, which are at significant discount to its peers average of 78.2x. • Out of the net proceeds, around 67% (i.e. Rs. 1,470.5mn) will be used to retire high cost debts. Consequently, the debt equity ratio will decline from current 1.2x to 0.4x post pre-payment of the debt, which will be in line with its peers. • As HCG is in expansion phase, it has planned a massive capex over the next few years in the tune of Rs. 2,600mn. Assuming a sustainable operating cash flow generation of around Rs. 500- 600mn, we feel that the company will be able to comfortably meet its future capex requirement with minimal additional funds. • In H1 FY16, on a stable EBITDA margin, the company has reported a net loss of Rs. 7.5mn on a consolidated basis. Extrapolating this for a full year FY16, net loss is expected to be at around Rs. 15mn as against a net profit of Rs. 5.5mn in FY15. However, after the debt repayment, HCG is likely to report a profitability (before minority interest) of around Rs. 100mn in FY17E. Hence, given the strong fundamentals of the company in the highly lucrative healthcare industry, we feel that the premium EV/EBITDA valuation is justified. Considering a long term view, we recommend a “SUBSCRIBE” rating for the public issue. 1 Mar. 15, 2016 Recommendation SUBSCRIBE Price Band Rs. 205 - Rs. 218 No of OFS Shares (mn) 18.2 Fresh Issue Shares (mn) 11.6 OFS Issue Size Rs. 3,731 – 3,967.6mn Fresh Issue Size Rs. 2,378 – 2,528.8mn Total Issue Size Rs. 6,109 – 6,496.4mn Bidding Date 16th Mar. – 18th Mar. 2016 Book Running Lead Manager Kotak Mahindra Capital Co. Ltd., Edelweiss Financial Services Ltd., Goldman Sachs (India) Securities Pvt Ltd., IDFC Securities Ltd., IIFL Holdings Ltd. and Yes Bank Ltd. Registrar Karvy Computershare Pvt. Ltd. Sector/Industry Miscellaneous Promoters Dr. BS Ajai Kumar, Dr. Ganesh Nayak, Dr. BS Ramesh, Dr. KS Gopinath and Dr. M Gopichand Pre - Issue Shareholding Pattern Promoters and Promoter Group 28.7% Public 71.3% Total 100% Retail Application Money at Higher Cut-Off Price per Lot Number of Shares per Lot 65 Application Money Rs. 14,170 Analyst Rajnath Yadav Research Analyst (022 - 6707 9999; Ext: 912) Email: rajnath.yadav@choiceindia.com Healthcare Global Enterprises Ltd. * Represents per share calculation based on number of shares o/s post issue; Source: Choice Broking Research, Company DRHP Particulars (Rs. mn) FY11 FY12 FY13 FY14 FY15 H1 FY15 H1 FY16 8M Ended Nov. 2015 Revenue from Operations 2,148.2 2,665.8 3,383.1 4,513.3 5,193.8 2,554.5 2,854.3 3,788.9 EBITDA 378.7 412.3 462.3 382.4 762.4 372.8 418.5 557.4 Reported PAT 63.0 (33.3) (105.1) (355.5) 5.5 (11.2) (7.5) (37.1) EBIDTA Margin 17.6% 15.5% 13.7% 8.5% 14.7% 14.6% 14.7% 14.7% Reported PAT Margin 2.9% -1.2% -3.1% -7.9% 0.1% -0.4% -0.3% -1.0% RoE (%) 3.6% -1.5% -3.6% -12.6% 0.2% -0.4% -0.2% -1.2% RoCE (%) 6.8% 4.1% 2.8% 0.4% 5.9% 3.1% 2.9% 3.8%
- 2. IPO Update IPO UPDATE 2 About the Issue: • HCG is coming up with an initial public offering (IPO) with total around 29.8mn shares (including 18.2mn OFS shares and 11.6mn fresh issue shares) in offering. Total IPO size is estimated at around Rs. 6,109 – 6,496.4mn. • The issue will open on 16th Mar. 2016 and close on 18th Mar. 2016. • Not more than 75% of the issue will be allocated to qualified institutional buyers. Further, at most 15% of the issue will be available for non-institutional bidders and the remaining 10% for retail investors. • Majority of the net proceeds from the issue will be utilized to pre-pay the debt (Rs. 1,470.5mn). Rest will be used for the purchase of medical equipment (Rs. 422.1mn) and upgradation of the hospital information system (Rs. 301.9mn). • Pre issue promoter group stake in HCG stands at 28.7%, while public stake is 71.3%. Post IPO, promoter group stake will decline to 24.6%. Source: Choice Broking Research, Company DRHP Pre and Post Issue Shareholding Pattern (%) Pre Issue Post Issue Promoter & Promoter Group (%) 28.7% 24.6% Public 71.3% 75.4% Healthcare Global Enterprises Ltd. Mar. 15, 2016
- 3. IPO Update IPO UPDATE 3 Healthcare delivery industry overview: India is the world's tenth largest economy in terms of nominal gross domestic product (GDP) which stands at USD 1.9tn and accounts for approximately 20% of the world’s population with 1.2 billion inhabitants (Source: CRISIL). The population is expected to reach 1.4bn by 2026, of which over 50% would be aged 30 years or older, compared to 40% currently. According to World Health Organization (WHO), in 2012 around 9.8mn deaths occurred in India, of which 60% were on account of non- communicable diseases and rest were caused due to cardiovascular diseases. While progress has been made in the past decade in improving the quality of healthcare services in India, the overall standard of healthcare infrastructure falls below global benchmarks. As per the Global Health Expenditure database compiled by the WHO, in 2013 India’s total expenditure on healthcare stands at 4% of its GDP. India not only trails behind developed countries in terms of healthcare spending as portion of GDP, but also developing countries such as Brazil, Russia, China and Thailand. This is primarily due to under-penetration of healthcare services and lower consumer spending on healthcare. The government’s expenditure on healthcare also ranks lower than other developing countries in terms of general government expenditure on health as a percentage of total expenditure. Source: Choice Broking Research, Company DRHP Healthcare Global Enterprises Ltd. Total healthcare expenditure as a % of GDP in 2013 Government spending on healthcare as a % of total healthcare spending in 2013 17.1% 9.7% 9.1% 6.5% 6.0% 5.6% 4.6% 4.0% 4.0% 3.1% 0% 2% 4% 6% 8% 10% 12% 14% 16% 18% 83.5% 80.1% 55.8% 54.8% 48.2% 48.1% 47.1% 41.9% 39.0% 32.2% 0% 10% 20% 30% 40% 50% 60% 70% 80% 90% Source: Choice Broking Research, Company DRHP The Indian healthcare industry comprises of five segments: (i) hospitals, (ii) pharmaceuticals, (iii) medical insurance, (iv) medical equipment and supplies, and (v) diagnostics. As per 2012 estimates, the hospital segment represented around 70% of the total healthcare revenue in India. (Source: Company RHP). Healthcare delivery in India has two components: public and private. The public, i.e., the government healthcare system, focuses on addressing primary healthcare needs across India and particularly so in the rural areas. The government also manages secondary and tertiary care hospitals across India. The private sector comprises primarily secondary and tertiary care hospitals predominantly located in metropolitan, tier I and tier II cities. The private sector accounts for almost 72% of India's total healthcare expenditure. (Source: Company RHP). Mar. 15, 2016
- 4. IPO Update IPO UPDATE 4 Healthcare delivery industry overview (Contd…): The Indian healthcare industry is expected to grow at a CAGR of 17% between 2008 to 2020; and is expected to stand at USD 280bn by 2020. (Source: Company RHP). Growth in the Indian healthcare industry will be primarily driven by: • Socio-economic changes such as growing health awareness, increasing per-capita income, increasing penetration of health insurance, increasing instances of lifestyle diseases and an aging population. • Technological advancements such as continuing development of mobile technology which will enhance the delivery of healthcare through telemedicine. • Affordability of healthcare in India, which will attract more patients. For example, treatment for major surgeries in India costs approximately 20% less than the cost in a developed country; and • Government policies in India that support growth in the healthcare industry such as tax reliefs on hospitals in tier II and tier III cities, which will attract healthcare investment in these areas Cancer Prevalence and Incidence in India: The prevalence of cancer in India is estimated to be at 3.9mn people in 2015, with 1.1mn new reported cancer cases during the year. As per the company RHP, the real incidence of cancer in India could be significantly higher than the reported figure. Data from large randomized screening trials undertaken in India suggest that the real incidence of cancer could be 1.5 to 2 times higher than the reported incidence, or an estimated 1.6 to 2.2mn new cancer cases during 2015. (Source: Company RHP). Key factors driving the increase in cancer incidences: The prevalence of cancer in India is expected to increase from an estimated 3.9mn in 2015 to an estimated 7.1mn people by 2020. The reported cancer incidences in India are expected to increase from an estimated 1.1mn in 2015 to 2.1mn by 2020. (Source: Company RHP). The increase in cancer incidences is primarily driven by the following factors: • Demographic changes (such as ageing population). • Exposure to risk factors such as consumption of tobacco & alcohol, increasing use of processed food and meat, reduced fiber content in the diet and rising incidence of obesity. Additionally, increasing levels of air pollution in urban India are also anticipated to result in an increased risk of cancer. • Narrowing diagnosis gap: Growing cancer awareness, a greater public emphasis on screening and improvements in diagnosis of cancer, are expected to result in earlier and increased diagnosis of cancer. Healthcare Global Enterprises Ltd. Mar. 15, 2016
- 5. IPO Update IPO UPDATE 5 Healthcare delivery industry overview (Contd…): Cost of Cancer Treatment in India: As of 2015, the annual expenditure in India for the diagnosis and treatment of cancer is estimated to be between USD 1.7- 2.bn. Even at for-profit hospitals in India, the cost of cancer care, including treatment with advanced technologies represents only a fraction of the cost of treatment in the US even after adjusting for purchasing power parity. (Source: Company RHP). The table below sets out the cost of cancer treatment in India and the US by service offerings, during 2014 and 2012, respectively: Healthcare Global Enterprises Ltd. Source: Choice Broking Research, Company DRHP Cost Comparison of Cancer Treatment in India and the US (mn Rs.) Even though the cost of cancer treatment in India is significantly lower than in the US, high quality cancer care is still unaffordable and inaccessible to a large proportion of the Indian population due to low population coverage of public and private insurance programs and low average household income levels. (Source: Company RHP). Infertility Incidences in India: An estimated 220mn women in India are of reproductive age (between 20 and 44 years of age) and about 27.5mn couples in this group are estimated to be suffering from infertility. The number of infertile couples in India is expected to increase from 27.5mn in 2015 to between 29-32mn by 2020. (Source: Company RHP). The total fertility rate (defined as the average number of children that would be born to a woman if she experiences the current fertility pattern throughout her reproductive span (15 to 49 years)) in India has witnessed a rapid decline over the last few decades. The total fertility rate in India has decreased from 3.9 in 1990 to 2.3 in 2013. Below are the key factors responsible for the increase in infertility incidences in India: • Demographic changes: The number of women of reproductive age in India is forecast to increase by 14% between 2010 and 2020. • Lifestyle changes: Changes in lifestyle such as increasing marital age, increasing number of working women, rising alcohol and tobacco consumption are among the factors responsible for growing infertility incidences in India. • Clinical factors such as hormone imbalance in women, genital tuberculosis, obesity etc. Type of Treatment India US US (purchasing power parity adjusted) Chemotherapy 0.15 - 0.24 1.3 - 1.8 0.51 - 0.72 Surgery 0.06 - 0.1 1.5 - 1.8 0.6 - 0.72 Radiation Therapy 0.06 - 0.1 1.1 - 1.4 0.43 - 0.54 Mar. 15, 2016
- 6. IPO Update IPO UPDATE 6 Company Introduction (Contd…): HealthCare Global Enterprises Ltd. (HCG) operating under the “HCG” brand, is one of the leading private specialty healthcare service providers in India focusing on cancer and fertility. As on 31st May 2015, the company had the largest cancer care network in India (in terms of the total number of private cancer treatment centers licensed by the Atomic Energy Regulatory Board). As of 31st Dec. 2015, HCG’s hospital network consisted of 14 comprehensive cancer centers, including its center of excellence in Bengaluru, three freestanding diagnostic centers and one day care chemotherapy center across India. Each of its comprehensive cancer centers offers at a single location provides a cancer diagnosis and treatment services (including radiation, medical oncology and surgical treatments). Freestanding diagnostic centers and day care chemotherapy center offers diagnosis and medical oncology services, respectively. In 2013, HCG acquired a 50.1% equity interest in BACC Healthcare, which operated the fertility centers under the “Milann” brand in India. Pursuant to this acquisition, the company now operates four Milann fertility centers in Bengaluru. Healthcare Global Enterprises Ltd. Revenue Breakup in FY15 Business breakup of medical services segment in FY15 Source: Choice Broking Research, Company DRHPSource: Choice Broking Research, Company DRHP 65.4% 33.9% 0.7% Income from Medical Services Income from Pharmacy Other Operating Income 91% 9% Oncology Business Fertility Business Financial Performance over FY11-15 Operating Performance over FY11-15 Source: Choice Broking Research, Company DRHPSource: Choice Broking Research, Company DRHP Primarily on the back of a 26.7% CAGR increase in the income from the medical services during FY11-15, HCG reported a 24.7% CAGR growth in top-line to Rs. 5,193.8mn in FY15. During the same period, total operating expenditure increased at a relatively higher pace of 25.8% CAGR as compared the top-line growth, thereby leading to a 19.1% CAGR rise in EBITDA to Rs. 762.4mn in FY15. EBITDA margins stood in the range of 8-18% during FY11-15. Depreciation and finance charge increased by 22.6% and 25.9%, respectively, during the period and were mainly responsible for the volatility in the earning profile of the HCG. (500) 500 1,500 2,500 3,500 4,500 5,500 FY11 FY12 FY13 FY14 FY15 H1 FY15 H1 FY16 8M Ended Nov. 2015Revenue from Operations (Rs. mn) EBITDA (Rs. mn) Reported PAT (Rs. mn) -15.0% -10.0% -5.0% 0.0% 5.0% 10.0% 15.0% 20.0% FY11 FY12 FY13 FY14 FY15 H1 FY15 H1 FY16 8M Ended Nov. 2015 EBITDA Margin (%) PAT Margin (%) RoE (%) RoCE (%) Mar. 15, 2016
- 7. IPO Update IPO UPDATE 7 Company Strengths: • Largest provider of cancer care in India with a proven track record: As of 31st May 2015, HCG was the largest provider of cancer care in India in terms of the total number of private cancer treatment centers licensed by the AERB. Beginning its expansion in 2006, the company has since added 11 comprehensive cancer centers, three freestanding diagnostic centers and one day care chemotherapy center, spread across 13 cities and towns in eight states in India. With this extensive network of HCG cancer centers, the company is able to extend the provision of cancer care beyond the metropolitan cities to patients across India. At the same time, HCG has built a strong reputation within the medical community in India, mainly due to the advanced technologies used, successful clinical outcomes and the extensive clinical experience of its specialist physicians. The company believes that its market leading position, successful track record and strong reputation in India provides it with a significant advantage over its competitors. Given below are the key operating data of the HCG’s cancer centers: Healthcare Global Enterprises Ltd. Key Operating Data of the HCG’s Cancer Centers Particulars FY13 FY14 FY15 H1 FY16 Comprehensive Cancer Centres in Operation 14 15 15 14 New Patient Registrations 28,546 34,344 37,458 18,079 Patients Treated with Radiation Therapy 10,225 11,181 12,647 6,163 PET-CT Procedures 17,750 21,040 23,988 12,253 Chemotherapy Administrations 40,052 43,988 48,360 25,453 Surgeries 7,333 8,454 8,707 4,630 Number of Available Operational Beds 746 829 875 912 Average Occupancy Rate per Operational Bed 57.6% 54.2% 53.5% 51.6% Average Length of Stay per Admitted Patient 3.4 3.2 3.0 2.9 Average Revenue per Occupied Bed per Day 19,034 21,850 24,647 26,685 Source: Choice Broking Research, Company DRHP • High quality cancer care provided at a competitive price: HCG adopts an integrated multidisciplinary and technology focused approach to provide comprehensive cancer care to its patients through its network. The company has a close collaboration and sharing of information among specialist physicians, with medical technology vendors, pharmaceutical and biotechnology companies, which enables it to offer a high standard of care to its patients and introduce and adopt the latest advances in technology relatively early in India. HCG seeks to maximize the utilization of the equipment and technologies used across its network through optimal scheduling of patients undergoing treatment, in particular, radiation therapy. The company has also implemented a centralized drug and medical consumables formulary, allowing it to maximize the utilization of generic drugs, thereby lowering the overall cost of drugs and medical consumables. Additionally, with its scale of operations and the relationship it enjoys with equipment vendors give it a competitive advantage in terms of favorable economic terms of purchase and financing of medical equipment. • Entry into high potential fertility business: Fertility treatment is an emerging segment of the Indian healthcare industry, which is currently relatively underdeveloped and fragmented. There are an estimated 27.5mn couples suffering from infertility in India, which could increase to between 29-32mn by 2020 due to demographic, lifestyle and the presence of various clinical risk factors among the Indian population. Of the estimated 27.5mn infertile couples in India, less than 0.3mn are currently seeking fertility treatment. This is mainly due to the lack of awareness of and access to fertility treatment, as well as a high cost of treatment. Nonetheless, the number of IVF cycles performed in India has increased from 7,000 in 2001 to 100,000 in 2015 and is anticipated to increase to 260,000 by 2020. With the acquisition of the majority equity interest in the BACC Healthcare, the company currently operates four Milann fertility centers in Bengaluru. Mar. 15, 2016
- 8. IPO Update IPO UPDATE 8 Company Strengths (Contd…): • Leveraging the business model and partnership arrangements: HCG network operates on a “hub and spoke” model, wherein its HCG center of excellence in Bengaluru serves as a “hub” to its other cancer centers. Through its center of excellence, the company provides its other centers access to centralized quality control & assurance services, establishes treatment protocols, centralized treatment planning & tele-radiology services, access to advanced technologies and conducts weekly central board meetings to review complex cases. HCG believes that this model allows it to effectively leverage the expertise and capabilities of its center of excellence to deliver quality cancer care in a seamless manner. • Strong management team with successful track record: The company’s senior management team has an extensive experience in the management of healthcare businesses. HCG believes that the experience, depth & diversity of its management team, complemented by the clinical expertise and relationship base of its physician promoters, is a distinct competitive advantage in the complex and rapidly evolving healthcare industry in which it operates. Business Strategies: • Expansion of the cancer care network in India: HCG plans to expand its HCG network in India by establishing new cancer centers across India and by expanding the capacity and service offering of the existing HCG cancer centers. As of 31st Dec. 2015, the company is in the process of establishing 12 new comprehensive cancer centers in India and which will be operational between FY16 to FY18. HCG is also expanding its existing HCG comprehensive cancer centers at Cuttack and Ahmedabad and is further planning to expand these centers by adding either new cancer care services or new equipment to cater to increasing demand. In the future too, the company is planning to continue with its expansion drive through green field projects, partnership arrangements and acquisitions. • Further strengthening of HCG brand: Along with the cancer care network expansion, HCG plans to invest in building and enhancing its brand image and visibility. The company intends to strengthen its patient support groups comprising of cancer survivors to further spread awareness of cancer screening and to educate patients regarding cancer treatment options and their relative outcomes and benefits. HCG also intends to continue to grow its base of referring physicians through ongoing community outreach programs and continuing medical education programs targeting such physicians. • Cancer care network expansion in Africa: In the past, the company has experienced an increase in the number of patients travelling from Africa and other regions to its center of excellence in Bengaluru, as well as to other comprehensive cancer centers in India for cancer treatment. During H1 FY16, FY15, FY14 and FY13, HCG derived 17.8%, 15.6%, 12.6% and 7.9%, respectively, of its total revenue at its center of excellence from such international patients. Thus this growing demand presents it with an opportunity to establish a network of specialty cancer centers in Africa. Currently, HCG is planning to establish a network of specialty cancer centers in Africa through partnership arrangements and acquisitions. The company has entered into a definitive agreement with CDC, pursuant to which CDC will invest in HCG’s subsidiary, HCG Africa, to establish a network of comprehensive cancer centers in Africa. In the first phase of the development, the company plans to establish comprehensive cancer centers in Kenya, Tanzania and Uganda. • Upgradation and strengthening of information technology infrastructure: HCG is in the process of significantly upgrading its information technology infrastructure in order to enhance the quality of care delivered to patients and to further enhance its clinical best practices and research capabilities. The company has planned an information technology infrastructure based on a private cloud-computing system and will encompass a centralized EMR system seamlessly integrated with various other centralized systems including HIS and ERP system. Adoption of a cloud-based centralized information technology infrastructure will enable it to transition from the current paper-based and de-centralized medical records system to a centrally managed and administered electronic medical records system. Adoption of these systems will allow the company to efficiently manage its operations, including optimal utilization of equipment and human resources, billing and receivables management, inventory management, central purchasing, formulary management and financial controls. Healthcare Global Enterprises Ltd. Mar. 15, 2016
- 9. IPO Update IPO UPDATE 9 Business Strategies (Contd…): • Expansion of Milann fertility centers across India: The IVF market in India is under-penetrated relative to its potential demand. The potential demand for IVF cycles could be nine to 12 times higher than the current actual number of patients availing treatment in Delhi, Mumbai and Bengaluru. The number of infertile couples coming forward for fertility treatment in India is estimated to increase from the current 270,000 to around 650,000 to 700,000 by 2020. (Source: Company RHP). In order to address the growing demand for fertility treatment in India, HCG is planning to expand its Milann network by setting up green field centers and also by entering into partnership arrangements and undertaking selective acquisitions. As of 31st Dec. 2015, the company is in the process of establishing three fertility centers in India. Risk and concerns: • Longer stability period of centers to affect the profitability: Historically, the company’s business growth has been primarily driven by the establishment of new centers and HCG expects this to continue to be the future key drivers for growth. The company is in the process of adding 12 new comprehensive cancer centers to its network and is also expanding two of its existing HCG comprehensive cancer centers to add more services and equipment. Normally during the initial ramp up period, operational expenses exceed the revenue, resulting to an operational loss. HCG has longer stability period of 2-3 years for each centers. Currently of the 14 operational centers, only five centers are operating at an EBITDA margin of around 25%. Thus a longer stability period will be negative for the company as it will take time to realize the potential of the economics of scale. • Higher contribution of business from third party payer agreements: HCG’s patients include patients who pay for their medical expenses themselves and patients who are beneficiaries of third party payer agreements. In the case of patients who are beneficiaries of third party payer agreements, all or part of the medical bill is payable by the third party payer as per the terms of the relevant payer agreement. To be eligible for reimbursement by a third party payer, the company’s centers and hospitals need to be empanelled by the payer, and pursuant to such empanelment, HCG enter into an agreement with the payer. Each third party payer agreement typically specifies the services covered, as well as any exclusion, the approved tariffs for each of the services covered and the terms of payment. Consequently, HCG’s revenue and profitability depend on the applicable third-party tariffs, the extent of third-party coverage or limits, the payment terms or the reimbursement policies related to these third-party arrangements. Any favorable change in the third-party tariffs and other elements of arrangement is likely to increase the revenue and profitability of the company and vice a versa. Historically, HCG generated around 32-35% of the total revenue from third party agreements. Any non-payment by such third party payers will impact the company’s revenue and profitability. In the past, there have been delays and nonpayment by third party payers. As of 30 Nov. 2015, HCG had an outstanding gross receivables amounting to Rs. 900.1mn from third party payers, which also included provisions for disallowances and doubtful trade receivables. Provisions for disallowances reduce the revenue from operations and provisions for doubtful trade receivables increase its expenses and thus reduce its profitability. • Higher future capex to nullify the benefits arising from debt prepayment: Out of the net proceeds, around 67% (i.e. Rs. 1,470.5mn) will be used to retire debt. As of 31st Dec. 2015, HCG has a debt of Rs. 3.697.5mn under various loan agreements. With the retirement of debt, the company is aiming to reduce average cost of debt to 8-9% from the current 10%. As HCG has planned a massive capex over the next two years, we feel it will need additional funds for its capex, thus we are not anticipating any significant savings in the finance cost on the retirement of the debt. Healthcare Global Enterprises Ltd. Mar. 15, 2016
- 10. IPO Update IPO UPDATE 10 Peer comparison and our recommendation: Source: Choice Broking Research, Company DRHP Source: Choice Broking Research, Company DRHP At the lower band of Rs. 205 per share, HCG’s share are available at a P/E multiple of 12.8x, which is at a significant discount to the average P/E multiple of 78.2x of peers such as Apollo Hospitals Enterprise Ltd., Fortis Healthcare Ltd., Indraprastha Medical Corporation Ltd., Fortis Malar Hospitals Ltd., Narayana Hrudayalaya Ltd. and Kovai Medical Center and Hospital Ltd.. At a higher price band of Rs. 218, the company’s share is available at P/E multiple of 13.6x. However, on P/BVPS and EV/EBITDA front, HCG is priced at a premium as compared to its peers average of 78.2x. At the higher price of the band, HCG is expecting a valuation of Rs. 20.6mn per bed as against the capital cost of Rs. 6.7mn per bed. Moreover, the valuation per bed demanded by the company is also higher as compared to a valuation range of Rs. 10-16mn set by its competitors in recent acquisitions. Out of the net proceeds, around 67% (i.e. Rs. 1,470.5mn) will be used to retire high cost debts. As of 31st Dec. 2015, HCG has a debt of Rs. 3.697.5mn under various loan agreements. With the retirement of debt, the company is aiming to reduce average cost of debt to 8-9% from the current 10%. Consequently, the debt equity ratio will decline from current 1.2x to 0.4x post pre-payment of the debt, which will be in line with its peers. As HCG is in expansion phase, it has planned a massive capex over the next few years in the tune of Rs. 2,600mn. Assuming a sustainable operating cash flow generation of around Rs. 500-600mn, we feel that the company will be able to comfortably meet its future capex requirement with minimal additional funds. During FY11-15, HCG’s EBITDA margin declined from 17.6% in FY11 to 14.7% in FY15. Additionally, it reported a net loss for majority of the period, primarily due to higher financial charge. In H1 FY16, on a stable EBITDA margin, the company has reported a net loss of Rs. 7.5mn on a consolidated basis. Extrapolating this for a full year FY16, net loss is expected to be at around Rs. 15mn as against a net profit of Rs. 5.5mn in FY15. However, after the debt repayment, HCG is likely to report a profitability (before minority interest) of around Rs. 100mn in FY17E. Hence, given the strong fundamentals of the company in the highly lucrative healthcare industry, we feel that the premium EV/EBITDA valuation is justified. Considering a long term view, we recommend a “SUBSCRIBE” rating for the public issue. Healthcare Global Enterprises Ltd. Company Name EPS (Rs.) BVPS (Rs.) DPS (Rs.) Debt Equity Ratio RoE (%) RoCE (%) P / E (x) P / B (x) EV / Sales (x) EV / EBITDA (x) MCAP / Sales (x) Healthcare Global Enterprises Ltd. 16.0 37.8 0.0 1.2 0.3% 5.6% 13.6 5.8 4.0 27.2 3.4 Apollo Hospitals Enterprise Ltd. 26.7 240.5 5.8 0.6 11.1% 11.3% 52.6 5.8 4.0 28.8 3.7 Fortis Healthcare Ltd. 1.0 106.8 0.0 0.2 1.0% -0.2% 161.8 1.6 1.9 38.1 1.9 Indraprastha Medical Corporation Ltd. 3.3 23.2 1.8 0.2 14.2% 23.6% 15.3 2.2 0.7 5.9 0.6 Fortis Malar Hospitals Ltd. 3.9 50.6 0.5 0.0 7.7% 4.6% 14.0 1.1 0.6 10.8 0.8 Narayana Hrudayalaya Ltd. 1.4 38.7 0.0 0.3 3.7% 6.5% 207.0 7.6 4.8 47.0 4.6 Kovai Medical Center and Hospital Ltd. 35.4 144.3 1.5 0.7 24.6% 25.0% 18.6 4.6 1.7 8.7 1.6 Average 12.0 100.7 1.6 0.3 10.4% 11.8% 78.2 3.8 2.3 23.2 2.2 Company Name Face Value (Rs.) CMP (Rs.) MCAP (Rs. mn) TTM Total Operating Revenue (Rs. mn) TTM EBITDA Margin (%) TTM PAT Margin (%) Healthcare Global Enterprises Ltd. 10 218 18,547 5,494 14.7% 0.2% Apollo Hospitals Enterprise Ltd. 5 1,403 195,220 52,165 14.0% 7.1% Fortis Healthcare Ltd. 10 169 78,445 42,003 5.0% 1.2% Indraprastha Medical Corporation Ltd. 10 51 4,639 7,236 11.2% 4.2% Fortis Malar Hospitals Ltd. 10 54 1,007 1,269 5.9% 5.7% Narayana Hrudayalaya Ltd. 10 293 59,878 13,076 10.1% 2.2% Kovai Medical Center and Hospital Ltd. 10 660 7,222 4,501 19.9% 8.6% Average 11.0% 4.8% Mar. 15, 2016
- 11. IPO Update IPO UPDATE 11 Financial Statements: Source: Choice Broking Research, Company DRHP Source: Choice Broking Research, Company DRHP Healthcare Global Enterprises Ltd. Consolidated Profit and Loss Statement Particulars (Rs. mn) FY11 FY12 FY13 FY14 FY15 H1 FY15 H1 FY16 8M Ended Nov. 2015 Income from Medical Services 1,318.9 1,648.3 2,221.0 3,009.8 3,395.7 1,690.7 1,951.7 2,578.6 Income from Pharmacy 826.9 1,014.4 1,150.8 1,477.3 1,762.9 847.8 870.4 1,170.5 Other Operating Income 2.4 3.1 11.3 26.3 35.2 15.9 32.2 39.8 Revenue from Operations 2,148.2 2,665.8 3,383.1 4,513.3 5,193.8 2,554.5 2,854.3 3,788.9 Purchase of Stock-in-Trade (637.1) (828.3) (1,057.9) (1,354.2) (1,493.7) (753.5) (753.7) (984.1) Increase / (Decrease) in Stock-in-Trade 20.7 17.5 22.6 20.1 33.4 20.1 (0.9) (6.4) Employee Benefits Expense (322.8) (421.5) (534.7) (767.6) (815.1) (396.3) (475.2) (642.8) Other Expenses (830.3) (1,021.1) (1,350.8) (2,029.2) (2,155.9) (1,051.9) (1,206.1) (1,598.2) EBITDA 378.7 412.3 462.3 382.4 762.4 372.8 418.5 557.4 Depreciation & Amortization Expense (176.1) (237.7) (295.7) (361.8) (398.3) (199.0) (217.2) (289.9) EBIT 202.6 174.6 166.6 20.7 364.2 173.9 201.3 267.5 Finance Costs (136.1) (239.8) (291.8) (322.3) (342.3) (169.2) (177.8) (244.2) Other Income 13.7 36.3 23.8 39.7 48.2 14.7 18.5 24.0 Exceptional Expenses (4.6) (45.6) (45.6) (27.2) (50.5) EBT 80.2 (28.8) (101.5) (266.5) 24.4 (26.3) 14.7 (3.3) Tax Expenses (9.8) (2.3) (7.1) (53.5) 16.8 34.4 1.7 (7.3) PAT 70.4 (31.1) (108.6) (320.0) 41.2 8.1 16.4 (10.6) Minority Interest (7.4) (2.3) 3.5 (35.5) (35.8) (19.3) (23.9) (26.5) Reported PAT 63.0 (33.3) (105.1) (355.5) 5.5 (11.2) (7.5) (37.1) Consolidated Balance Sheet Particulars (Rs. mn) FY11 FY12 FY13 FY14 FY15 H1 FY15 H1 FY16 8M Ended Nov. 2015 Share Capital 533.0 592.7 668.9 682.5 699.8 688.3 729.6 734.8 Shares Pending Allotment 1.1 5.8 5.8 8.5 8.5 Share Application Money Pending Allotment 72.9 Reserves and Surplus 1,103.5 1,519.6 2,159.3 1,949.4 2,086.6 1,975.4 2,188.2 2,210.6 Minority Interest 54.0 82.2 125.8 183.1 253.0 170.3 300.1 272.0 Long-Term Borrowings 937.2 1,354.0 2,393.4 2,518.0 2,802.4 2,423.7 3,311.7 3,582.5 Deferred Tax Liabilities (Net) 14.7 15.5 14.6 12.1 5.2 3.7 5.1 5.9 Other Long-Term Liabilities 106.2 130.9 19.4 13.7 16.1 11.8 11.1 Long-Term Provisions 30.5 23.9 32.3 21.9 22.6 19.2 25.2 24.7 Short-Term Borrowings 215.7 517.2 380.2 180.0 292.7 394.3 400.6 268.9 Trade Payables 361.7 362.8 527.2 705.4 832.7 926.7 967.7 989.4 Other Current Liabilities 301.5 477.7 647.1 582.9 709.9 656.5 693.9 772.6 Short-Term Provision 2.0 10.0 4.4 26.3 34.7 37.4 38.4 39.2 Total Liabilities 3,627.7 5,061.8 7,089.8 6,886.7 7,761.7 7,319.8 8,672.2 8,911.6 Tangible Fixed Assets 2,534.4 3,766.3 4,222.9 4,337.5 4,516.9 4,273.5 4,643.0 4,596.6 Intangible Fixed Assets 8.9 9.7 192.7 175.7 159.2 166.3 30.6 28.4 Capital work-in-Progress 37.3 48.2 62.7 108.7 422.4 190.5 878.2 1,334.3 Goodwill on Consolidation 88.7 98.7 606.6 602.0 608.9 608.8 608.9 608.9 Non-Current Investments 1.2 1.2 2.2 23.3 1.2 39.4 1.2 1.2 Deferred Tax Asset (Net) 19.1 17.7 11.4 2.3 58.8 60.4 77.5 72.3 Long-Term Loans and Advances 415.5 250.6 396.1 492.5 699.7 612.5 875.1 842.8 Other Non-Current Assets 19.4 29.9 47.5 48.2 74.9 45.9 82.0 94.8 Current Investments 8.3 0.9 603.7 Inventories 53.2 70.7 99.7 119.8 145.5 132.2 141.5 136.0 Trade Receivables 291.6 430.7 601.8 528.6 638.1 733.8 698.9 747.3 Cash and Bank Balances 57.5 166.3 106.7 254.8 269.5 201.4 272.4 195.1 Short-Term Loans and Advances 51.6 108.6 66.7 117.6 80.5 162.4 90.6 91.5 Other Current Assets 41.1 62.5 69.0 75.7 86.1 92.9 272.3 162.5 Total Assets 3,627.7 5,061.8 7,089.8 6,886.7 7,761.7 7,319.8 8,672.2 8,911.6 Mar. 15, 2016
- 12. IPO Update IPO UPDATE 12 Financial Statements (Contd…): Source: Choice Broking Research, Company DRHP * Represents per share calculation based on number of shares o/s post issue; Source: Choice Broking Research, Company DRHP Healthcare Global Enterprises Ltd. Consolidated Cash Flow Statement Particulars (Rs. mn) FY11 FY12 FY13 FY14 FY15 H1 FY15 H1 FY16 8M Ended Nov. 2015 Cash Flow from Operating Activities 363.7 186.9 311.3 514.2 596.5 196.0 362.4 474.5 Cash Flow from Investing Activities (343.8) (459.2) (1,970.1) (116.0) (797.1) (387.8) (846.1) (1,221.0) Cash Flow from Financing Activities (8.4) 380.9 1,396.0 (268.5) 215.6 129.7 485.0 678.3 Net Cash Flow 11.5 108.6 (262.9) 129.7 15.1 (62.2) 1.3 (68.3) Opening Balance of Cash & Cash Equivalents 46.1 57.7 369.6 125.1 254.5 263.5 271.1 263.3 Closing Balance of Cash & Cash Equivalents 57.5 166.3 106.7 254.8 269.5 201.4 272.4 195.1 Consolidated Financial Ratios Particulars (Rs. mn) FY11 FY12 FY13 FY14 FY15 H1 FY15 H1 FY16 8M Ended Nov. 2015 Revenue Growth 24.1% 26.9% 33.4% 15.1% - 11.7% - EBIDTA Growth 8.9% 12.1% -17.3% 99.4% - 12.2% - EBIDTA Margin 17.6% 15.5% 13.7% 8.5% 14.7% 14.6% 14.7% 14.7% EBIT Growth -13.8% -4.6% -87.6% 1660.9% - 15.8% - EBIT Margin 9.4% 6.6% 4.9% 0.5% 7.0% 6.8% 7.1% 7.1% Reported PAT Growth -152.9% 215.6% 238.1% -101.5% - -32.9% - Reported PAT Margin 2.9% -1.2% -3.1% -7.9% 0.1% -0.4% -0.3% -1.0% Liquidity Ratios Current Ratio 0.8 1.0 1.3 0.8 0.8 0.8 0.9 0.7 Quick Ratio 0.7 0.9 1.2 0.7 0.7 0.7 0.8 0.7 Interest Coverage Ratio 1.5 0.7 0.6 0.1 1.1 1.0 1.1 1.1 Debt Equity Ratio 0.7 0.9 0.9 1.0 1.0 1.0 1.2 1.2 Turnover Ratios Inventory Turnover Ratio 40.3 37.7 33.9 37.7 35.7 19.3 20.2 27.9 Receivable Turnover Ratio 7.4 6.2 5.6 8.5 8.1 3.5 4.1 5.1 Accounts Payable Turnover Ratio 5.9 7.3 6.4 6.4 6.2 2.8 2.9 3.8 Fixed Asset Turnover Ratio 0.8 0.7 0.7 0.9 0.9 0.5 0.5 0.6 Total Asset Turnover Ratio 0.6 0.5 0.5 0.7 0.7 0.3 0.3 0.4 Return Ratios RoE (%) 3.6% -1.5% -3.6% -12.6% 0.2% -0.4% -0.2% -1.2% RoA (%) 1.7% -0.7% -1.5% -5.2% 0.1% -0.2% -0.1% -0.4% RoCE (%) 6.8% 4.1% 2.8% 0.4% 5.9% 3.1% 2.9% 3.8% Per Share Data Restated BVPS 20.7 25.8 34.8 33.2 35.8 33.4 37.8 37.8 Restated Basic and Diluted EPS 0.7 (0.4) (1.2) (4.2) 0.1 (0.1) (0.1) (0.4) Restated Cash EPS 2.8 2.4 2.2 0.1 4.7 2.2 2.5 3.0 Restated Operating Cash Flow Per Share (OpCFPS) 4.3 2.2 3.7 6.0 7.0 2.3 4.3 5.6 Mar. 15, 2016
- 13. IPO Update IPO UPDATE es 13 Disclaimer This is solely for information of clients of Choice Broking and does not construe to be an investment advice. It is also not intended as an offer or solicitation for the purchase and sale of any financial instruments. Any action taken by you on the basis of the information contained herein is your responsibility alone and Choice Broking its subsidiaries or its employees or associates will not be liable in any manner for the consequences of such action taken by you. We have exercised due diligence in checking the correctness and authenticity of the information contained in this recommendation, but Choice Broking or any of its subsidiaries or associates or employees shall not be in any way responsible for any loss or damage that may arise to any person from any inadvertent error in the information contained in this recommendation or any action taken on basis of this information. This report is based on the fundamental analysis with a view to forecast future price. The Research analysts for this report certifies that all of the views expressed in this report accurately reflect his or her personal views about the subject company or companies and its or their securities, and no part of his or her compensation was, is or will be, directly or indirectly related to specific recommendations or views expressed in this report. Choice Broking has based this document on information obtained from sources it believes to be reliable but which it has not independently verified; Choice Broking makes no guarantee, representation or warranty and accepts no responsibility or liability as to its accuracy or completeness. The opinions contained within the report are based upon publicly available information at the time of publication and are subject to change without notice. The information and any disclosures provided herein are in summary form and have been prepared for informational purposes. The recommendations and suggested price levels are intended purely for stock market investment purposes. The recommendations are valid for the day of the report and will remain valid till the target period. The information and any disclosures provided herein may be considered confidential. Any use, distribution, modification, copying, forwarding or disclosure by any person is strictly prohibited. The information and any disclosures provided herein do not constitute a solicitation or offer to purchase or sell any security or other financial product or instrument. The current performance may be unaudited. Past performance does not guarantee future returns. There can be no assurance that investments will achieve any targeted rates of return, and there is no guarantee against the loss of your entire investment. POTENTIAL CONFLICT OF INTEREST DISCLOSURE (as on date of report) Disclosure of interest statement – • Analyst interest of the stock /Instrument(s): - No. • Firm interest of the stock / Instrument (s): - No. Choice’s Rating Rationale The price target for a large cap stock represents the value the analyst expects the stock to reach over next 12 months. For a stock to be classified as Outperform, the expected return must exceed the local risk free return by at least 5% over the next 12 months. For a stock to be classified as Underperform, the stock return must be below the local risk free return by at least 5% over the next 12 months. Stocks between these bands are classified as Neutral. Choice Equity Broking Pvt. Ltd. Choice House, Shree Shakambhari Corporate Park, Plt No: -156-158, J.B. Nagar, Andheri (East), Mumbai - 400 099. +91-022-6707 9999 +91-022-6707 9959 www.choiceindia.com IPO UPDATE Institutional Equity Team Name Designation Email id Contact No. Ajay Kejriwal President ajay@choiceindia.com 022- 6707 9850 Sumeet Bagadia Head of Research sumeet.bagadia@choiceindia.com 022 - 6707 9830 Amit Singh VP - Institutional Sales amit.singh@choiceindia.com 022 - 6707 9852 Devendra Gaikwad Sr. Manager - Institutional Sales devendra.gaikwad@choiceindia.com 022 - 6707 9877 Rajnath Yadav Research Analyst rajnath.yadav@choiceindia.com 022 - 6707 9912 Satish Kumar Research Analyst satish.kumar@choiceindia.com 022 - 6707 9913 Vishal More Research Analyst vishal.more@choiceindia.com 022 - 6707 9916 Kunal Parmar Research Associate kunal.parmar@choiceindia.com 022 - 6707 9982 Amit Pathania Research Associate amit.pathania@choiceindia.com 022 - 6707 9979 Vikas Chaudhari Research Associate vikas.chaudhari@choiceindia.com 022 - 6707 9988 Kapil Shah Research Associate kapil.shah@choiceindia.com 022 - 6707 9976 Rohan Patil Research Associate rohan.patil@choiceindia.com 022 - 6707 9978 Trirashmi Ghoderao Research Advisor trirashmi.ghoderao@choiceindia.com 022 - 6707 9972 Neeraj Yadav Research Advisor neeraj.yadav@choiceindia.com 022 - 6707 9988