SlideShare a Scribd company logo
1 of 7
Download to read offline
FUNDAMENTAL RESEARCHSEBI CERTIFIED – RESEARCH ANALYST
Alkem Laboratories Ltd.
Alkem Laboratories Ltd., the fifth largest pharmaceutical company in
Indian market with global operations, is engaged in the development,
manufacture, and sale of pharmaceutical and neutraceutical products.
Alkem has a total of 16 manufacturing facilities out of which 14
manufacturing facilities at 5 locations locate in India and 2 in the United
States (US). Alkem’s domestic and international operations accounted for
74.7% and 25.3% of total revenue by fiscal year 2015.
Alkem Laboratories Ltd. is coming out with an initial public offering
(IPO) of 12.9 mn equity shares of face value Rs2 each from the
promoter and selling shareholders. The issue is priced at Rs1,020-1,050
per share.
Objects of the Issue
 Company will not receive any funds from the offer for sale.
 OFS will be used for: To achieve the benefits of listing the Equity
Shares on the Stock Exchanges and for the sale of Equity Shares by the
selling shareholders.
Valuation & Recommendation
Alkem Laboratories Ltd. has a market leadership in various therapeutic
areas and ability to build market leading brands in the domestic market.
It has extensive sales, marketing and distribution network in India and
strong research and development capabilities which enhance the
company product portfolio. During FY11-FY15, EBITDA margin of the
company remained in the range of 13-18%, PAT margins at 12-17% and
currently it is growing at CAGR of over 20%. After annualizing the net
profit, FY16 EPS stands at Rs72.1 (post issue). At higher price band of
Rs1,050, Alkem’s shares are available at P/E multiple of 14.6x its
FY16EPS, which is 30% discount to the average PE multiple of around
(P/E 21x) of industry peers. Thus, we recommend investors to
‘Subscribe’ the issue.
1
Dec 05, 2015
Allocation (% of Issue Size)
QIBs 50%
Non-Institutional 15%
Retail 35%
IPO Update
Shareholding pattern
Particulars
Pre-issue
(%)
Post -Issue
(%)
Promoters & Promoters
Group
70.9% 66.2%
Non-Promoters 29.1% 33.8%
Total 100% 100%
Recommendation SUBSCRIBE
Price Band (per share) Rs1,020-Rs1,050
Issue Size Rs13,110.5 -Rs13,496.1 mn
Offer for sale 12.9 mn shares
Bidding Date Dec 08' 2015 - Dec 10' 2015
Face Value Rs2
Market Lot Size 14 shares per lot
Book Running Lead
Manager
Edelweiss Financial Services
Ltd., Axis Capital Ltd., J.P.
Morgan India Pvt. Ltd,
Nomura Fin. Adv. Pvt. Ltd.
Registrar Link Intime India Pvt. Ltd.
Sector Pharmaceuticals
Key Financials (Consolidated)
Particulars (Rs mn) FY11 FY12 FY13 FY14 FY15 H1FY16
Operating Income 16,907 20,156.4 24,952.3 31,260.0 37,887.1 25,701.3
Other Income 1,134.2 1,452.8 1,671.7 1,652.7 1,810.3 888.1
Op. Expenes. 14,042 16,404.3 21,327.8 27,159.5 33,015.9 21,097.2
EBIDTA 2,865.8 3,752.1 3,624.5 4,100.5 4,871.2 4,604.1
EBIDTA Margin 7.6% 18.6% 14.5% 13.1% 12.9% 17.9%
Adjusted PAT 2,957.7 4,058.4 3,836.3 4,353.4 4,625.6 4,312.9
NPM 17.5% 20.2% 15.4% 13.9% 12.2% 16.8%
EPS (Rs) 24.7 34.0 32.1 36.4 38.7 36.1
ROE (%) 20.7% 22.4% 17.7% 16.9% 15.4% 14.4%
Satish Kumar
Research Analyst (022-67069913)
satish.kumar@choiceindia.com
FUNDAMENTAL RESEARCHSEBI CERTIFIED – RESEARCH ANALYST
IPO Update
Indian Pharmaceuticals Industry
Indian pharmaceuticals industry with an estimated size of $36.8 billion is one of the largest industries in India and comprises
companies that are involved in the development, production and marketing of pharmaceutical products. The sector accounts
for about 1.4% of the global pharmaceutical industry in value terms and 10% in volume terms. The country's pharmaceutical
industry is expected to expand at a compounded annual growth rate (CAGR) of 22.4% over 2015-20 to reach $55 billion. With
72% of market share (in terms of revenues), generic drugs forms the largest segment of the Indian pharmaceutical sector.
Growing number of stress related diseases owing to change in lifestyle, industry cost efficiencies and manufacturing hub for
generics drugs are some of the leading factor credited for high growth of the domestic pharma industry. Further, Indian
pharma market is also growing at a significant pace on the back of strong growth drivers such as favorable demographics,
rising health awareness, increasing penetration of health insurance and rising government spending on healthcare
infrastructure. From 2015 to 2017, drugs with estimated total sales of US$43.8 billion are expected go off-patent, leading to a
huge surge in generic products, which would also provide remarkable opportunities to the Indian companies. Structure of
Pharma sector in India is given below ….
Indian pharmaceutical industry is an important contributor to the foreign reserve of the country with around 50% of industry
revenue coming from overseas market. Country wise, the US is major importer of Indian pharma products followed by Russia,
Germany and Austria. Industry exports grew by 16.3% CAGR over the past five years to around $24.6 billion in FY15.
Industry's export is mainly driven by low cost manufacturing, high process chemistry skills, approved manufacturing facilities
and increasing numbers of drug master filings.
Over the past years, pharmaceutical industry have grown inorganically through acquisition, but due to significant demand
drivers, companies have been now focusing more on improving operational efficiencies and also seeking more licenses for
innovators products and newer technologies. However, rising competition and regulatory approvals and compulsory licensing
has become a key concern for the industry, which requires careful considerations by the domestic pharma firms. To sustain
the robust growth for the future and to play major role in global pharma market, Indian pharma companies will have to
adjust regulatory environment, strengthening the supply of low-cost, quality medicines across the world besides capitalizing
growth opportunities provided by the global pharma market.
2
Source: Choice Broking, Company data, RHP
Alkem Laboratories Ltd.
Active Pharmaceuticals
Ingredients/ Bulk drugs
Branded Generics
Formulations
AcuteChronic
Pharmaceuticals
6
37
55
0
10
20
30
40
50
60
2005 2015 E 2020 (P)
Industry Revenue ($ bn)
71%
19%
10%
Market share by Revenue
Generic drugs
OTC Medicines
Patented drugs
FUNDAMENTAL RESEARCHSEBI CERTIFIED – RESEARCH ANALYST
IPO Update
Company Introduction:
Alkem Laboratories Ltd., the fifth largest pharmaceutical company in Indian market with global operations, is engaged in the
development, manufacture, and sale of pharmaceutical and neutraceutical products. The company produces branded
generics, generic drugs, active pharmaceutical ingredients (“APIs”) and Nutraceuticals, which they market in India and 55
countries internationally, primarily the United States (US). Alkem has a total of 16 manufacturing facilities out of which 14
manufacturing facilities at 5 locations locate in India and 2 in the United States. The company 5 of their facilities are USFDA,
TGA and UK-MHRA approved. Of the Indian manufacturing facilities, 12 are for manufacturing formulations and 2 for
manufacturing APIs.
Business Overview:
Alkem’s domestic and international operations accounted for 74.7% and 25.3% of total revenue by fiscal year 2015. Alkem
was the fifth largest pharmaceutical company in India in terms of domestic sales in FY15. The company has the largest
number of brands with five brands ranking among the top 50 brands of the Indian pharmaceutical industry as of fiscal year
2015 in domestic sales. The company’s most significant therapeutic areas in the domestic market are anti-infectives, gastro-
intestinal, pain and analgesics, and vitamins, minerals, and nutrients. These therapeutic areas accounted for 80.7% of total
sales in the domestic market for fiscal year 2015. Company domestic business has grown has grown at a CAGR of 17.6% in the
period from fiscal year 2011 to fiscal year 2015. Alkem is the third 3rd fastest growing company in terms of sales in 2011-
2015 among the 10 largest pharmaceutical companies in the Indian domestic formulations market.
Investment Rationale
1) Market leadership in various therapeutic areas
The established record of strong performance and reputation for quality products in various therapeutic areas has helped
Alkem Laboratories to build reputable brands in the pharmaceutical market in India. The company is a leader in the largest
therapeutic area (anti-infective category) with 11.2% market share and during FY15 it ranks third in terms of market share in
the therapeutic areas of gastro-intestinal (5.6% market share) and pain/analgesics (5.0% market share) in India. Further,
Alkem has the highest number of brands (five) among the top 50 brands (along with another leading pharmaceutical
company) in the Indian pharmaceutical industry and also had 13 brands among the top 300 brands in the Indian
pharmaceutical industry for fiscal year 2015. Alkem’s product selection revolves around their desire to find products, which
will potentially enjoy a large prescriber base. Better response to products helps Alkem to build big brands. Rest of the
business model is aligned to this process, right from an industry-leading distribution network of more than 7,000 stockists
and close to 6,000 medical representatives.
As a result of our strong sales, marketing and distribution capabilities, company’s products are prescribed by an estimated
210,885 prescribers constituting 70.7% of total prescribers. In spite of enhancing reach in domestic region, the company is
also improving sales and distribution infrastructure through focusing more on infrastructure technology. We are of the view
that focused marketing strategies, trained medical representatives and distribution network enable the company to increase
our market share across key therapeutic areas and build and develop brands.
3
Alkem Laboratories Ltd.
Names of Brands Number of Brands Sales Range (Rs mn, FY15)
Clavam, Taxim-O, Taxim 3 Above 1,500
Pan, Pan D 2 1,000 – 1,499
Gemcal, A to Z NS, Sumo, Ondem, Xone 5 500 – 999
Swich, Zocef, Xone-XP, Pipzo, Hemfer, Uprise-D3, Traxol,
Cheri, Enzoflam, Taximax, Indclav, Traxol-S
12 250 – 499
FUNDAMENTAL RESEARCHSEBI CERTIFIED – RESEARCH ANALYST
IPO Update
2) Strong research and development capabilities
Pharmaceuticals business depends to a significant degree on the company ability to successfully conduct research and
development (R&D) with respect to products. Continued focus on R&D helped Alkem to strengthened product offering in
India, the United States and other international markets. Company’s research and development department carries out
process development, formulation development and analytical research for domestic and international markets. R&D
expenses for FY15 stood at 4.5% of revenue and 3.3% of revenue during H1FY16. The company has four research and
development facilities, two in India and two in the United States. As of October 31, 2015, Alkem has employed 480 scientists
working on various drug products and substances in India and the United States. In addition, Alkem has the regulatory affairs
and intellectual property experts, which are responsible for various filings and approvals related to the products and
understanding and filing with respect to intellectual property rights in India and internationally.
3) Taking initiatives to diversify business
Earlier, Alkem focused on building their presence in India market. However over the past few years, Alkem is expanding its
business internationally through organic and inorganic approach. International markets now account for 25% of Alkem
revenue and US business represented around 17% of the company revenue. This has been largely possible due to company’s
efforts to build its presence in the US. As of October 31, 2015, Alkem has filed 69 ANDAs in the United States of which 21
have been approved and 2 have received tentative approvals. Out the 69 ANDAs, 30 were Para IV filings including first-to-files
(“FTFs”). Alkem has also filed 1 New Drug Application (“NDA”) -that has received final approval. The remaining ANDAs are at
various stages of the approval process. As of October 31, 2015, Alkem has filed the following applications in international
markets:
4) International business growing at rapid pace
Having established in the Indian pharmaceuticals market, Alkem has expanded internationally through both organic growth
and certain strategic acquisitions. The United States is the key focus market for their international operations. Alkem market
and sell their products in the United States under the brand “Ascend”. to major pharmacy chains’ stores, wholesalers,
managed care companies, distributors, food and grocery stores and pharmaceutical retailers. In addition to the US, Alkem
sells products in 54 countries, including Australia, Chile, Philippines and Kazakhstan. Revenues from their international
operations have grown at a CAGR of 45.7% during 2011-2015. The contribution of the net revenues from the international
operations has grown from 12.6% of the net revenues from operations in fiscal year 2011 to 25.3% of the net revenues from
operations in fiscal year 2015.
4
Alkem Laboratories Ltd.
Country Filed Approved
US(ANDA) 69
21 (3 tentative
approval)
US (NDA) 1 1
Australia 22 18
Europe 16 7
Philippines (Dossiers for each
strength)
55 51
Chile (Dossiers for each
strength)
110 69
Kazakhstan (Dossiers for each
strength)
66 52
Other Countries 1,166 743
87%
75%
13%
25%
0%
20%
40%
60%
80%
100%
120%
FY11 FY15
Initiatives to diversify into new
markets have yielded positive results
India International
Source: Choice Broking, Company data, RHP
FUNDAMENTAL RESEARCHSEBI CERTIFIED – RESEARCH ANALYST
IPO Update
5) Strong Financial growth : Sales grew at 22.5% CAGR during FY11-FY15 to Rs37,887.1 mn led by strong domestic sales and
increasing international presence. PAT grew to Rs4625.6 mn in FY15 from Rs2,957.7 mn in FY11. Cash flow from operations
increased to Rs 3,282 mn in FY15 from Rs1,479.2 mn in FY11. EBITDA margins contracted from 18.6% in FY12 to 12.9% in
FY15, led by higher cost of raw material and employee cost. Alkem’s revenue grew 36% and NPM jumped to 18% during
1HFY16. The major reason for the jump in revenues is consolidation of financial of the two independent subsidiaries namely
Cachet and Indchemie. Both Cachet and Indchemie operated as Alkem’s sister companies with similar promoter shareholding
as Alkem. As a part of the listing effort, a majority stake (51%) in these entities has been acquired by Alkem. Due to this, their
numbers are now consolidated with Alkem for the first time during 1HFY16.
Risks & Concerns
 Rising competition and investment in Research and Development (R&D)
 Change in policies related to tax, duties or other such levies applicable
 Currency Fluctuation: Volatility in exchange rate can impact the exports business of pharma companies
 EBITDA margins contracted over the last three years
Valuation
Alkem Laboratories Ltd. has a market leadership in various therapeutic areas and ability to build market leading brands in the
domestic market. It has extensive sales, marketing and distribution network in India and strong research and development
capabilities which enhance the company product portfolio. During FY11-FY15, EBITDA margin of the company remained in
the range of 13-18%, PAT margins at 12-17% and currently it is growing at CAGR of 20%. After annualizing the net profit, FY16
EPS stands at Rs72.1 (post issue). At higher price band of Rs1,050, Alkem’s shares are available at P/E multiple of 14.6x its
FY16EPS, which is 30% discount to the average PE multiple of around (P/E 21x) of industry peers. Thus, we recommend
investors to ‘Subscribe’ the issue.
5
Alkem Laboratories Ltd.
0.0
10,000.0
20,000.0
30,000.0
40,000.0
FY11 FY12 FY13 FY14 FY15
Rsmn
Sales grew by 22% CAGR during FY11-FY15
Operating Income EBIDTA Adjusted PAT
Relative Valuation
Companies (Rs mn)
CMP
(Rs)
6M R(%)
12M
R(%)
P/E (x)P/Bv (x)
EBIDTA
Margin (%)
NPM (%)
CAGR Sales
(P4FY)
Net
Worth
Alkem Laboratories Ltd. 1,050 - - - 4.2 12.9% 12.2% 23.4% 29,952.4
Torrent Pharmaceuticals Ltd. 1,489 22.4% 26.1% 19.3 10.2 28.0% 16.1% 20.0% 24,905.6
Alembic Pharmaceuticals Ltd. 680 25.6% 50.4% 25.6 14.5 19.7% 13.7% 12.0% 8,846.4
Glenmark Pharmaceuticals Ltd. 953 12.3% 16.5% 17.4 8.6 29.3% 19.1% 47.6% 30,003.4
Average 1043 20.1% 31.0% 20.8 9.4 22.5% 15.3% 25.7% 23426.9
Particulars Pre Dilution Post Dilution
EPS - 30th Sept 15 36.1 36.1
EPS - Annualised 72.1 72.1
P/E Ratio
At Rs1,020 14.1 14.1
At Rs1,050 14.6 14.6
FUNDAMENTAL RESEARCHSEBI CERTIFIED – RESEARCH ANALYST
IPO Update
6
Profit and Loss Statement
Particulars (Rs mn) FY11 FY12 FY13 FY14 FY15
Operating Income 16,907.9 20,156.4 24,952.3 31,260.0 37,887.1
Other Income 1,134.2 1,452.8 1,671.7 1,652.7 1,810.3
Total Operational Expenditure 14,042.1 16,404.3 21,327.8 27,159.5 33,015.9
Cost of Material Consumed 5,219.5 6,257.2 7,118.5 7,728.3 8,620.3
Changes in Inventories of FG
& WIP
(84.9) (1,144.3) (1,413.8) (502.1) (336.8)
Employee Benefit Expenses 2,670.9 3,034.5 4,122.9 5,315.6 6,374.9
Other Expenses 3,850.2 5,025.1 6,644.9 7,987.0 9,735.2
Purchase of traded goods 2,386.4 3,231.8 4,855.3 6,630.7 8,622.3
EBIDTA 2,865.8 3,752.1 3,624.5 4,100.5 4,871.2
EBIDTA Margin 7.6% 18.6% 14.5% 13.1% 12.9%
Depreciation & Amortization 274.3 290.3 397.9 522.6 703.0
PBIT 2,591.5 3,461.8 3,226.6 3,577.9 4,168.2
Financial Charges 412.3 581.0 882.3 930.8 811.1
Profit before Tax 3,313.4 4,333.6 4,016.0 4,299.8 5,167.4
Tax 355.7 275.2 179.7 (53.6) 541.8
Profit After Tax (PAT) 2,957.7 4,058.4 3,836.3 4,353.4 4,625.6
Less: Exceptional items 0 0 0 0 0
PAT after excep. Items 2,957.7 4,058.4 3,836.3 4,353.4 4,625.6
Add/(Less): Minority interest 1.9 (7.0) (1.9) 0.0 0.0
Adjusted PAT 2,955.8 4,065.4 3,838.2 4,353.4 4,625.6
NPM 17.5% 20.2% 15.4% 13.9% 12.2%
EPS (Rs) 24.7 34.0 32.1 36.4 38.7
Financial Ratios
Particulars FY11 FY12 FY13 FY14 FY15
RoE (%) 20.7% 22.4% 17.7% 16.9% 15.4%
RoCE (%) 15.8% 17.4% 15.1% 15.0% 14.5%
Basic EPS (Rs) 24.7 34.0 32.1 36.4 38.7
BVPS (Rs) 119.5 151.8 181.7 215.8 250.5
Cash EPS (Rs) 14.3 20.6 26.6 30.7 44.1
Inventory days 54.2 69.7 81.0 72.4 75.6
Debtor days 36.9 44.7 46.5 42.8 50.8
Trade payable days 36.2 50.0 42.1 35.7 44.5
119.5 34.2 61.6 23.0 31.9
Total assets turnover 0.6 0.6 0.6 0.7 0.7
Fixed assets turnover 3.5 3.0 2.8 3.2 3.3
Total Debt (Rs mn) 9,093.6 9,819.5 14,690.5 10,774. 11,620.0
D/E 0.6 0.5 0.7 0.4 0.4
Debt/EBIDTA 3.2 2.6 4.1 2.6 2.4
Interest Coverage 6.3 6.0 3.7 3.8 5.1
Alkem Laboratories Ltd.
Cash Flow Statement
Particulars (Rs mn) FY11 FY12 FY13 FY14 FY15
Net cash flow from operating
activities
1,479.2 1,590.5 780.5 2,900.3 3,282.0
Net cash flow from investing
activities
(8,227.9) (2,475.0) (4,035.2) 3,504.4 (2,370.)
Purchase of fixed assets (1,203.2) (2,493.7) (2,348.2) (1,036.0) (1,381.)
Net cash flow from financing
activities
7,788.7 (110.7) 3,556.4 (5,999.5) (517.8)
Net Increase in Cash and Cash
Equivalents
1,040.0 (995.2) 301.7 405.2 394.2
Cash and cash equivalents At
the beginning
199.8 1,239.6 263.5 573.1 1,008.2
Net Increase in Cash and Cash
Equivalents
1,239.8 244.4 565.2 978.3 1,402.4
Effect of exchange rate
changes on cash and bank
balances
0.0 3.4 1.3 19.3 5.6
Cash and cash equivalents At
the end
1,239.6 263.5 573.1 1,008.2 1,396.0
Cash balance as per balance
sheet
1,239.6 263.5 573.1 1,008.2 1,396.0
diff 0.0 0.0 0.0 0.0 0.0
Balance Sheet
Particulars (Rs mn) FY11 FY12 FY13 FY14 FY15
Share Capital 119.6 119.6 119.6 119.6 239.1
Reserves & Surplus 14,160.9 18,024.5 21,597.1 25,673.9 29,713.3
Net Worth 14,280.5 18,144.1 21,716.7 25,793. 29,952.4
Deffered Govt. grant 35.8
Minority Interest 18.2 1.9 856.5
Non-Current Liabilities 4,370.4 5,279.7 3,655.0 3,316.6 2,048.6
Long term borrowings 2,462.6 3,089.7 2,555.9 2,322.5 334.3
Deffered tax liabilities
(net) 228.1 336.6 481.3 441.9 945.6
Other long-term
liabilities 6.7 1.9 123.3 77.8 51.4
Long-term provisions 1,673.0 1,851.5 494.5 474.4 717.3
Current liabilities 9,848.6 11,235.9 17,348.0 14,055. 20,120.0
Short term borrowings 6,631.0 6,729.8 12,134.6 8,452.2 11,285.7
Trade payables 1,676.9 2,760.3 2,875.9 3,057.3 4,619.2
Other current liabilities 903.9 1,118.0 1,874.5 2,042.8 3,370.9
Short term provisions 636.8 627.8 463.0 503.5 844.2
Total Liabilities 28,517.7 34,661.6 42,719.7 43,165. 53,013.3
Fixed Assets 4,885.0 6,741.1 8,963.6 9,796.7 11,429.3
Goodwill on
consolidation 2,042.3 2,450.6 1,757.6 1,903.4 3,421.0
Non current investments 61.0 2,989.1 4,103.3 3,382.4 4,197.6
Long term loans and
advances
1,539.8 2,588.2 3,393.9 4,184.0 5,421.7
Other non current
assests
4,604.1 6,765.3 2,927.2 7,826.8 5,063.0
Deferred tax assets (net) 4.4 11.9 51.1 44.8
Total non current assets 13,132.2 21,538.7 21,157.5 27,144. 29,577.4
Current Assets 15,385.5 13,122.9 21,562.2 16,021. 23,435.9
Current Investments 477.0 237.8 673.1 2,497.7 610.5
Inventories 2,508.7 3,849.2 5,539.6 6,203.3 7,842.3
Trade receivable 1,710.2 2,466.1 3,182.1 3,669.3 5,270.8
Cash and bank balance 9,898.2 5,138.1 9,954.5 2,062.9 7,907.6
Short term loans and
advances 430.1 973.5 1,330.7 1,259.8 1,296.3
Other current assets 361.3 458.2 882.2 328.5 508.4
Total Assets 28,517.7 34,661.6 42,719.7 43,165. 53,013.3
diff 0.0 0.0 0.0 0.0 0.0
FUNDAMENTAL RESEARCHSEBI CERTIFIED – RESEARCH ANALYST 7
INITIATING COVERAGE
Choice Equity Broking Pvt. Ltd.
Choice House, Shree Shakambhari Corporate Park, Plt No: -156-158,
J.B. Nagar, Andheri (East), Mumbai - 400 099.
+91-022-6707 9999
+91-022-6707 9959
www.choiceindia.com
Choice’s Rating Rationale
The price target for a large cap stock represents the value the analyst expects the stock to reach over next 12 months. For a
stock to be classified as Outperform, the expected return must exceed the local risk free return by at least 5% over the next
12 months. For a stock to be classified as Underperform, the stock return must be below the local risk free return by at least
5% over the next 12 months. Stocks between these bands are classified as Neutral.
Disclaimer
This is solely for information of clients of Choice Broking and does not construe to be an investment advice. It is also not intended as an offer or solicitation for
the purchase and sale of any financial instruments. Any action taken by you on the basis of the information contained herein is your responsibility alone and
Choice Broking its subsidiaries or its employees or associates will not be liable in any manner for the consequences of such action taken by you. We have
exercised due diligence in checking the correctness and authenticity of the information contained in this recommendation, but Choice Broking or any of its
subsidiaries or associates or employees shall not be in any way responsible for any loss or damage that may arise to any person from any inadvertent error in
the information contained in this recommendation or any action taken on basis of this information. This report is based on the fundamental analysis with a view
to forecast future price. The Research analysts for this report certifies that all of the views expressed in this report accurately reflect his or her personal views
about the subject company or companies and its or their securities, and no part of his or her compensation was, is or will be, directly or indirectly related to
specific recommendations or views expressed in this report. Choice Broking has based this document on information obtained from sources it believes to be
reliable but which it has not independently verified; Choice Broking makes no guarantee, representation or warranty and accepts no responsibility or liability as
to its accuracy or completeness. The opinions contained within the report are based upon publicly available information at the time of publication and are
subject to change without notice. The information and any disclosures provided herein are in summary form and have been prepared for informational
purposes. The recommendations and suggested price levels are intended purely for stock market investment purposes. The recommendations are valid for the
day of the report and will remain valid till the target period. The information and any disclosures provided herein may be considered confidential. Any use,
distribution, modification, copying, forwarding or disclosure by any person is strictly prohibited. The information and any disclosures provided herein do not
constitute a solicitation or offer to purchase or sell any security or other financial product or instrument. The current performance may be unaudited. Past
performance does not guarantee future returns. There can be no assurance that investments will achieve any targeted rates of return, and there is no guarantee
against the loss of your entire investment.
POTENTIAL CONFLICT OF INTEREST DISCLOSURE (as on date of report) Disclosure of interest statement – • Analyst interest of the stock /Instrument(s): - No. •
Firm interest of the stock / Instrument (s): - No.

More Related Content

What's hot

Competitive Analysis in Pharmaceutical Industry
Competitive Analysis in Pharmaceutical IndustryCompetitive Analysis in Pharmaceutical Industry
Competitive Analysis in Pharmaceutical IndustryYee Jie NG
 
Strategic Analysis of the Indian Pharmaceutical Contract Manufacturing Market...
Strategic Analysis of the Indian Pharmaceutical Contract Manufacturing Market...Strategic Analysis of the Indian Pharmaceutical Contract Manufacturing Market...
Strategic Analysis of the Indian Pharmaceutical Contract Manufacturing Market...Aiswariya Chidambaram
 
Pharmaceutical Industry Financial Analysis
Pharmaceutical Industry Financial AnalysisPharmaceutical Industry Financial Analysis
Pharmaceutical Industry Financial Analysisjpotts89
 
Project on Production and Packaging in Pharmaceutical Industry Emcure By Nikh...
Project on Production and Packaging in Pharmaceutical Industry Emcure By Nikh...Project on Production and Packaging in Pharmaceutical Industry Emcure By Nikh...
Project on Production and Packaging in Pharmaceutical Industry Emcure By Nikh...Nikhil Dhawan
 
Pestle analysis on pharmaceutical industry
Pestle analysis on pharmaceutical industryPestle analysis on pharmaceutical industry
Pestle analysis on pharmaceutical industryArihant Zunjarvad
 
Fundamental analysis of pharma sector
Fundamental analysis of pharma sector Fundamental analysis of pharma sector
Fundamental analysis of pharma sector Rajesh Narayanan
 
Implications for indian_pharmaceuticals
Implications for indian_pharmaceuticalsImplications for indian_pharmaceuticals
Implications for indian_pharmaceuticalsAkshay Bawa
 
Rbsa pharmaceutical industry analysis
Rbsa   pharmaceutical industry analysisRbsa   pharmaceutical industry analysis
Rbsa pharmaceutical industry analysisNachiket Kadu
 
Brief Report on the Indian Pharmaceutical Industry - 2011
Brief Report on the Indian Pharmaceutical Industry - 2011Brief Report on the Indian Pharmaceutical Industry - 2011
Brief Report on the Indian Pharmaceutical Industry - 2011david_singer
 
Export potentiality of pharmaceutical goods in Bangladesh
Export potentiality  of pharmaceutical goods in BangladeshExport potentiality  of pharmaceutical goods in Bangladesh
Export potentiality of pharmaceutical goods in BangladeshSaifur Rahman Samrat
 
Pharma Sector of INDIA
Pharma Sector of INDIAPharma Sector of INDIA
Pharma Sector of INDIAAjay Kumar
 
Mipm report team 3
Mipm report team 3Mipm report team 3
Mipm report team 3BiplovRoy2
 
A Financial Review: Pharmaceuticals Industry
A Financial Review: Pharmaceuticals IndustryA Financial Review: Pharmaceuticals Industry
A Financial Review: Pharmaceuticals IndustryRoby Camagong
 
Mipm report team 3
Mipm report team 3Mipm report team 3
Mipm report team 3BiplovRoy2
 
Indian Pharmaceutical Industry
Indian Pharmaceutical IndustryIndian Pharmaceutical Industry
Indian Pharmaceutical IndustryChandni Sahgal
 
Global Generic Pharmaceutical Market - Qualitative and Quantitative Analysis
Global Generic Pharmaceutical Market - Qualitative and Quantitative AnalysisGlobal Generic Pharmaceutical Market - Qualitative and Quantitative Analysis
Global Generic Pharmaceutical Market - Qualitative and Quantitative AnalysisAiswariya Chidambaram
 

What's hot (20)

Pharmaceuticals Sector Report - December 2018
Pharmaceuticals Sector Report - December 2018Pharmaceuticals Sector Report - December 2018
Pharmaceuticals Sector Report - December 2018
 
Competitive Analysis in Pharmaceutical Industry
Competitive Analysis in Pharmaceutical IndustryCompetitive Analysis in Pharmaceutical Industry
Competitive Analysis in Pharmaceutical Industry
 
Strategic Analysis of the Indian Pharmaceutical Contract Manufacturing Market...
Strategic Analysis of the Indian Pharmaceutical Contract Manufacturing Market...Strategic Analysis of the Indian Pharmaceutical Contract Manufacturing Market...
Strategic Analysis of the Indian Pharmaceutical Contract Manufacturing Market...
 
Pharmaceutical Industry Financial Analysis
Pharmaceutical Industry Financial AnalysisPharmaceutical Industry Financial Analysis
Pharmaceutical Industry Financial Analysis
 
Project on Production and Packaging in Pharmaceutical Industry Emcure By Nikh...
Project on Production and Packaging in Pharmaceutical Industry Emcure By Nikh...Project on Production and Packaging in Pharmaceutical Industry Emcure By Nikh...
Project on Production and Packaging in Pharmaceutical Industry Emcure By Nikh...
 
Beacon May 2015
Beacon May 2015Beacon May 2015
Beacon May 2015
 
Pestle analysis on pharmaceutical industry
Pestle analysis on pharmaceutical industryPestle analysis on pharmaceutical industry
Pestle analysis on pharmaceutical industry
 
Fundamental analysis of pharma sector
Fundamental analysis of pharma sector Fundamental analysis of pharma sector
Fundamental analysis of pharma sector
 
Implications for indian_pharmaceuticals
Implications for indian_pharmaceuticalsImplications for indian_pharmaceuticals
Implications for indian_pharmaceuticals
 
Rbsa pharmaceutical industry analysis
Rbsa   pharmaceutical industry analysisRbsa   pharmaceutical industry analysis
Rbsa pharmaceutical industry analysis
 
India : Pharmaceuticals Sector Report_August 2013
India : Pharmaceuticals Sector Report_August 2013India : Pharmaceuticals Sector Report_August 2013
India : Pharmaceuticals Sector Report_August 2013
 
Brief Report on the Indian Pharmaceutical Industry - 2011
Brief Report on the Indian Pharmaceutical Industry - 2011Brief Report on the Indian Pharmaceutical Industry - 2011
Brief Report on the Indian Pharmaceutical Industry - 2011
 
Pharmaceutical Sectoral Report - October 2016
Pharmaceutical Sectoral Report - October 2016Pharmaceutical Sectoral Report - October 2016
Pharmaceutical Sectoral Report - October 2016
 
Export potentiality of pharmaceutical goods in Bangladesh
Export potentiality  of pharmaceutical goods in BangladeshExport potentiality  of pharmaceutical goods in Bangladesh
Export potentiality of pharmaceutical goods in Bangladesh
 
Pharma Sector of INDIA
Pharma Sector of INDIAPharma Sector of INDIA
Pharma Sector of INDIA
 
Mipm report team 3
Mipm report team 3Mipm report team 3
Mipm report team 3
 
A Financial Review: Pharmaceuticals Industry
A Financial Review: Pharmaceuticals IndustryA Financial Review: Pharmaceuticals Industry
A Financial Review: Pharmaceuticals Industry
 
Mipm report team 3
Mipm report team 3Mipm report team 3
Mipm report team 3
 
Indian Pharmaceutical Industry
Indian Pharmaceutical IndustryIndian Pharmaceutical Industry
Indian Pharmaceutical Industry
 
Global Generic Pharmaceutical Market - Qualitative and Quantitative Analysis
Global Generic Pharmaceutical Market - Qualitative and Quantitative AnalysisGlobal Generic Pharmaceutical Market - Qualitative and Quantitative Analysis
Global Generic Pharmaceutical Market - Qualitative and Quantitative Analysis
 

Viewers also liked

Choice Broking Research-UltraTech Cement.
 Choice Broking Research-UltraTech Cement. Choice Broking Research-UltraTech Cement.
Choice Broking Research-UltraTech Cement.choice broking
 
Morning tea 05-11-2015
Morning tea 05-11-2015Morning tea 05-11-2015
Morning tea 05-11-2015choice broking
 
Idea Cellular Ltd. Q2 FY16 Result First Cut
Idea Cellular Ltd. Q2 FY16 Result First Cut Idea Cellular Ltd. Q2 FY16 Result First Cut
Idea Cellular Ltd. Q2 FY16 Result First Cut choice broking
 
Morning tea 19 01-2016
Morning tea 19 01-2016Morning tea 19 01-2016
Morning tea 19 01-2016choice broking
 
Economic Research Report
Economic Research ReportEconomic Research Report
Economic Research Reportchoice broking
 
Currency high lights 01.06.16
Currency high lights 01.06.16Currency high lights 01.06.16
Currency high lights 01.06.16choice broking
 
Choice Broking Research-Mahindra & Mahindra
Choice Broking Research-Mahindra & MahindraChoice Broking Research-Mahindra & Mahindra
Choice Broking Research-Mahindra & Mahindrachoice broking
 
Morning tea 01 06-2016
Morning tea 01 06-2016Morning tea 01 06-2016
Morning tea 01 06-2016choice broking
 
Healthcare global enterprises ltd. ipo update
Healthcare global enterprises ltd. ipo updateHealthcare global enterprises ltd. ipo update
Healthcare global enterprises ltd. ipo updatechoice broking
 
Morning Tea: ‪AUROPHARMA‬, SRTRANSFIN‬
Morning Tea: ‪AUROPHARMA‬, SRTRANSFIN‬Morning Tea: ‪AUROPHARMA‬, SRTRANSFIN‬
Morning Tea: ‪AUROPHARMA‬, SRTRANSFIN‬choice broking
 
Morning Tea : ‪Sunpharma, KEC‬
Morning Tea : ‪Sunpharma, KEC‬Morning Tea : ‪Sunpharma, KEC‬
Morning Tea : ‪Sunpharma, KEC‬choice broking
 
Currency high lights 04.05.16
Currency high lights 04.05.16Currency high lights 04.05.16
Currency high lights 04.05.16choice broking
 
Commodities Call Tracker Jan'16
Commodities Call Tracker Jan'16Commodities Call Tracker Jan'16
Commodities Call Tracker Jan'16choice broking
 

Viewers also liked (15)

Choice Broking Research-UltraTech Cement.
 Choice Broking Research-UltraTech Cement. Choice Broking Research-UltraTech Cement.
Choice Broking Research-UltraTech Cement.
 
Morning tea 05-11-2015
Morning tea 05-11-2015Morning tea 05-11-2015
Morning tea 05-11-2015
 
Idea Cellular Ltd. Q2 FY16 Result First Cut
Idea Cellular Ltd. Q2 FY16 Result First Cut Idea Cellular Ltd. Q2 FY16 Result First Cut
Idea Cellular Ltd. Q2 FY16 Result First Cut
 
Aaj ka trend 01.06.16
Aaj ka trend 01.06.16Aaj ka trend 01.06.16
Aaj ka trend 01.06.16
 
Morning tea 19 01-2016
Morning tea 19 01-2016Morning tea 19 01-2016
Morning tea 19 01-2016
 
Economic Research Report
Economic Research ReportEconomic Research Report
Economic Research Report
 
Currency high lights 01.06.16
Currency high lights 01.06.16Currency high lights 01.06.16
Currency high lights 01.06.16
 
Choice Broking Research-Mahindra & Mahindra
Choice Broking Research-Mahindra & MahindraChoice Broking Research-Mahindra & Mahindra
Choice Broking Research-Mahindra & Mahindra
 
2016 ke sultan
2016 ke sultan2016 ke sultan
2016 ke sultan
 
Morning tea 01 06-2016
Morning tea 01 06-2016Morning tea 01 06-2016
Morning tea 01 06-2016
 
Healthcare global enterprises ltd. ipo update
Healthcare global enterprises ltd. ipo updateHealthcare global enterprises ltd. ipo update
Healthcare global enterprises ltd. ipo update
 
Morning Tea: ‪AUROPHARMA‬, SRTRANSFIN‬
Morning Tea: ‪AUROPHARMA‬, SRTRANSFIN‬Morning Tea: ‪AUROPHARMA‬, SRTRANSFIN‬
Morning Tea: ‪AUROPHARMA‬, SRTRANSFIN‬
 
Morning Tea : ‪Sunpharma, KEC‬
Morning Tea : ‪Sunpharma, KEC‬Morning Tea : ‪Sunpharma, KEC‬
Morning Tea : ‪Sunpharma, KEC‬
 
Currency high lights 04.05.16
Currency high lights 04.05.16Currency high lights 04.05.16
Currency high lights 04.05.16
 
Commodities Call Tracker Jan'16
Commodities Call Tracker Jan'16Commodities Call Tracker Jan'16
Commodities Call Tracker Jan'16
 

Similar to Alkem Laboratories Ltd. IPO Analysis and Recommendation (38 characters

Aarti Drugs Ltd (NSE Code - AARTIDRUGS) - Feb'14 Katalyst Wealth Alpha Recomm...
Aarti Drugs Ltd (NSE Code - AARTIDRUGS) - Feb'14 Katalyst Wealth Alpha Recomm...Aarti Drugs Ltd (NSE Code - AARTIDRUGS) - Feb'14 Katalyst Wealth Alpha Recomm...
Aarti Drugs Ltd (NSE Code - AARTIDRUGS) - Feb'14 Katalyst Wealth Alpha Recomm...Katalyst Wealth
 
Overview of the Pharma industry
Overview of the Pharma industryOverview of the Pharma industry
Overview of the Pharma industrykeyursavalia
 
Aarti Drugs Ltd - Sep'18 Katalyst Wealth Alpha Report
Aarti Drugs Ltd - Sep'18 Katalyst Wealth Alpha Report Aarti Drugs Ltd - Sep'18 Katalyst Wealth Alpha Report
Aarti Drugs Ltd - Sep'18 Katalyst Wealth Alpha Report Katalyst Wealth
 
Performance analysis of working capital management of “pharmaceuticals industry”
Performance analysis of working capital management of “pharmaceuticals industry”Performance analysis of working capital management of “pharmaceuticals industry”
Performance analysis of working capital management of “pharmaceuticals industry”Fayshal Hossan Miazy
 
Pharmaceutical industry in india
Pharmaceutical industry in indiaPharmaceutical industry in india
Pharmaceutical industry in indiaSahil Khanna
 
PROBLEMS AND PROSPECTS PHARMA PRODUCT SELLING..
PROBLEMS AND PROSPECTS PHARMA PRODUCT SELLING..PROBLEMS AND PROSPECTS PHARMA PRODUCT SELLING..
PROBLEMS AND PROSPECTS PHARMA PRODUCT SELLING..Subrata Ghosh
 
Overview on pharmaceutical industry
Overview on pharmaceutical industryOverview on pharmaceutical industry
Overview on pharmaceutical industryMitesh Shah
 
Indian Pharmaceutical Export Market - Top Export Destinations for Indian Phar...
Indian Pharmaceutical Export Market - Top Export Destinations for Indian Phar...Indian Pharmaceutical Export Market - Top Export Destinations for Indian Phar...
Indian Pharmaceutical Export Market - Top Export Destinations for Indian Phar...Irish Pereira
 
WealthZap Research Services-Cadila Heathcare Ltd MultiBagger Recommendation f...
WealthZap Research Services-Cadila Heathcare Ltd MultiBagger Recommendation f...WealthZap Research Services-Cadila Heathcare Ltd MultiBagger Recommendation f...
WealthZap Research Services-Cadila Heathcare Ltd MultiBagger Recommendation f...Saurabh
 
Indias pharma supply chain
Indias pharma supply chainIndias pharma supply chain
Indias pharma supply chainTanmay Gupta
 
IPCA Laboratories ltd (NSE Code IPCALAB) - Nov'12 Katalyst Wealth Alpha recom...
IPCA Laboratories ltd (NSE Code IPCALAB) - Nov'12 Katalyst Wealth Alpha recom...IPCA Laboratories ltd (NSE Code IPCALAB) - Nov'12 Katalyst Wealth Alpha recom...
IPCA Laboratories ltd (NSE Code IPCALAB) - Nov'12 Katalyst Wealth Alpha recom...Katalyst Wealth
 
Stock of the week sunpharma
Stock of the week   sunpharmaStock of the week   sunpharma
Stock of the week sunpharmastockquint
 
Project on lupin pharmaceutical(3) (1)
Project on lupin pharmaceutical(3) (1)Project on lupin pharmaceutical(3) (1)
Project on lupin pharmaceutical(3) (1)Alkesh Parihar
 
Study On Pharmaceuticals Companies
Study On Pharmaceuticals CompaniesStudy On Pharmaceuticals Companies
Study On Pharmaceuticals CompaniesVarsha Chauhan
 
Pharmaceutical Industry in India
Pharmaceutical Industry in IndiaPharmaceutical Industry in India
Pharmaceutical Industry in IndiaMufaddal Nullwala
 
report on orchid pharma
report on orchid pharmareport on orchid pharma
report on orchid pharmaKarthik Varma
 
Pharmaceutical industry-in-india
Pharmaceutical industry-in-indiaPharmaceutical industry-in-india
Pharmaceutical industry-in-indiaChandresh M
 

Similar to Alkem Laboratories Ltd. IPO Analysis and Recommendation (38 characters (20)

Aarti Drugs Ltd (NSE Code - AARTIDRUGS) - Feb'14 Katalyst Wealth Alpha Recomm...
Aarti Drugs Ltd (NSE Code - AARTIDRUGS) - Feb'14 Katalyst Wealth Alpha Recomm...Aarti Drugs Ltd (NSE Code - AARTIDRUGS) - Feb'14 Katalyst Wealth Alpha Recomm...
Aarti Drugs Ltd (NSE Code - AARTIDRUGS) - Feb'14 Katalyst Wealth Alpha Recomm...
 
Overview of the Pharma industry
Overview of the Pharma industryOverview of the Pharma industry
Overview of the Pharma industry
 
Aarti Drugs Ltd - Sep'18 Katalyst Wealth Alpha Report
Aarti Drugs Ltd - Sep'18 Katalyst Wealth Alpha Report Aarti Drugs Ltd - Sep'18 Katalyst Wealth Alpha Report
Aarti Drugs Ltd - Sep'18 Katalyst Wealth Alpha Report
 
winter project
winter projectwinter project
winter project
 
Performance analysis of working capital management of “pharmaceuticals industry”
Performance analysis of working capital management of “pharmaceuticals industry”Performance analysis of working capital management of “pharmaceuticals industry”
Performance analysis of working capital management of “pharmaceuticals industry”
 
Pharmaceutical industry in india
Pharmaceutical industry in indiaPharmaceutical industry in india
Pharmaceutical industry in india
 
PROBLEMS AND PROSPECTS PHARMA PRODUCT SELLING..
PROBLEMS AND PROSPECTS PHARMA PRODUCT SELLING..PROBLEMS AND PROSPECTS PHARMA PRODUCT SELLING..
PROBLEMS AND PROSPECTS PHARMA PRODUCT SELLING..
 
Overview on pharmaceutical industry
Overview on pharmaceutical industryOverview on pharmaceutical industry
Overview on pharmaceutical industry
 
Indian Pharmaceutical Export Market - Top Export Destinations for Indian Phar...
Indian Pharmaceutical Export Market - Top Export Destinations for Indian Phar...Indian Pharmaceutical Export Market - Top Export Destinations for Indian Phar...
Indian Pharmaceutical Export Market - Top Export Destinations for Indian Phar...
 
WealthZap Research Services-Cadila Heathcare Ltd MultiBagger Recommendation f...
WealthZap Research Services-Cadila Heathcare Ltd MultiBagger Recommendation f...WealthZap Research Services-Cadila Heathcare Ltd MultiBagger Recommendation f...
WealthZap Research Services-Cadila Heathcare Ltd MultiBagger Recommendation f...
 
Indias pharma supply chain
Indias pharma supply chainIndias pharma supply chain
Indias pharma supply chain
 
IPCA Laboratories ltd (NSE Code IPCALAB) - Nov'12 Katalyst Wealth Alpha recom...
IPCA Laboratories ltd (NSE Code IPCALAB) - Nov'12 Katalyst Wealth Alpha recom...IPCA Laboratories ltd (NSE Code IPCALAB) - Nov'12 Katalyst Wealth Alpha recom...
IPCA Laboratories ltd (NSE Code IPCALAB) - Nov'12 Katalyst Wealth Alpha recom...
 
Stock of the week sunpharma
Stock of the week   sunpharmaStock of the week   sunpharma
Stock of the week sunpharma
 
Project on lupin pharmaceutical(3) (1)
Project on lupin pharmaceutical(3) (1)Project on lupin pharmaceutical(3) (1)
Project on lupin pharmaceutical(3) (1)
 
Indian Pharma Industry
Indian Pharma IndustryIndian Pharma Industry
Indian Pharma Industry
 
ATS Company Reports: Unichem lab
ATS Company Reports: Unichem labATS Company Reports: Unichem lab
ATS Company Reports: Unichem lab
 
Study On Pharmaceuticals Companies
Study On Pharmaceuticals CompaniesStudy On Pharmaceuticals Companies
Study On Pharmaceuticals Companies
 
Pharmaceutical Industry in India
Pharmaceutical Industry in IndiaPharmaceutical Industry in India
Pharmaceutical Industry in India
 
report on orchid pharma
report on orchid pharmareport on orchid pharma
report on orchid pharma
 
Pharmaceutical industry-in-india
Pharmaceutical industry-in-indiaPharmaceutical industry-in-india
Pharmaceutical industry-in-india
 

Recently uploaded

chapter_2.ppt The labour market definitions and trends
chapter_2.ppt The labour market definitions and trendschapter_2.ppt The labour market definitions and trends
chapter_2.ppt The labour market definitions and trendslemlemtesfaye192
 
Chapter 2.ppt of macroeconomics by mankiw 9th edition
Chapter 2.ppt of macroeconomics by mankiw 9th editionChapter 2.ppt of macroeconomics by mankiw 9th edition
Chapter 2.ppt of macroeconomics by mankiw 9th editionMuhammadHusnain82237
 
Q3 2024 Earnings Conference Call and Webcast Slides
Q3 2024 Earnings Conference Call and Webcast SlidesQ3 2024 Earnings Conference Call and Webcast Slides
Q3 2024 Earnings Conference Call and Webcast SlidesMarketing847413
 
How Automation is Driving Efficiency Through the Last Mile of Reporting
How Automation is Driving Efficiency Through the Last Mile of ReportingHow Automation is Driving Efficiency Through the Last Mile of Reporting
How Automation is Driving Efficiency Through the Last Mile of ReportingAggregage
 
BPPG response - Options for Defined Benefit schemes - 19Apr24.pdf
BPPG response - Options for Defined Benefit schemes - 19Apr24.pdfBPPG response - Options for Defined Benefit schemes - 19Apr24.pdf
BPPG response - Options for Defined Benefit schemes - 19Apr24.pdfHenry Tapper
 
Mulki Call Girls 7001305949 WhatsApp Number 24x7 Best Services
Mulki Call Girls 7001305949 WhatsApp Number 24x7 Best ServicesMulki Call Girls 7001305949 WhatsApp Number 24x7 Best Services
Mulki Call Girls 7001305949 WhatsApp Number 24x7 Best Servicesnajka9823
 
Call Girls In Yusuf Sarai Women Seeking Men 9654467111
Call Girls In Yusuf Sarai Women Seeking Men 9654467111Call Girls In Yusuf Sarai Women Seeking Men 9654467111
Call Girls In Yusuf Sarai Women Seeking Men 9654467111Sapana Sha
 
letter-from-the-chair-to-the-fca-relating-to-british-steel-pensions-scheme-15...
letter-from-the-chair-to-the-fca-relating-to-british-steel-pensions-scheme-15...letter-from-the-chair-to-the-fca-relating-to-british-steel-pensions-scheme-15...
letter-from-the-chair-to-the-fca-relating-to-british-steel-pensions-scheme-15...Henry Tapper
 
Classical Theory of Macroeconomics by Adam Smith
Classical Theory of Macroeconomics by Adam SmithClassical Theory of Macroeconomics by Adam Smith
Classical Theory of Macroeconomics by Adam SmithAdamYassin2
 
Authentic No 1 Amil Baba In Pakistan Authentic No 1 Amil Baba In Karachi No 1...
Authentic No 1 Amil Baba In Pakistan Authentic No 1 Amil Baba In Karachi No 1...Authentic No 1 Amil Baba In Pakistan Authentic No 1 Amil Baba In Karachi No 1...
Authentic No 1 Amil Baba In Pakistan Authentic No 1 Amil Baba In Karachi No 1...First NO1 World Amil baba in Faisalabad
 
(办理学位证)加拿大萨省大学毕业证成绩单原版一比一
(办理学位证)加拿大萨省大学毕业证成绩单原版一比一(办理学位证)加拿大萨省大学毕业证成绩单原版一比一
(办理学位证)加拿大萨省大学毕业证成绩单原版一比一S SDS
 
AfRESFullPaper22018EmpiricalPerformanceofRealEstateInvestmentTrustsandShareho...
AfRESFullPaper22018EmpiricalPerformanceofRealEstateInvestmentTrustsandShareho...AfRESFullPaper22018EmpiricalPerformanceofRealEstateInvestmentTrustsandShareho...
AfRESFullPaper22018EmpiricalPerformanceofRealEstateInvestmentTrustsandShareho...yordanosyohannes2
 
原版1:1复刻温哥华岛大学毕业证Vancouver毕业证留信学历认证
原版1:1复刻温哥华岛大学毕业证Vancouver毕业证留信学历认证原版1:1复刻温哥华岛大学毕业证Vancouver毕业证留信学历认证
原版1:1复刻温哥华岛大学毕业证Vancouver毕业证留信学历认证rjrjkk
 
Andheri Call Girls In 9825968104 Mumbai Hot Models
Andheri Call Girls In 9825968104 Mumbai Hot ModelsAndheri Call Girls In 9825968104 Mumbai Hot Models
Andheri Call Girls In 9825968104 Mumbai Hot Modelshematsharma006
 
Financial Leverage Definition, Advantages, and Disadvantages
Financial Leverage Definition, Advantages, and DisadvantagesFinancial Leverage Definition, Advantages, and Disadvantages
Financial Leverage Definition, Advantages, and Disadvantagesjayjaymabutot13
 
fca-bsps-decision-letter-redacted (1).pdf
fca-bsps-decision-letter-redacted (1).pdffca-bsps-decision-letter-redacted (1).pdf
fca-bsps-decision-letter-redacted (1).pdfHenry Tapper
 
call girls in Nand Nagri (DELHI) 🔝 >༒9953330565🔝 genuine Escort Service 🔝✔️✔️
call girls in  Nand Nagri (DELHI) 🔝 >༒9953330565🔝 genuine Escort Service 🔝✔️✔️call girls in  Nand Nagri (DELHI) 🔝 >༒9953330565🔝 genuine Escort Service 🔝✔️✔️
call girls in Nand Nagri (DELHI) 🔝 >༒9953330565🔝 genuine Escort Service 🔝✔️✔️9953056974 Low Rate Call Girls In Saket, Delhi NCR
 
NO1 WorldWide Love marriage specialist baba ji Amil Baba Kala ilam powerful v...
NO1 WorldWide Love marriage specialist baba ji Amil Baba Kala ilam powerful v...NO1 WorldWide Love marriage specialist baba ji Amil Baba Kala ilam powerful v...
NO1 WorldWide Love marriage specialist baba ji Amil Baba Kala ilam powerful v...Amil baba
 
VIP Kolkata Call Girl Jodhpur Park 👉 8250192130 Available With Room
VIP Kolkata Call Girl Jodhpur Park 👉 8250192130  Available With RoomVIP Kolkata Call Girl Jodhpur Park 👉 8250192130  Available With Room
VIP Kolkata Call Girl Jodhpur Park 👉 8250192130 Available With Roomdivyansh0kumar0
 

Recently uploaded (20)

chapter_2.ppt The labour market definitions and trends
chapter_2.ppt The labour market definitions and trendschapter_2.ppt The labour market definitions and trends
chapter_2.ppt The labour market definitions and trends
 
Chapter 2.ppt of macroeconomics by mankiw 9th edition
Chapter 2.ppt of macroeconomics by mankiw 9th editionChapter 2.ppt of macroeconomics by mankiw 9th edition
Chapter 2.ppt of macroeconomics by mankiw 9th edition
 
Q3 2024 Earnings Conference Call and Webcast Slides
Q3 2024 Earnings Conference Call and Webcast SlidesQ3 2024 Earnings Conference Call and Webcast Slides
Q3 2024 Earnings Conference Call and Webcast Slides
 
Monthly Economic Monitoring of Ukraine No 231, April 2024
Monthly Economic Monitoring of Ukraine No 231, April 2024Monthly Economic Monitoring of Ukraine No 231, April 2024
Monthly Economic Monitoring of Ukraine No 231, April 2024
 
How Automation is Driving Efficiency Through the Last Mile of Reporting
How Automation is Driving Efficiency Through the Last Mile of ReportingHow Automation is Driving Efficiency Through the Last Mile of Reporting
How Automation is Driving Efficiency Through the Last Mile of Reporting
 
BPPG response - Options for Defined Benefit schemes - 19Apr24.pdf
BPPG response - Options for Defined Benefit schemes - 19Apr24.pdfBPPG response - Options for Defined Benefit schemes - 19Apr24.pdf
BPPG response - Options for Defined Benefit schemes - 19Apr24.pdf
 
Mulki Call Girls 7001305949 WhatsApp Number 24x7 Best Services
Mulki Call Girls 7001305949 WhatsApp Number 24x7 Best ServicesMulki Call Girls 7001305949 WhatsApp Number 24x7 Best Services
Mulki Call Girls 7001305949 WhatsApp Number 24x7 Best Services
 
Call Girls In Yusuf Sarai Women Seeking Men 9654467111
Call Girls In Yusuf Sarai Women Seeking Men 9654467111Call Girls In Yusuf Sarai Women Seeking Men 9654467111
Call Girls In Yusuf Sarai Women Seeking Men 9654467111
 
letter-from-the-chair-to-the-fca-relating-to-british-steel-pensions-scheme-15...
letter-from-the-chair-to-the-fca-relating-to-british-steel-pensions-scheme-15...letter-from-the-chair-to-the-fca-relating-to-british-steel-pensions-scheme-15...
letter-from-the-chair-to-the-fca-relating-to-british-steel-pensions-scheme-15...
 
Classical Theory of Macroeconomics by Adam Smith
Classical Theory of Macroeconomics by Adam SmithClassical Theory of Macroeconomics by Adam Smith
Classical Theory of Macroeconomics by Adam Smith
 
Authentic No 1 Amil Baba In Pakistan Authentic No 1 Amil Baba In Karachi No 1...
Authentic No 1 Amil Baba In Pakistan Authentic No 1 Amil Baba In Karachi No 1...Authentic No 1 Amil Baba In Pakistan Authentic No 1 Amil Baba In Karachi No 1...
Authentic No 1 Amil Baba In Pakistan Authentic No 1 Amil Baba In Karachi No 1...
 
(办理学位证)加拿大萨省大学毕业证成绩单原版一比一
(办理学位证)加拿大萨省大学毕业证成绩单原版一比一(办理学位证)加拿大萨省大学毕业证成绩单原版一比一
(办理学位证)加拿大萨省大学毕业证成绩单原版一比一
 
AfRESFullPaper22018EmpiricalPerformanceofRealEstateInvestmentTrustsandShareho...
AfRESFullPaper22018EmpiricalPerformanceofRealEstateInvestmentTrustsandShareho...AfRESFullPaper22018EmpiricalPerformanceofRealEstateInvestmentTrustsandShareho...
AfRESFullPaper22018EmpiricalPerformanceofRealEstateInvestmentTrustsandShareho...
 
原版1:1复刻温哥华岛大学毕业证Vancouver毕业证留信学历认证
原版1:1复刻温哥华岛大学毕业证Vancouver毕业证留信学历认证原版1:1复刻温哥华岛大学毕业证Vancouver毕业证留信学历认证
原版1:1复刻温哥华岛大学毕业证Vancouver毕业证留信学历认证
 
Andheri Call Girls In 9825968104 Mumbai Hot Models
Andheri Call Girls In 9825968104 Mumbai Hot ModelsAndheri Call Girls In 9825968104 Mumbai Hot Models
Andheri Call Girls In 9825968104 Mumbai Hot Models
 
Financial Leverage Definition, Advantages, and Disadvantages
Financial Leverage Definition, Advantages, and DisadvantagesFinancial Leverage Definition, Advantages, and Disadvantages
Financial Leverage Definition, Advantages, and Disadvantages
 
fca-bsps-decision-letter-redacted (1).pdf
fca-bsps-decision-letter-redacted (1).pdffca-bsps-decision-letter-redacted (1).pdf
fca-bsps-decision-letter-redacted (1).pdf
 
call girls in Nand Nagri (DELHI) 🔝 >༒9953330565🔝 genuine Escort Service 🔝✔️✔️
call girls in  Nand Nagri (DELHI) 🔝 >༒9953330565🔝 genuine Escort Service 🔝✔️✔️call girls in  Nand Nagri (DELHI) 🔝 >༒9953330565🔝 genuine Escort Service 🔝✔️✔️
call girls in Nand Nagri (DELHI) 🔝 >༒9953330565🔝 genuine Escort Service 🔝✔️✔️
 
NO1 WorldWide Love marriage specialist baba ji Amil Baba Kala ilam powerful v...
NO1 WorldWide Love marriage specialist baba ji Amil Baba Kala ilam powerful v...NO1 WorldWide Love marriage specialist baba ji Amil Baba Kala ilam powerful v...
NO1 WorldWide Love marriage specialist baba ji Amil Baba Kala ilam powerful v...
 
VIP Kolkata Call Girl Jodhpur Park 👉 8250192130 Available With Room
VIP Kolkata Call Girl Jodhpur Park 👉 8250192130  Available With RoomVIP Kolkata Call Girl Jodhpur Park 👉 8250192130  Available With Room
VIP Kolkata Call Girl Jodhpur Park 👉 8250192130 Available With Room
 

Alkem Laboratories Ltd. IPO Analysis and Recommendation (38 characters

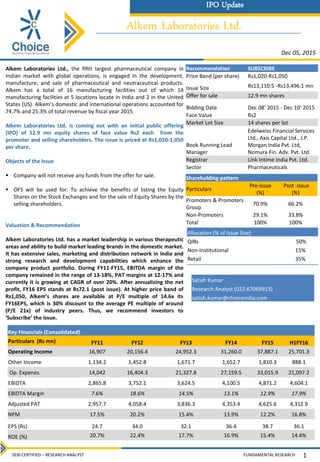
  • 1. FUNDAMENTAL RESEARCHSEBI CERTIFIED – RESEARCH ANALYST Alkem Laboratories Ltd. Alkem Laboratories Ltd., the fifth largest pharmaceutical company in Indian market with global operations, is engaged in the development, manufacture, and sale of pharmaceutical and neutraceutical products. Alkem has a total of 16 manufacturing facilities out of which 14 manufacturing facilities at 5 locations locate in India and 2 in the United States (US). Alkem’s domestic and international operations accounted for 74.7% and 25.3% of total revenue by fiscal year 2015. Alkem Laboratories Ltd. is coming out with an initial public offering (IPO) of 12.9 mn equity shares of face value Rs2 each from the promoter and selling shareholders. The issue is priced at Rs1,020-1,050 per share. Objects of the Issue  Company will not receive any funds from the offer for sale.  OFS will be used for: To achieve the benefits of listing the Equity Shares on the Stock Exchanges and for the sale of Equity Shares by the selling shareholders. Valuation & Recommendation Alkem Laboratories Ltd. has a market leadership in various therapeutic areas and ability to build market leading brands in the domestic market. It has extensive sales, marketing and distribution network in India and strong research and development capabilities which enhance the company product portfolio. During FY11-FY15, EBITDA margin of the company remained in the range of 13-18%, PAT margins at 12-17% and currently it is growing at CAGR of over 20%. After annualizing the net profit, FY16 EPS stands at Rs72.1 (post issue). At higher price band of Rs1,050, Alkem’s shares are available at P/E multiple of 14.6x its FY16EPS, which is 30% discount to the average PE multiple of around (P/E 21x) of industry peers. Thus, we recommend investors to ‘Subscribe’ the issue. 1 Dec 05, 2015 Allocation (% of Issue Size) QIBs 50% Non-Institutional 15% Retail 35% IPO Update Shareholding pattern Particulars Pre-issue (%) Post -Issue (%) Promoters & Promoters Group 70.9% 66.2% Non-Promoters 29.1% 33.8% Total 100% 100% Recommendation SUBSCRIBE Price Band (per share) Rs1,020-Rs1,050 Issue Size Rs13,110.5 -Rs13,496.1 mn Offer for sale 12.9 mn shares Bidding Date Dec 08' 2015 - Dec 10' 2015 Face Value Rs2 Market Lot Size 14 shares per lot Book Running Lead Manager Edelweiss Financial Services Ltd., Axis Capital Ltd., J.P. Morgan India Pvt. Ltd, Nomura Fin. Adv. Pvt. Ltd. Registrar Link Intime India Pvt. Ltd. Sector Pharmaceuticals Key Financials (Consolidated) Particulars (Rs mn) FY11 FY12 FY13 FY14 FY15 H1FY16 Operating Income 16,907 20,156.4 24,952.3 31,260.0 37,887.1 25,701.3 Other Income 1,134.2 1,452.8 1,671.7 1,652.7 1,810.3 888.1 Op. Expenes. 14,042 16,404.3 21,327.8 27,159.5 33,015.9 21,097.2 EBIDTA 2,865.8 3,752.1 3,624.5 4,100.5 4,871.2 4,604.1 EBIDTA Margin 7.6% 18.6% 14.5% 13.1% 12.9% 17.9% Adjusted PAT 2,957.7 4,058.4 3,836.3 4,353.4 4,625.6 4,312.9 NPM 17.5% 20.2% 15.4% 13.9% 12.2% 16.8% EPS (Rs) 24.7 34.0 32.1 36.4 38.7 36.1 ROE (%) 20.7% 22.4% 17.7% 16.9% 15.4% 14.4% Satish Kumar Research Analyst (022-67069913) satish.kumar@choiceindia.com
  • 2. FUNDAMENTAL RESEARCHSEBI CERTIFIED – RESEARCH ANALYST IPO Update Indian Pharmaceuticals Industry Indian pharmaceuticals industry with an estimated size of $36.8 billion is one of the largest industries in India and comprises companies that are involved in the development, production and marketing of pharmaceutical products. The sector accounts for about 1.4% of the global pharmaceutical industry in value terms and 10% in volume terms. The country's pharmaceutical industry is expected to expand at a compounded annual growth rate (CAGR) of 22.4% over 2015-20 to reach $55 billion. With 72% of market share (in terms of revenues), generic drugs forms the largest segment of the Indian pharmaceutical sector. Growing number of stress related diseases owing to change in lifestyle, industry cost efficiencies and manufacturing hub for generics drugs are some of the leading factor credited for high growth of the domestic pharma industry. Further, Indian pharma market is also growing at a significant pace on the back of strong growth drivers such as favorable demographics, rising health awareness, increasing penetration of health insurance and rising government spending on healthcare infrastructure. From 2015 to 2017, drugs with estimated total sales of US$43.8 billion are expected go off-patent, leading to a huge surge in generic products, which would also provide remarkable opportunities to the Indian companies. Structure of Pharma sector in India is given below …. Indian pharmaceutical industry is an important contributor to the foreign reserve of the country with around 50% of industry revenue coming from overseas market. Country wise, the US is major importer of Indian pharma products followed by Russia, Germany and Austria. Industry exports grew by 16.3% CAGR over the past five years to around $24.6 billion in FY15. Industry's export is mainly driven by low cost manufacturing, high process chemistry skills, approved manufacturing facilities and increasing numbers of drug master filings. Over the past years, pharmaceutical industry have grown inorganically through acquisition, but due to significant demand drivers, companies have been now focusing more on improving operational efficiencies and also seeking more licenses for innovators products and newer technologies. However, rising competition and regulatory approvals and compulsory licensing has become a key concern for the industry, which requires careful considerations by the domestic pharma firms. To sustain the robust growth for the future and to play major role in global pharma market, Indian pharma companies will have to adjust regulatory environment, strengthening the supply of low-cost, quality medicines across the world besides capitalizing growth opportunities provided by the global pharma market. 2 Source: Choice Broking, Company data, RHP Alkem Laboratories Ltd. Active Pharmaceuticals Ingredients/ Bulk drugs Branded Generics Formulations AcuteChronic Pharmaceuticals 6 37 55 0 10 20 30 40 50 60 2005 2015 E 2020 (P) Industry Revenue ($ bn) 71% 19% 10% Market share by Revenue Generic drugs OTC Medicines Patented drugs
  • 3. FUNDAMENTAL RESEARCHSEBI CERTIFIED – RESEARCH ANALYST IPO Update Company Introduction: Alkem Laboratories Ltd., the fifth largest pharmaceutical company in Indian market with global operations, is engaged in the development, manufacture, and sale of pharmaceutical and neutraceutical products. The company produces branded generics, generic drugs, active pharmaceutical ingredients (“APIs”) and Nutraceuticals, which they market in India and 55 countries internationally, primarily the United States (US). Alkem has a total of 16 manufacturing facilities out of which 14 manufacturing facilities at 5 locations locate in India and 2 in the United States. The company 5 of their facilities are USFDA, TGA and UK-MHRA approved. Of the Indian manufacturing facilities, 12 are for manufacturing formulations and 2 for manufacturing APIs. Business Overview: Alkem’s domestic and international operations accounted for 74.7% and 25.3% of total revenue by fiscal year 2015. Alkem was the fifth largest pharmaceutical company in India in terms of domestic sales in FY15. The company has the largest number of brands with five brands ranking among the top 50 brands of the Indian pharmaceutical industry as of fiscal year 2015 in domestic sales. The company’s most significant therapeutic areas in the domestic market are anti-infectives, gastro- intestinal, pain and analgesics, and vitamins, minerals, and nutrients. These therapeutic areas accounted for 80.7% of total sales in the domestic market for fiscal year 2015. Company domestic business has grown has grown at a CAGR of 17.6% in the period from fiscal year 2011 to fiscal year 2015. Alkem is the third 3rd fastest growing company in terms of sales in 2011- 2015 among the 10 largest pharmaceutical companies in the Indian domestic formulations market. Investment Rationale 1) Market leadership in various therapeutic areas The established record of strong performance and reputation for quality products in various therapeutic areas has helped Alkem Laboratories to build reputable brands in the pharmaceutical market in India. The company is a leader in the largest therapeutic area (anti-infective category) with 11.2% market share and during FY15 it ranks third in terms of market share in the therapeutic areas of gastro-intestinal (5.6% market share) and pain/analgesics (5.0% market share) in India. Further, Alkem has the highest number of brands (five) among the top 50 brands (along with another leading pharmaceutical company) in the Indian pharmaceutical industry and also had 13 brands among the top 300 brands in the Indian pharmaceutical industry for fiscal year 2015. Alkem’s product selection revolves around their desire to find products, which will potentially enjoy a large prescriber base. Better response to products helps Alkem to build big brands. Rest of the business model is aligned to this process, right from an industry-leading distribution network of more than 7,000 stockists and close to 6,000 medical representatives. As a result of our strong sales, marketing and distribution capabilities, company’s products are prescribed by an estimated 210,885 prescribers constituting 70.7% of total prescribers. In spite of enhancing reach in domestic region, the company is also improving sales and distribution infrastructure through focusing more on infrastructure technology. We are of the view that focused marketing strategies, trained medical representatives and distribution network enable the company to increase our market share across key therapeutic areas and build and develop brands. 3 Alkem Laboratories Ltd. Names of Brands Number of Brands Sales Range (Rs mn, FY15) Clavam, Taxim-O, Taxim 3 Above 1,500 Pan, Pan D 2 1,000 – 1,499 Gemcal, A to Z NS, Sumo, Ondem, Xone 5 500 – 999 Swich, Zocef, Xone-XP, Pipzo, Hemfer, Uprise-D3, Traxol, Cheri, Enzoflam, Taximax, Indclav, Traxol-S 12 250 – 499
  • 4. FUNDAMENTAL RESEARCHSEBI CERTIFIED – RESEARCH ANALYST IPO Update 2) Strong research and development capabilities Pharmaceuticals business depends to a significant degree on the company ability to successfully conduct research and development (R&D) with respect to products. Continued focus on R&D helped Alkem to strengthened product offering in India, the United States and other international markets. Company’s research and development department carries out process development, formulation development and analytical research for domestic and international markets. R&D expenses for FY15 stood at 4.5% of revenue and 3.3% of revenue during H1FY16. The company has four research and development facilities, two in India and two in the United States. As of October 31, 2015, Alkem has employed 480 scientists working on various drug products and substances in India and the United States. In addition, Alkem has the regulatory affairs and intellectual property experts, which are responsible for various filings and approvals related to the products and understanding and filing with respect to intellectual property rights in India and internationally. 3) Taking initiatives to diversify business Earlier, Alkem focused on building their presence in India market. However over the past few years, Alkem is expanding its business internationally through organic and inorganic approach. International markets now account for 25% of Alkem revenue and US business represented around 17% of the company revenue. This has been largely possible due to company’s efforts to build its presence in the US. As of October 31, 2015, Alkem has filed 69 ANDAs in the United States of which 21 have been approved and 2 have received tentative approvals. Out the 69 ANDAs, 30 were Para IV filings including first-to-files (“FTFs”). Alkem has also filed 1 New Drug Application (“NDA”) -that has received final approval. The remaining ANDAs are at various stages of the approval process. As of October 31, 2015, Alkem has filed the following applications in international markets: 4) International business growing at rapid pace Having established in the Indian pharmaceuticals market, Alkem has expanded internationally through both organic growth and certain strategic acquisitions. The United States is the key focus market for their international operations. Alkem market and sell their products in the United States under the brand “Ascend”. to major pharmacy chains’ stores, wholesalers, managed care companies, distributors, food and grocery stores and pharmaceutical retailers. In addition to the US, Alkem sells products in 54 countries, including Australia, Chile, Philippines and Kazakhstan. Revenues from their international operations have grown at a CAGR of 45.7% during 2011-2015. The contribution of the net revenues from the international operations has grown from 12.6% of the net revenues from operations in fiscal year 2011 to 25.3% of the net revenues from operations in fiscal year 2015. 4 Alkem Laboratories Ltd. Country Filed Approved US(ANDA) 69 21 (3 tentative approval) US (NDA) 1 1 Australia 22 18 Europe 16 7 Philippines (Dossiers for each strength) 55 51 Chile (Dossiers for each strength) 110 69 Kazakhstan (Dossiers for each strength) 66 52 Other Countries 1,166 743 87% 75% 13% 25% 0% 20% 40% 60% 80% 100% 120% FY11 FY15 Initiatives to diversify into new markets have yielded positive results India International Source: Choice Broking, Company data, RHP
  • 5. FUNDAMENTAL RESEARCHSEBI CERTIFIED – RESEARCH ANALYST IPO Update 5) Strong Financial growth : Sales grew at 22.5% CAGR during FY11-FY15 to Rs37,887.1 mn led by strong domestic sales and increasing international presence. PAT grew to Rs4625.6 mn in FY15 from Rs2,957.7 mn in FY11. Cash flow from operations increased to Rs 3,282 mn in FY15 from Rs1,479.2 mn in FY11. EBITDA margins contracted from 18.6% in FY12 to 12.9% in FY15, led by higher cost of raw material and employee cost. Alkem’s revenue grew 36% and NPM jumped to 18% during 1HFY16. The major reason for the jump in revenues is consolidation of financial of the two independent subsidiaries namely Cachet and Indchemie. Both Cachet and Indchemie operated as Alkem’s sister companies with similar promoter shareholding as Alkem. As a part of the listing effort, a majority stake (51%) in these entities has been acquired by Alkem. Due to this, their numbers are now consolidated with Alkem for the first time during 1HFY16. Risks & Concerns  Rising competition and investment in Research and Development (R&D)  Change in policies related to tax, duties or other such levies applicable  Currency Fluctuation: Volatility in exchange rate can impact the exports business of pharma companies  EBITDA margins contracted over the last three years Valuation Alkem Laboratories Ltd. has a market leadership in various therapeutic areas and ability to build market leading brands in the domestic market. It has extensive sales, marketing and distribution network in India and strong research and development capabilities which enhance the company product portfolio. During FY11-FY15, EBITDA margin of the company remained in the range of 13-18%, PAT margins at 12-17% and currently it is growing at CAGR of 20%. After annualizing the net profit, FY16 EPS stands at Rs72.1 (post issue). At higher price band of Rs1,050, Alkem’s shares are available at P/E multiple of 14.6x its FY16EPS, which is 30% discount to the average PE multiple of around (P/E 21x) of industry peers. Thus, we recommend investors to ‘Subscribe’ the issue. 5 Alkem Laboratories Ltd. 0.0 10,000.0 20,000.0 30,000.0 40,000.0 FY11 FY12 FY13 FY14 FY15 Rsmn Sales grew by 22% CAGR during FY11-FY15 Operating Income EBIDTA Adjusted PAT Relative Valuation Companies (Rs mn) CMP (Rs) 6M R(%) 12M R(%) P/E (x)P/Bv (x) EBIDTA Margin (%) NPM (%) CAGR Sales (P4FY) Net Worth Alkem Laboratories Ltd. 1,050 - - - 4.2 12.9% 12.2% 23.4% 29,952.4 Torrent Pharmaceuticals Ltd. 1,489 22.4% 26.1% 19.3 10.2 28.0% 16.1% 20.0% 24,905.6 Alembic Pharmaceuticals Ltd. 680 25.6% 50.4% 25.6 14.5 19.7% 13.7% 12.0% 8,846.4 Glenmark Pharmaceuticals Ltd. 953 12.3% 16.5% 17.4 8.6 29.3% 19.1% 47.6% 30,003.4 Average 1043 20.1% 31.0% 20.8 9.4 22.5% 15.3% 25.7% 23426.9 Particulars Pre Dilution Post Dilution EPS - 30th Sept 15 36.1 36.1 EPS - Annualised 72.1 72.1 P/E Ratio At Rs1,020 14.1 14.1 At Rs1,050 14.6 14.6
  • 6. FUNDAMENTAL RESEARCHSEBI CERTIFIED – RESEARCH ANALYST IPO Update 6 Profit and Loss Statement Particulars (Rs mn) FY11 FY12 FY13 FY14 FY15 Operating Income 16,907.9 20,156.4 24,952.3 31,260.0 37,887.1 Other Income 1,134.2 1,452.8 1,671.7 1,652.7 1,810.3 Total Operational Expenditure 14,042.1 16,404.3 21,327.8 27,159.5 33,015.9 Cost of Material Consumed 5,219.5 6,257.2 7,118.5 7,728.3 8,620.3 Changes in Inventories of FG & WIP (84.9) (1,144.3) (1,413.8) (502.1) (336.8) Employee Benefit Expenses 2,670.9 3,034.5 4,122.9 5,315.6 6,374.9 Other Expenses 3,850.2 5,025.1 6,644.9 7,987.0 9,735.2 Purchase of traded goods 2,386.4 3,231.8 4,855.3 6,630.7 8,622.3 EBIDTA 2,865.8 3,752.1 3,624.5 4,100.5 4,871.2 EBIDTA Margin 7.6% 18.6% 14.5% 13.1% 12.9% Depreciation & Amortization 274.3 290.3 397.9 522.6 703.0 PBIT 2,591.5 3,461.8 3,226.6 3,577.9 4,168.2 Financial Charges 412.3 581.0 882.3 930.8 811.1 Profit before Tax 3,313.4 4,333.6 4,016.0 4,299.8 5,167.4 Tax 355.7 275.2 179.7 (53.6) 541.8 Profit After Tax (PAT) 2,957.7 4,058.4 3,836.3 4,353.4 4,625.6 Less: Exceptional items 0 0 0 0 0 PAT after excep. Items 2,957.7 4,058.4 3,836.3 4,353.4 4,625.6 Add/(Less): Minority interest 1.9 (7.0) (1.9) 0.0 0.0 Adjusted PAT 2,955.8 4,065.4 3,838.2 4,353.4 4,625.6 NPM 17.5% 20.2% 15.4% 13.9% 12.2% EPS (Rs) 24.7 34.0 32.1 36.4 38.7 Financial Ratios Particulars FY11 FY12 FY13 FY14 FY15 RoE (%) 20.7% 22.4% 17.7% 16.9% 15.4% RoCE (%) 15.8% 17.4% 15.1% 15.0% 14.5% Basic EPS (Rs) 24.7 34.0 32.1 36.4 38.7 BVPS (Rs) 119.5 151.8 181.7 215.8 250.5 Cash EPS (Rs) 14.3 20.6 26.6 30.7 44.1 Inventory days 54.2 69.7 81.0 72.4 75.6 Debtor days 36.9 44.7 46.5 42.8 50.8 Trade payable days 36.2 50.0 42.1 35.7 44.5 119.5 34.2 61.6 23.0 31.9 Total assets turnover 0.6 0.6 0.6 0.7 0.7 Fixed assets turnover 3.5 3.0 2.8 3.2 3.3 Total Debt (Rs mn) 9,093.6 9,819.5 14,690.5 10,774. 11,620.0 D/E 0.6 0.5 0.7 0.4 0.4 Debt/EBIDTA 3.2 2.6 4.1 2.6 2.4 Interest Coverage 6.3 6.0 3.7 3.8 5.1 Alkem Laboratories Ltd. Cash Flow Statement Particulars (Rs mn) FY11 FY12 FY13 FY14 FY15 Net cash flow from operating activities 1,479.2 1,590.5 780.5 2,900.3 3,282.0 Net cash flow from investing activities (8,227.9) (2,475.0) (4,035.2) 3,504.4 (2,370.) Purchase of fixed assets (1,203.2) (2,493.7) (2,348.2) (1,036.0) (1,381.) Net cash flow from financing activities 7,788.7 (110.7) 3,556.4 (5,999.5) (517.8) Net Increase in Cash and Cash Equivalents 1,040.0 (995.2) 301.7 405.2 394.2 Cash and cash equivalents At the beginning 199.8 1,239.6 263.5 573.1 1,008.2 Net Increase in Cash and Cash Equivalents 1,239.8 244.4 565.2 978.3 1,402.4 Effect of exchange rate changes on cash and bank balances 0.0 3.4 1.3 19.3 5.6 Cash and cash equivalents At the end 1,239.6 263.5 573.1 1,008.2 1,396.0 Cash balance as per balance sheet 1,239.6 263.5 573.1 1,008.2 1,396.0 diff 0.0 0.0 0.0 0.0 0.0 Balance Sheet Particulars (Rs mn) FY11 FY12 FY13 FY14 FY15 Share Capital 119.6 119.6 119.6 119.6 239.1 Reserves & Surplus 14,160.9 18,024.5 21,597.1 25,673.9 29,713.3 Net Worth 14,280.5 18,144.1 21,716.7 25,793. 29,952.4 Deffered Govt. grant 35.8 Minority Interest 18.2 1.9 856.5 Non-Current Liabilities 4,370.4 5,279.7 3,655.0 3,316.6 2,048.6 Long term borrowings 2,462.6 3,089.7 2,555.9 2,322.5 334.3 Deffered tax liabilities (net) 228.1 336.6 481.3 441.9 945.6 Other long-term liabilities 6.7 1.9 123.3 77.8 51.4 Long-term provisions 1,673.0 1,851.5 494.5 474.4 717.3 Current liabilities 9,848.6 11,235.9 17,348.0 14,055. 20,120.0 Short term borrowings 6,631.0 6,729.8 12,134.6 8,452.2 11,285.7 Trade payables 1,676.9 2,760.3 2,875.9 3,057.3 4,619.2 Other current liabilities 903.9 1,118.0 1,874.5 2,042.8 3,370.9 Short term provisions 636.8 627.8 463.0 503.5 844.2 Total Liabilities 28,517.7 34,661.6 42,719.7 43,165. 53,013.3 Fixed Assets 4,885.0 6,741.1 8,963.6 9,796.7 11,429.3 Goodwill on consolidation 2,042.3 2,450.6 1,757.6 1,903.4 3,421.0 Non current investments 61.0 2,989.1 4,103.3 3,382.4 4,197.6 Long term loans and advances 1,539.8 2,588.2 3,393.9 4,184.0 5,421.7 Other non current assests 4,604.1 6,765.3 2,927.2 7,826.8 5,063.0 Deferred tax assets (net) 4.4 11.9 51.1 44.8 Total non current assets 13,132.2 21,538.7 21,157.5 27,144. 29,577.4 Current Assets 15,385.5 13,122.9 21,562.2 16,021. 23,435.9 Current Investments 477.0 237.8 673.1 2,497.7 610.5 Inventories 2,508.7 3,849.2 5,539.6 6,203.3 7,842.3 Trade receivable 1,710.2 2,466.1 3,182.1 3,669.3 5,270.8 Cash and bank balance 9,898.2 5,138.1 9,954.5 2,062.9 7,907.6 Short term loans and advances 430.1 973.5 1,330.7 1,259.8 1,296.3 Other current assets 361.3 458.2 882.2 328.5 508.4 Total Assets 28,517.7 34,661.6 42,719.7 43,165. 53,013.3 diff 0.0 0.0 0.0 0.0 0.0
  • 7. FUNDAMENTAL RESEARCHSEBI CERTIFIED – RESEARCH ANALYST 7 INITIATING COVERAGE Choice Equity Broking Pvt. Ltd. Choice House, Shree Shakambhari Corporate Park, Plt No: -156-158, J.B. Nagar, Andheri (East), Mumbai - 400 099. +91-022-6707 9999 +91-022-6707 9959 www.choiceindia.com Choice’s Rating Rationale The price target for a large cap stock represents the value the analyst expects the stock to reach over next 12 months. For a stock to be classified as Outperform, the expected return must exceed the local risk free return by at least 5% over the next 12 months. For a stock to be classified as Underperform, the stock return must be below the local risk free return by at least 5% over the next 12 months. Stocks between these bands are classified as Neutral. Disclaimer This is solely for information of clients of Choice Broking and does not construe to be an investment advice. It is also not intended as an offer or solicitation for the purchase and sale of any financial instruments. Any action taken by you on the basis of the information contained herein is your responsibility alone and Choice Broking its subsidiaries or its employees or associates will not be liable in any manner for the consequences of such action taken by you. We have exercised due diligence in checking the correctness and authenticity of the information contained in this recommendation, but Choice Broking or any of its subsidiaries or associates or employees shall not be in any way responsible for any loss or damage that may arise to any person from any inadvertent error in the information contained in this recommendation or any action taken on basis of this information. This report is based on the fundamental analysis with a view to forecast future price. The Research analysts for this report certifies that all of the views expressed in this report accurately reflect his or her personal views about the subject company or companies and its or their securities, and no part of his or her compensation was, is or will be, directly or indirectly related to specific recommendations or views expressed in this report. Choice Broking has based this document on information obtained from sources it believes to be reliable but which it has not independently verified; Choice Broking makes no guarantee, representation or warranty and accepts no responsibility or liability as to its accuracy or completeness. The opinions contained within the report are based upon publicly available information at the time of publication and are subject to change without notice. The information and any disclosures provided herein are in summary form and have been prepared for informational purposes. The recommendations and suggested price levels are intended purely for stock market investment purposes. The recommendations are valid for the day of the report and will remain valid till the target period. The information and any disclosures provided herein may be considered confidential. Any use, distribution, modification, copying, forwarding or disclosure by any person is strictly prohibited. The information and any disclosures provided herein do not constitute a solicitation or offer to purchase or sell any security or other financial product or instrument. The current performance may be unaudited. Past performance does not guarantee future returns. There can be no assurance that investments will achieve any targeted rates of return, and there is no guarantee against the loss of your entire investment. POTENTIAL CONFLICT OF INTEREST DISCLOSURE (as on date of report) Disclosure of interest statement – • Analyst interest of the stock /Instrument(s): - No. • Firm interest of the stock / Instrument (s): - No.