Downloaded 122 times


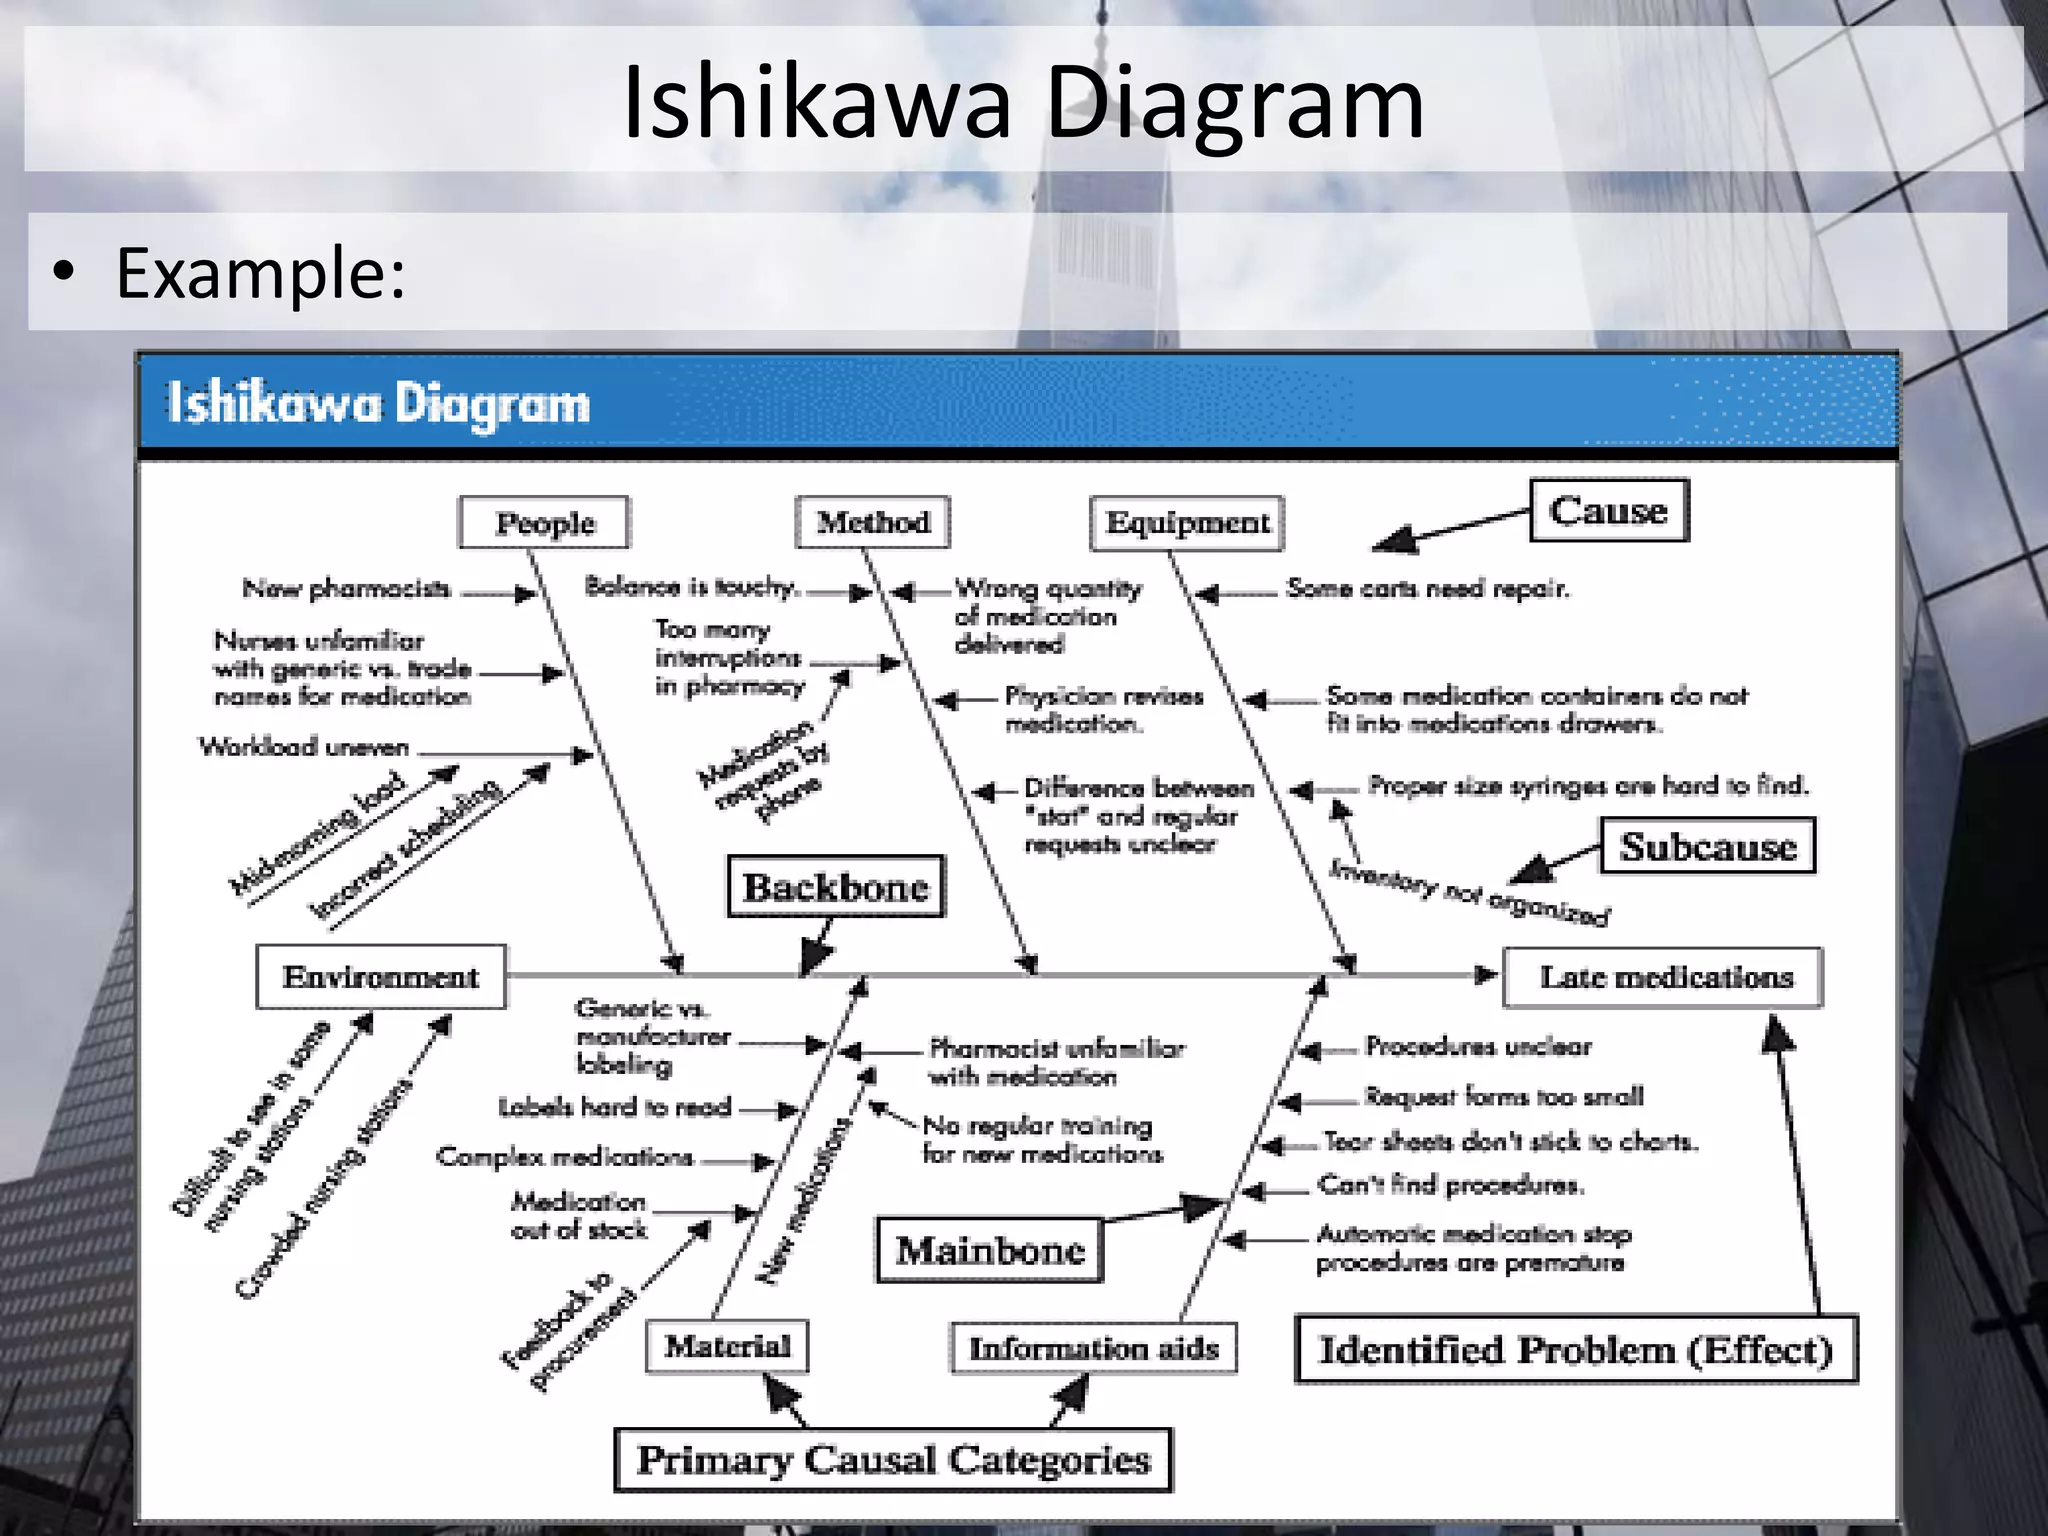
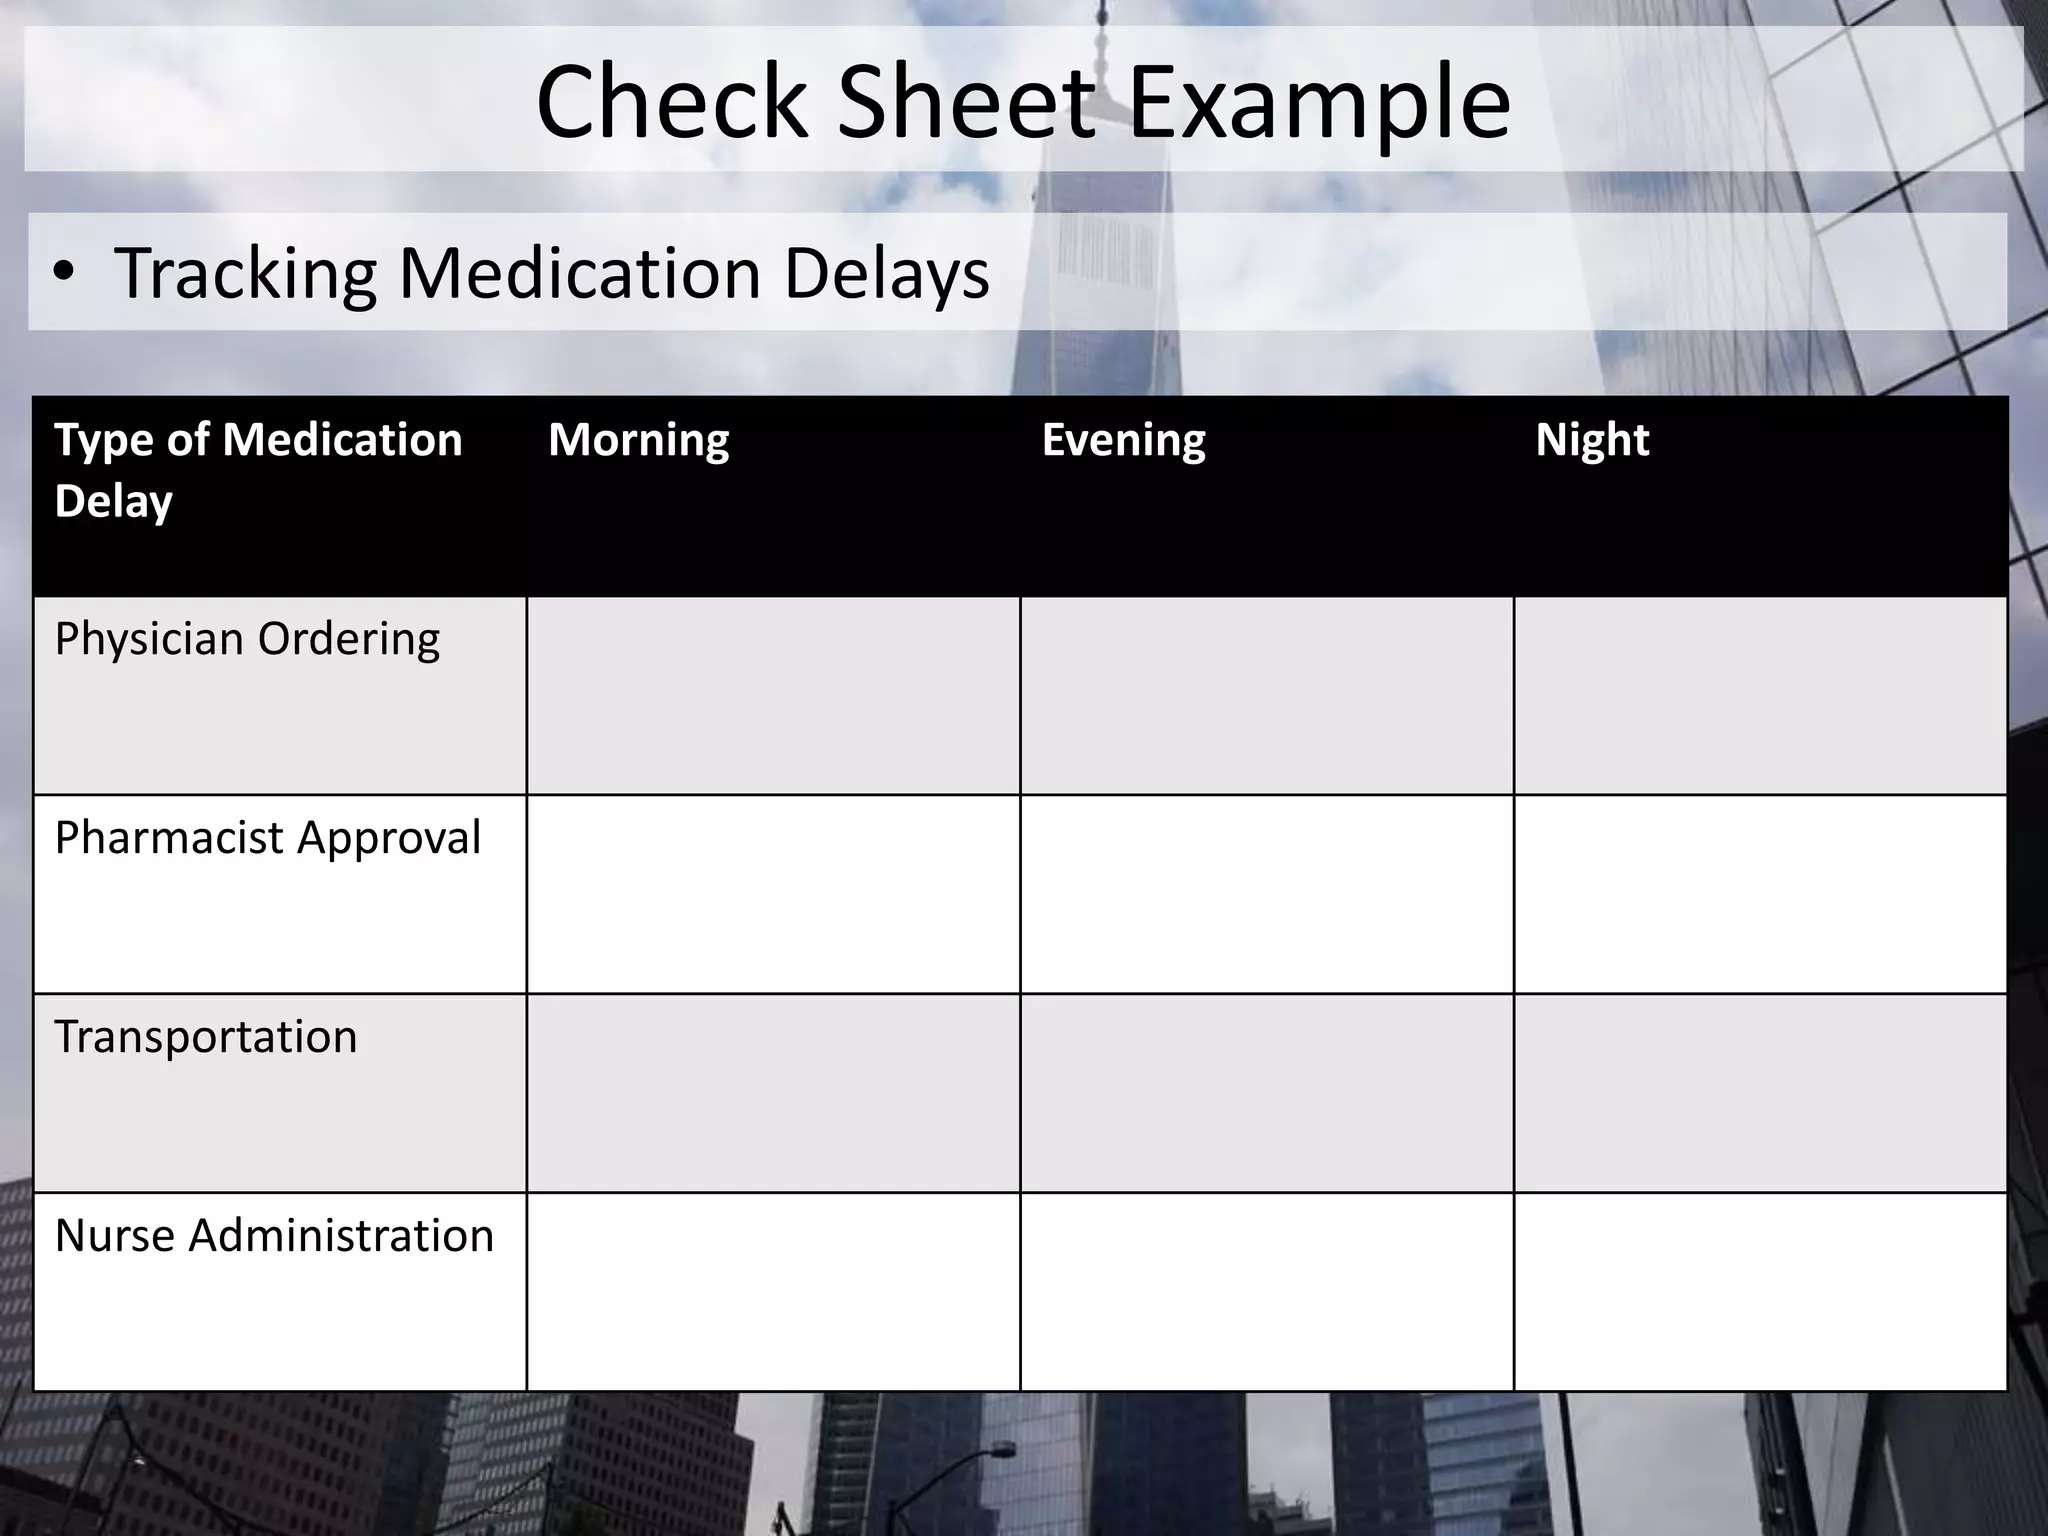
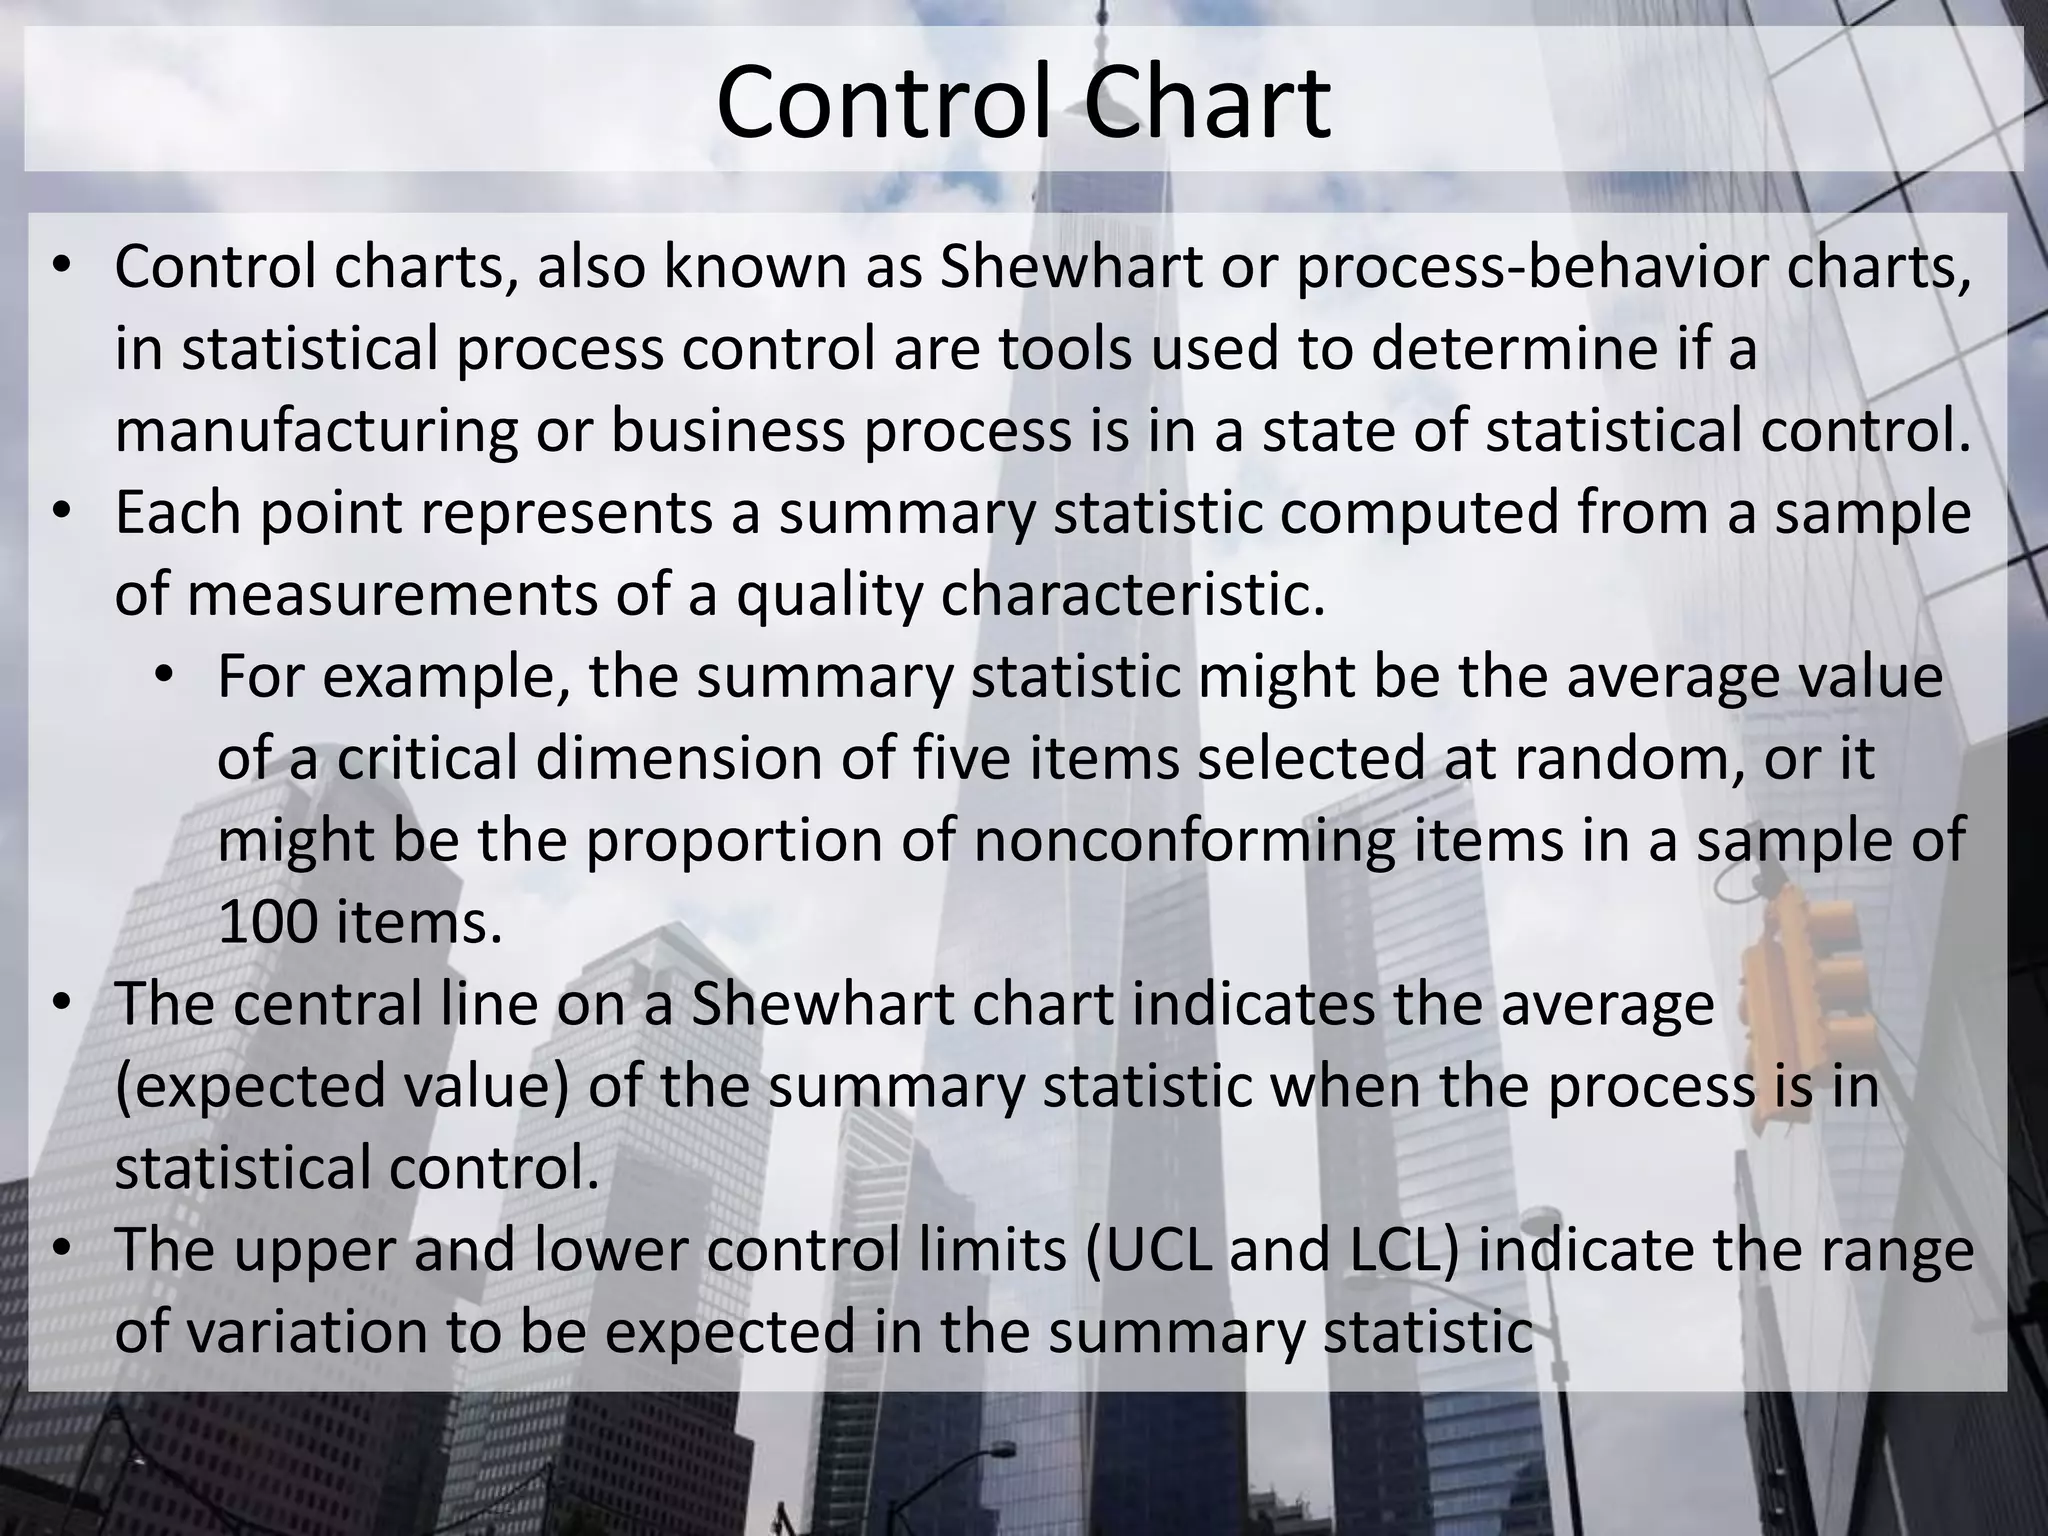
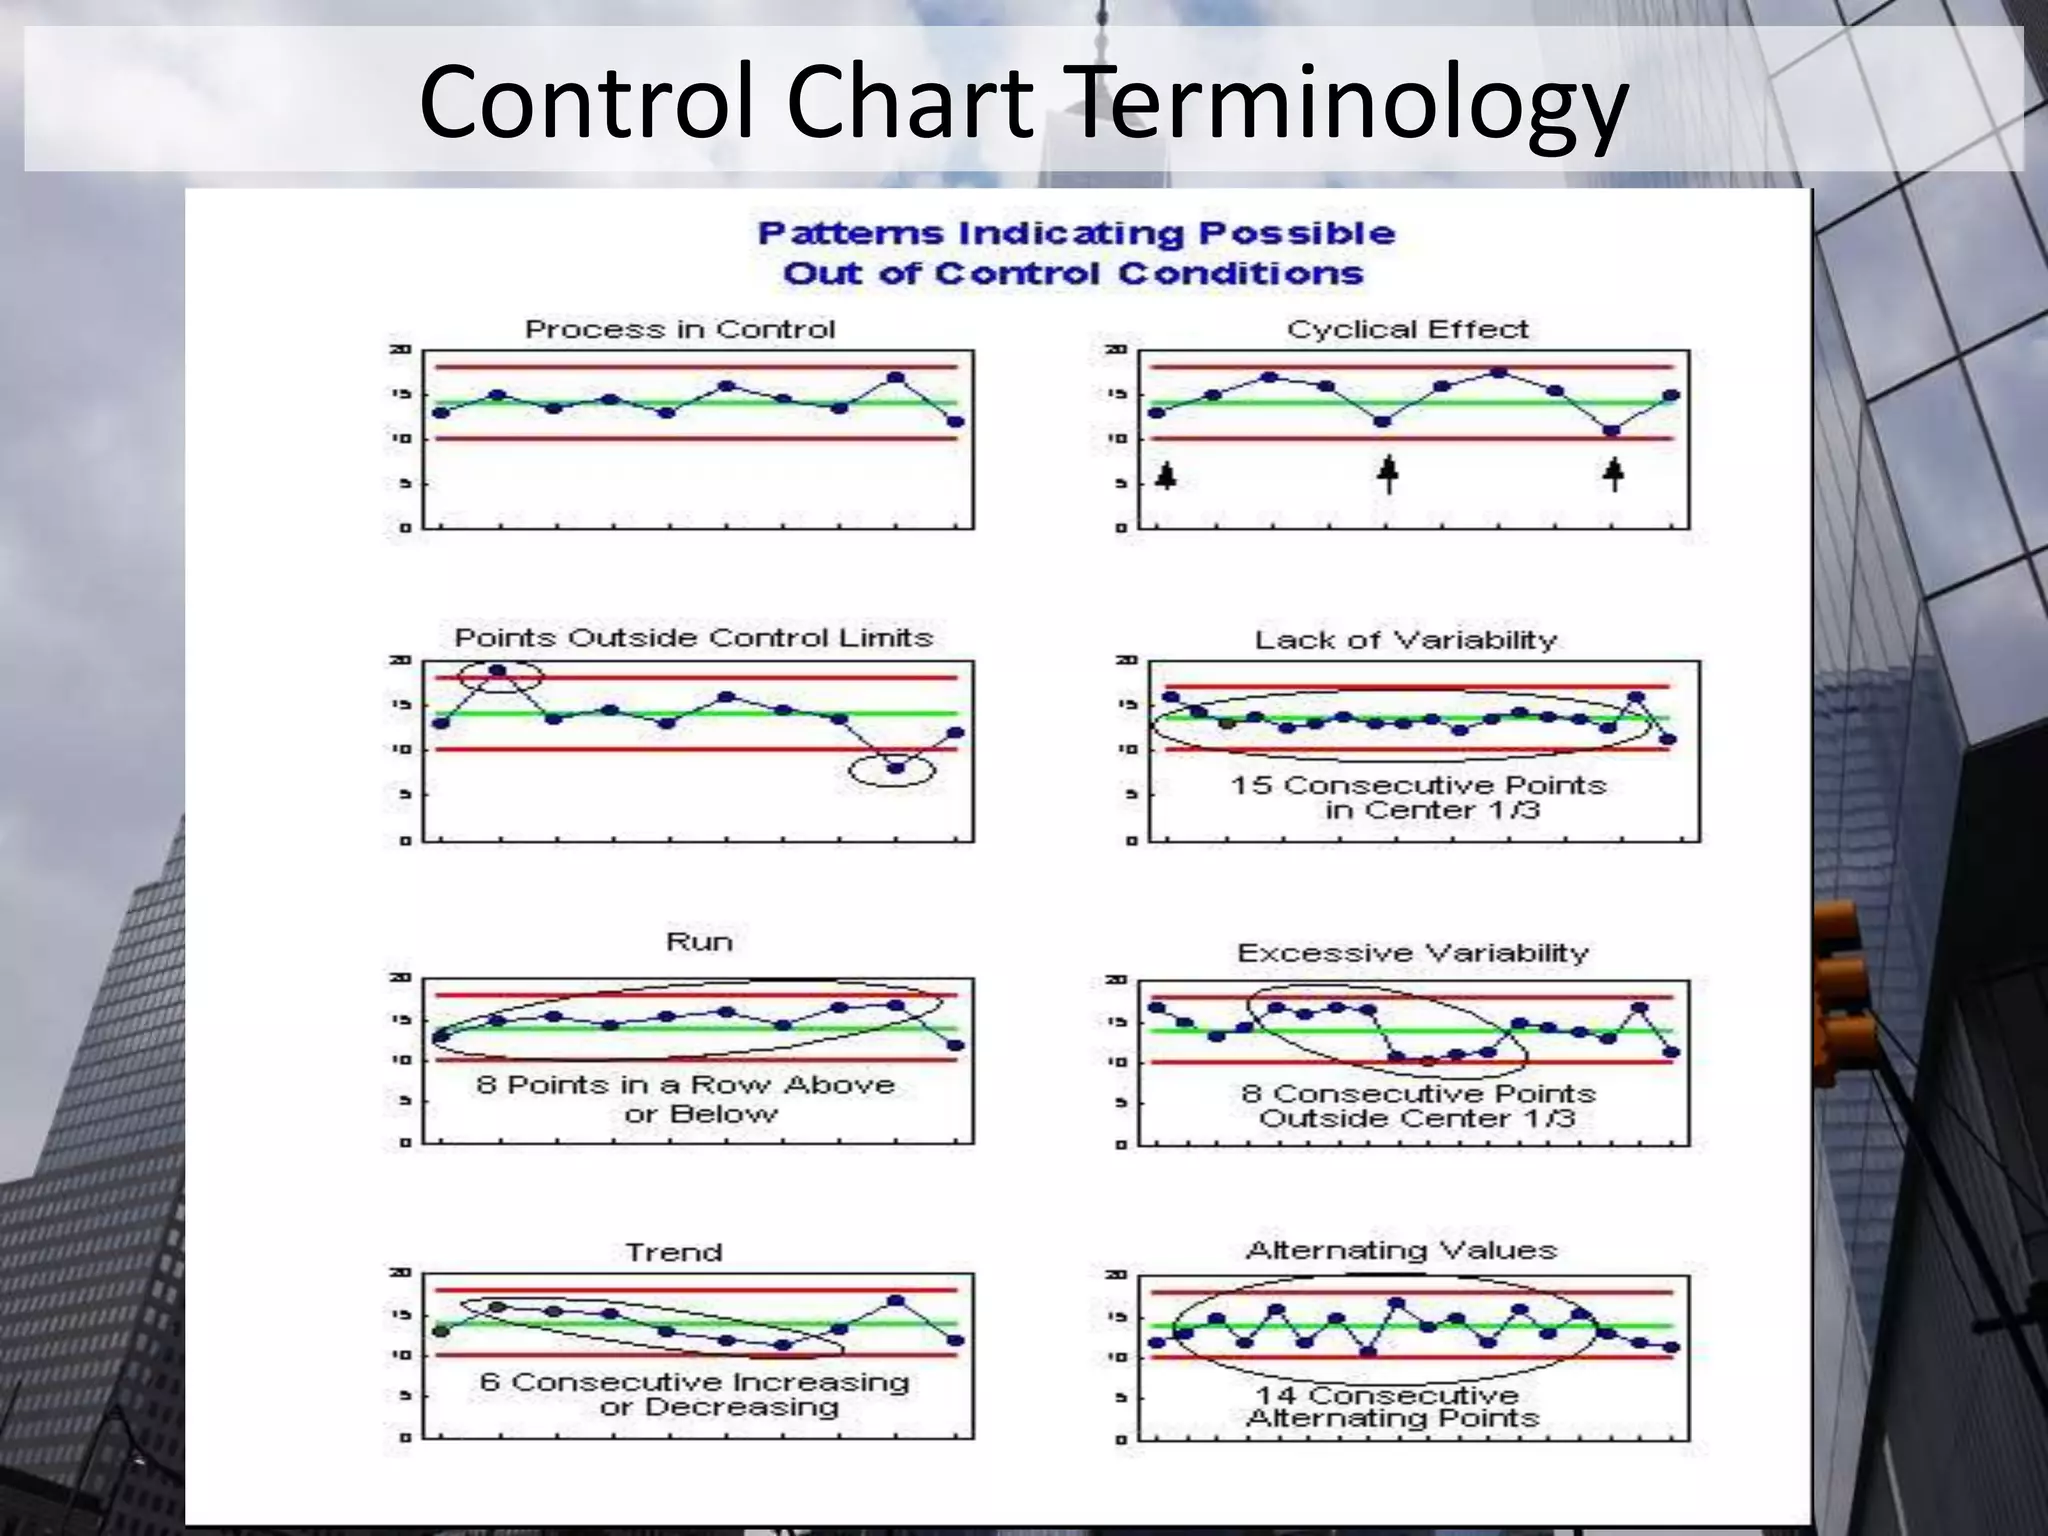
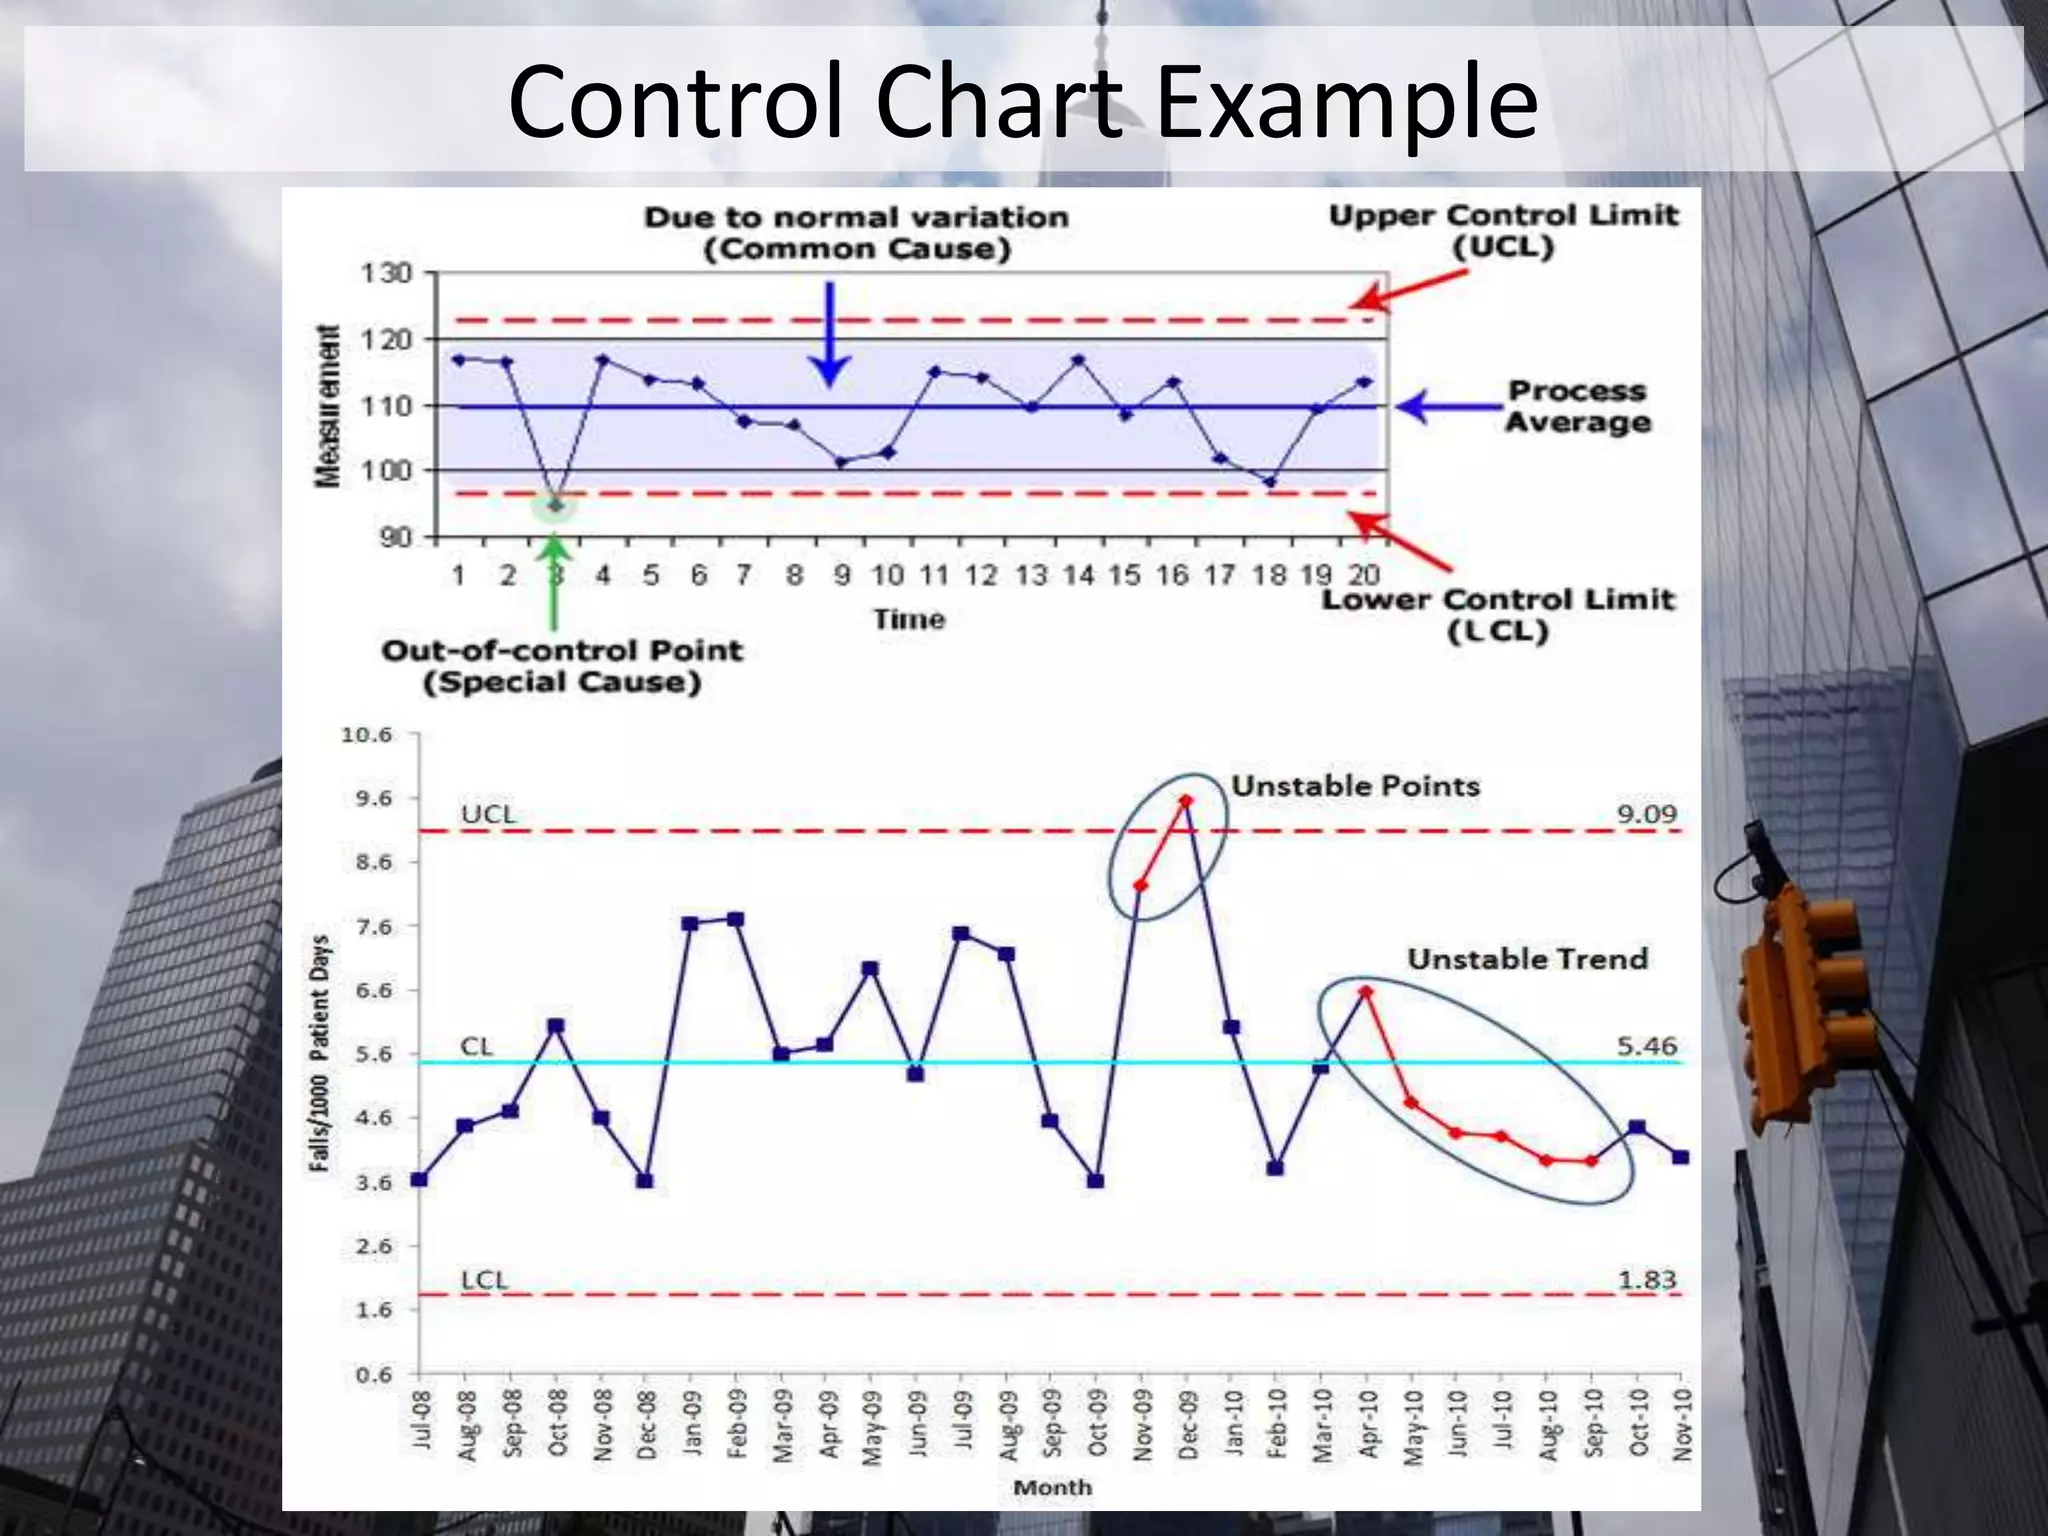
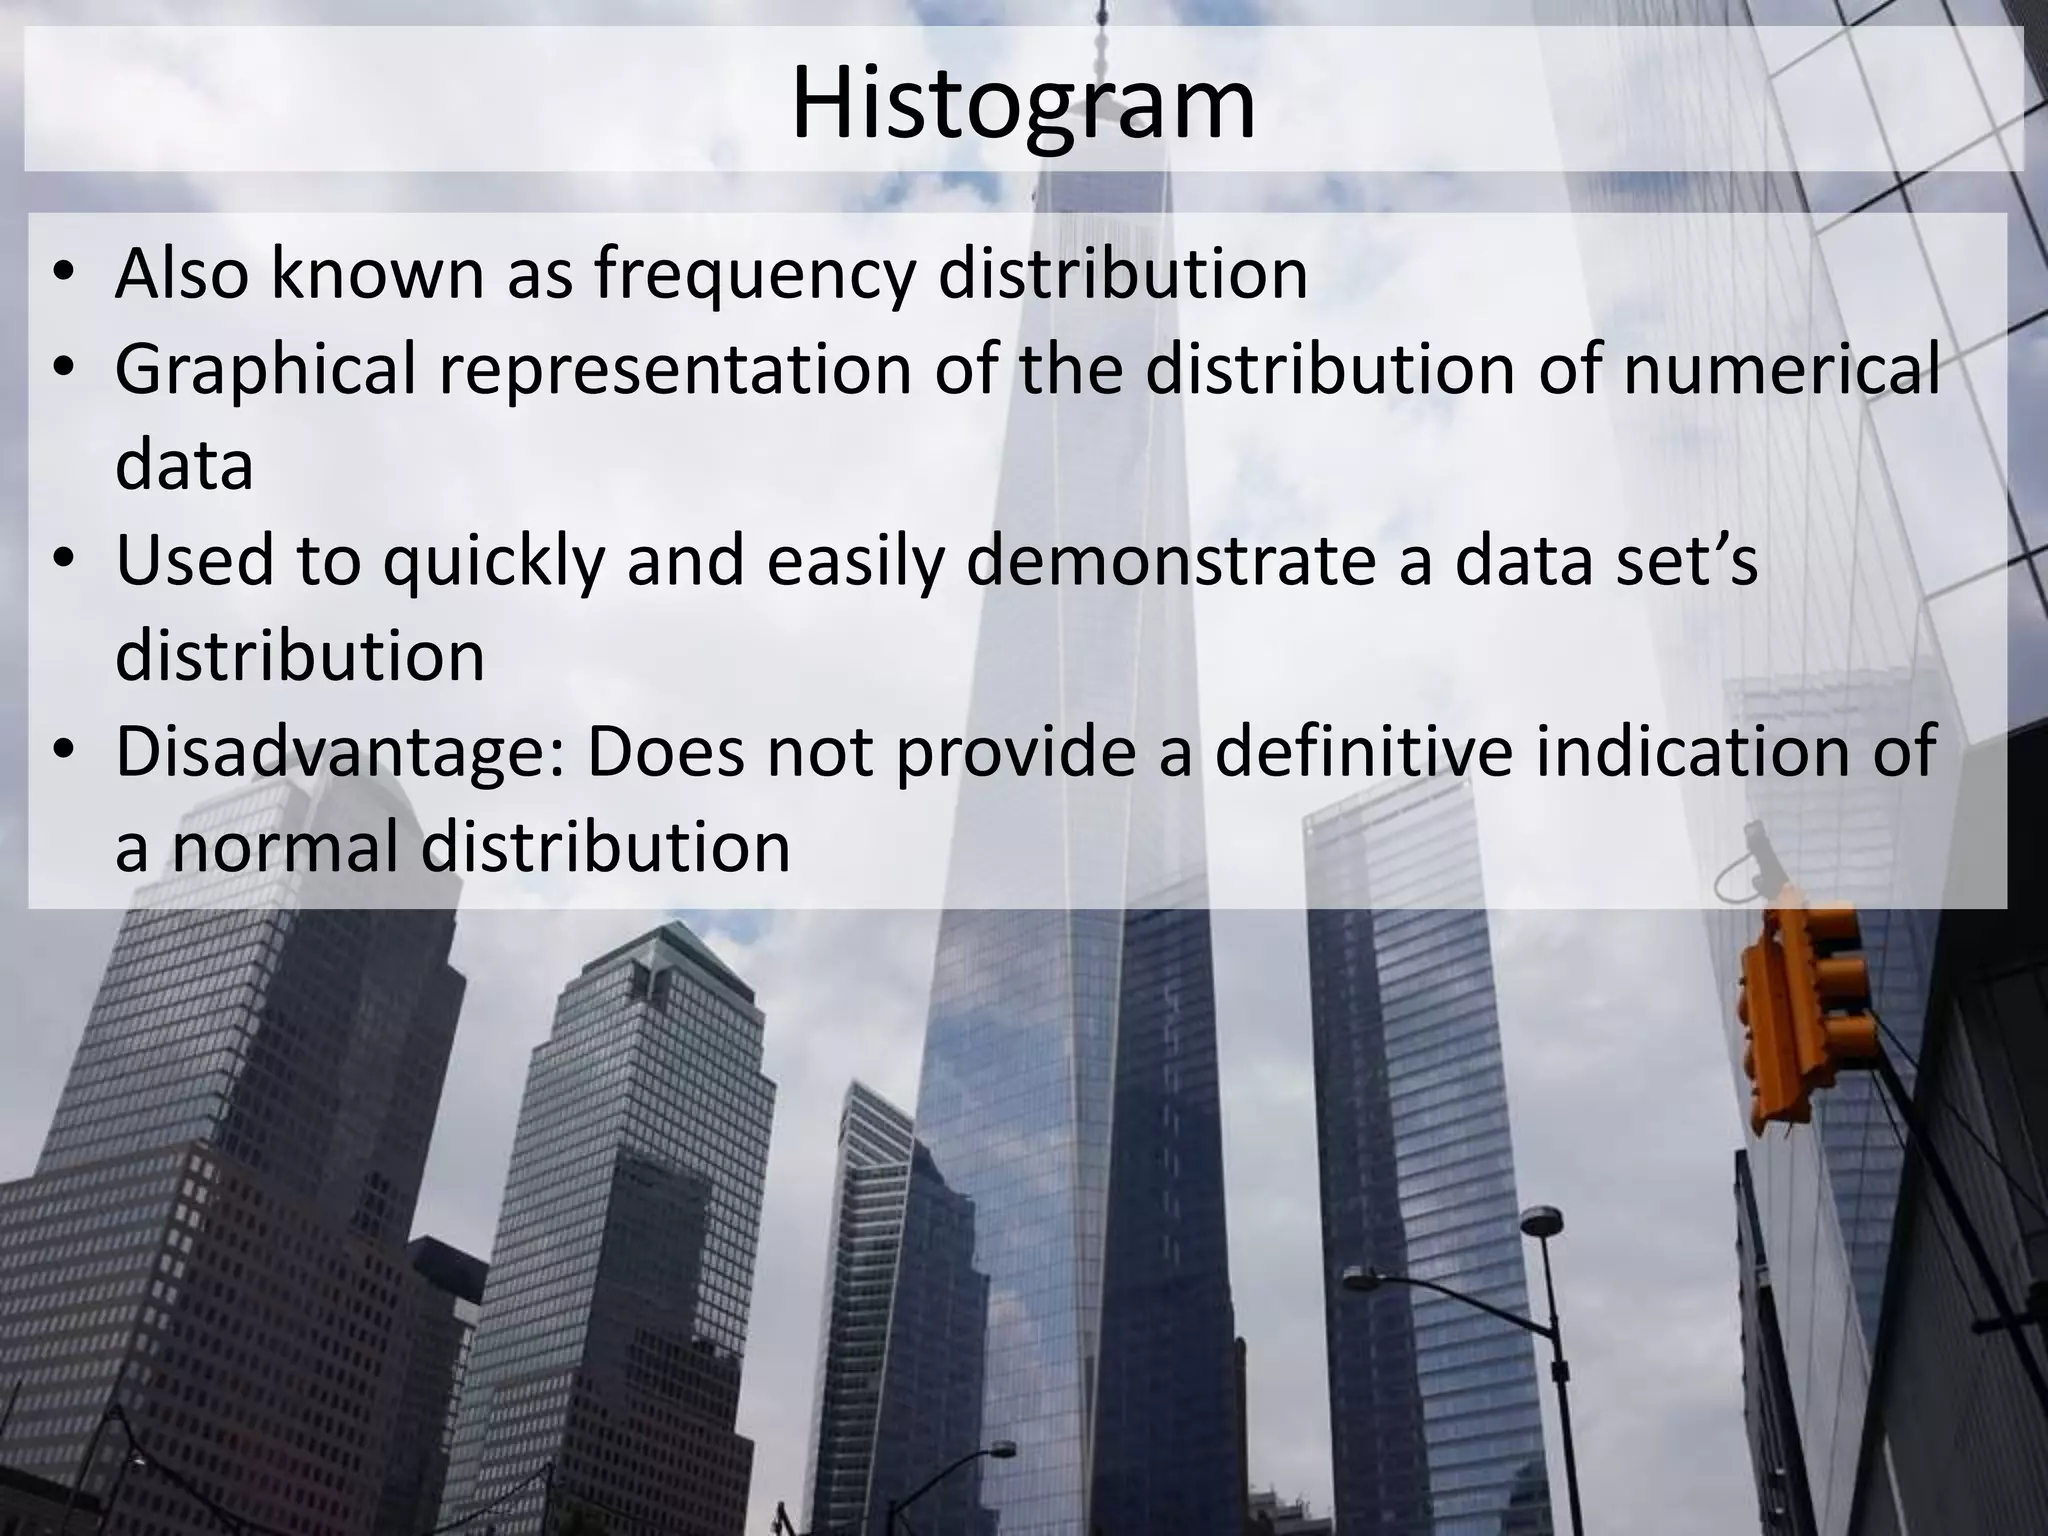
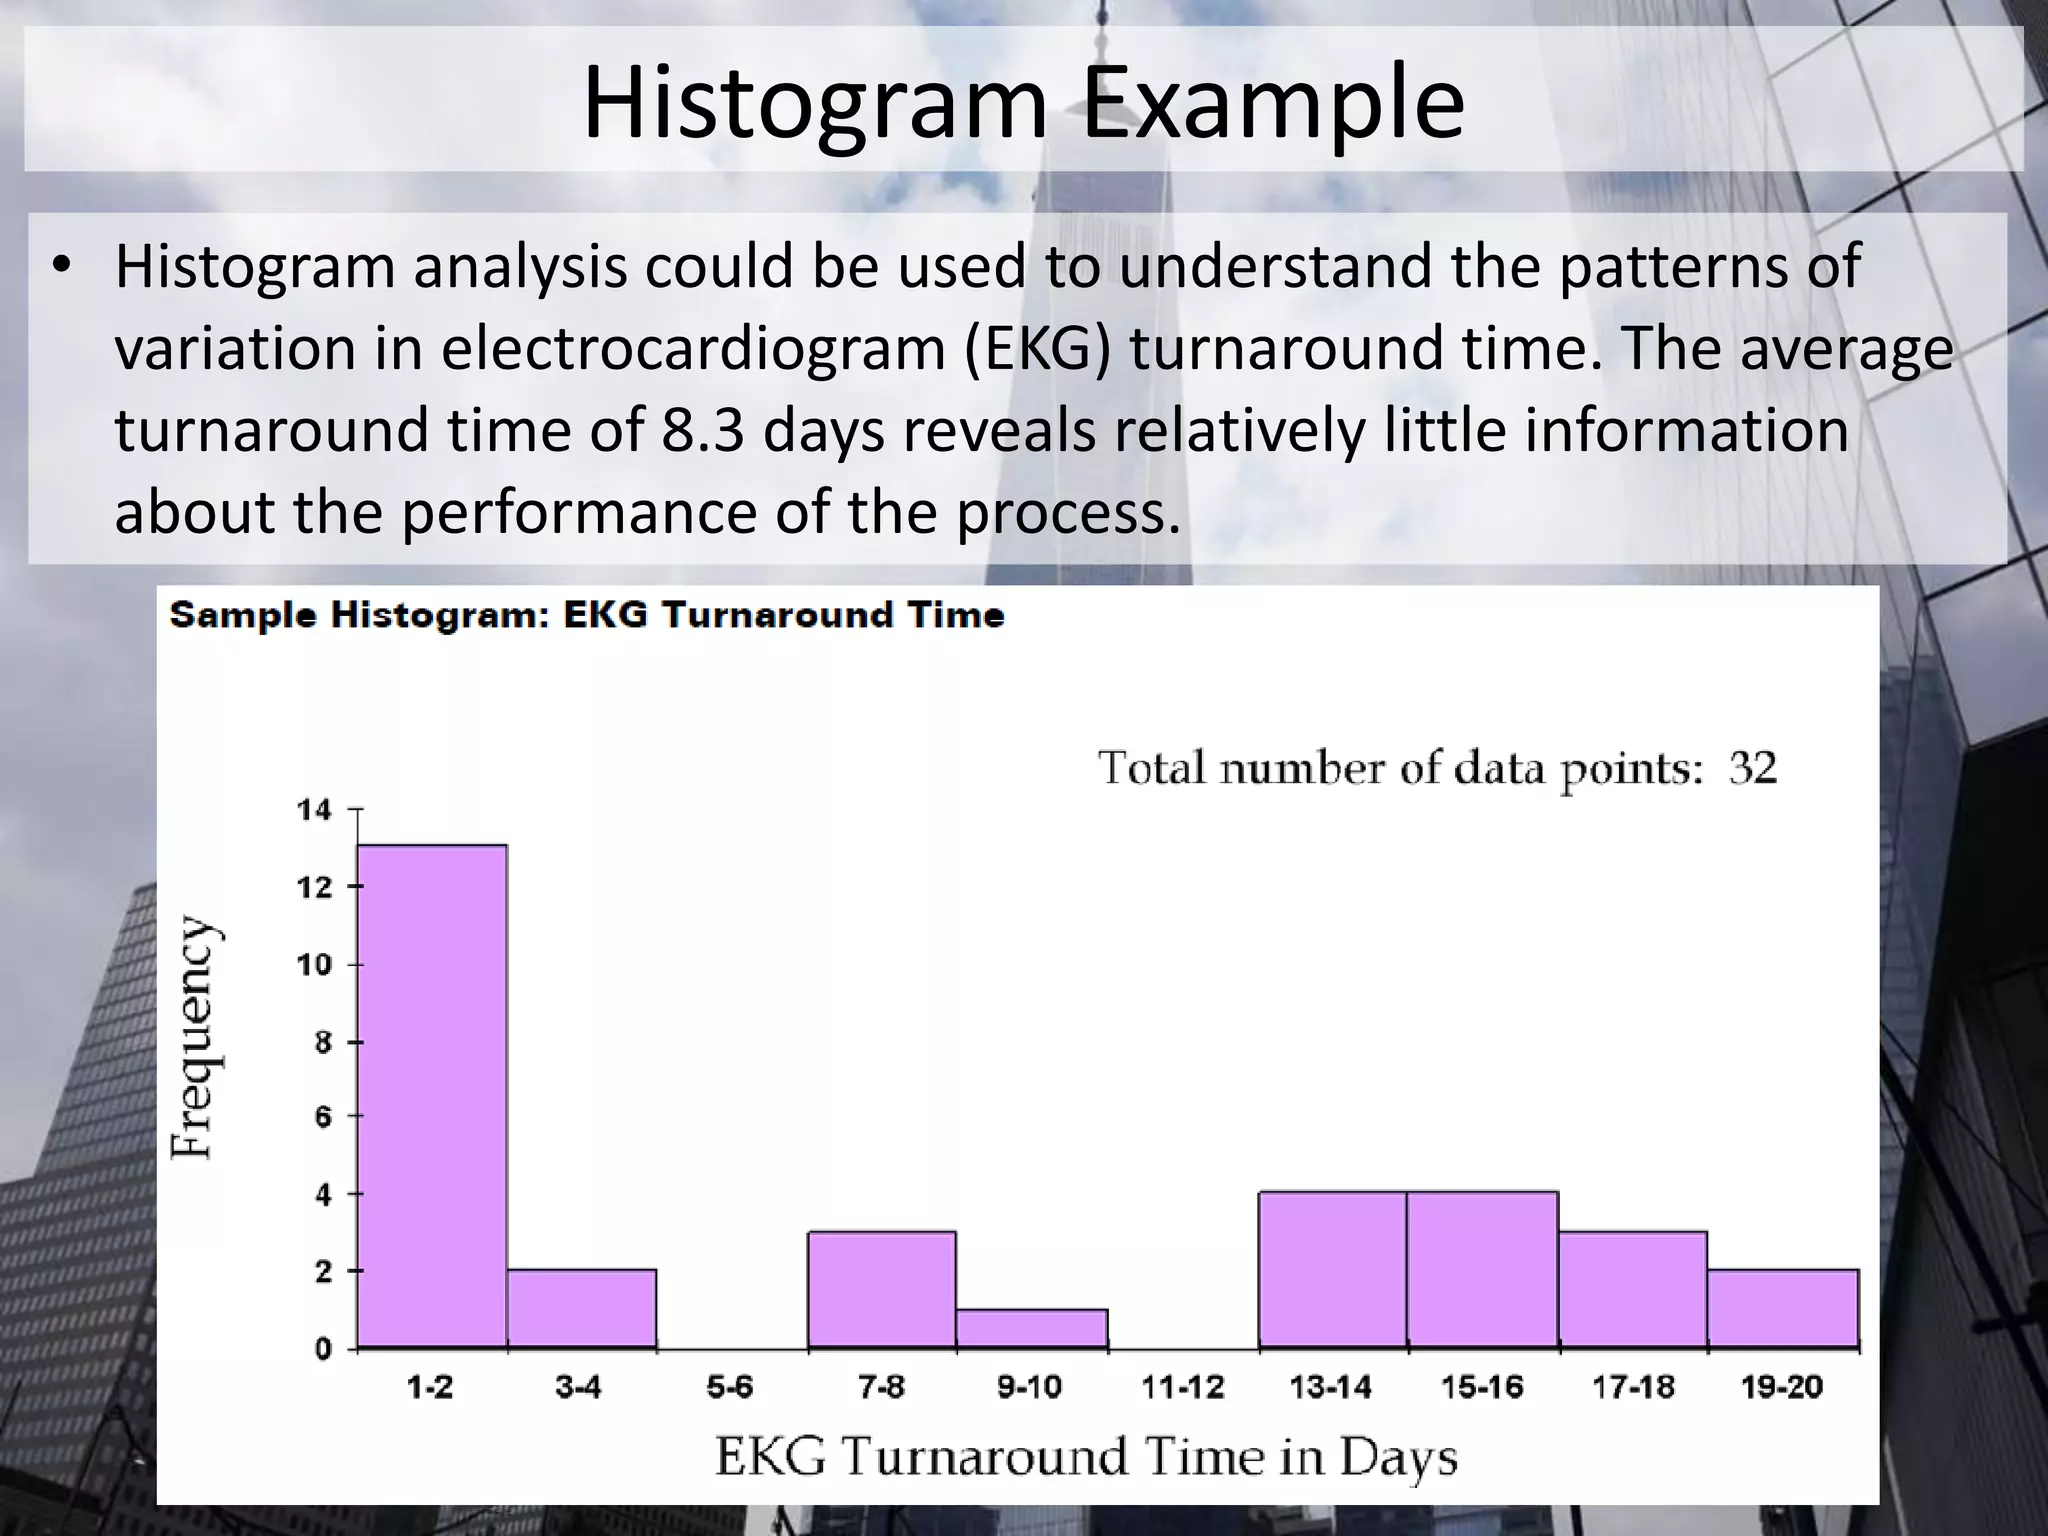
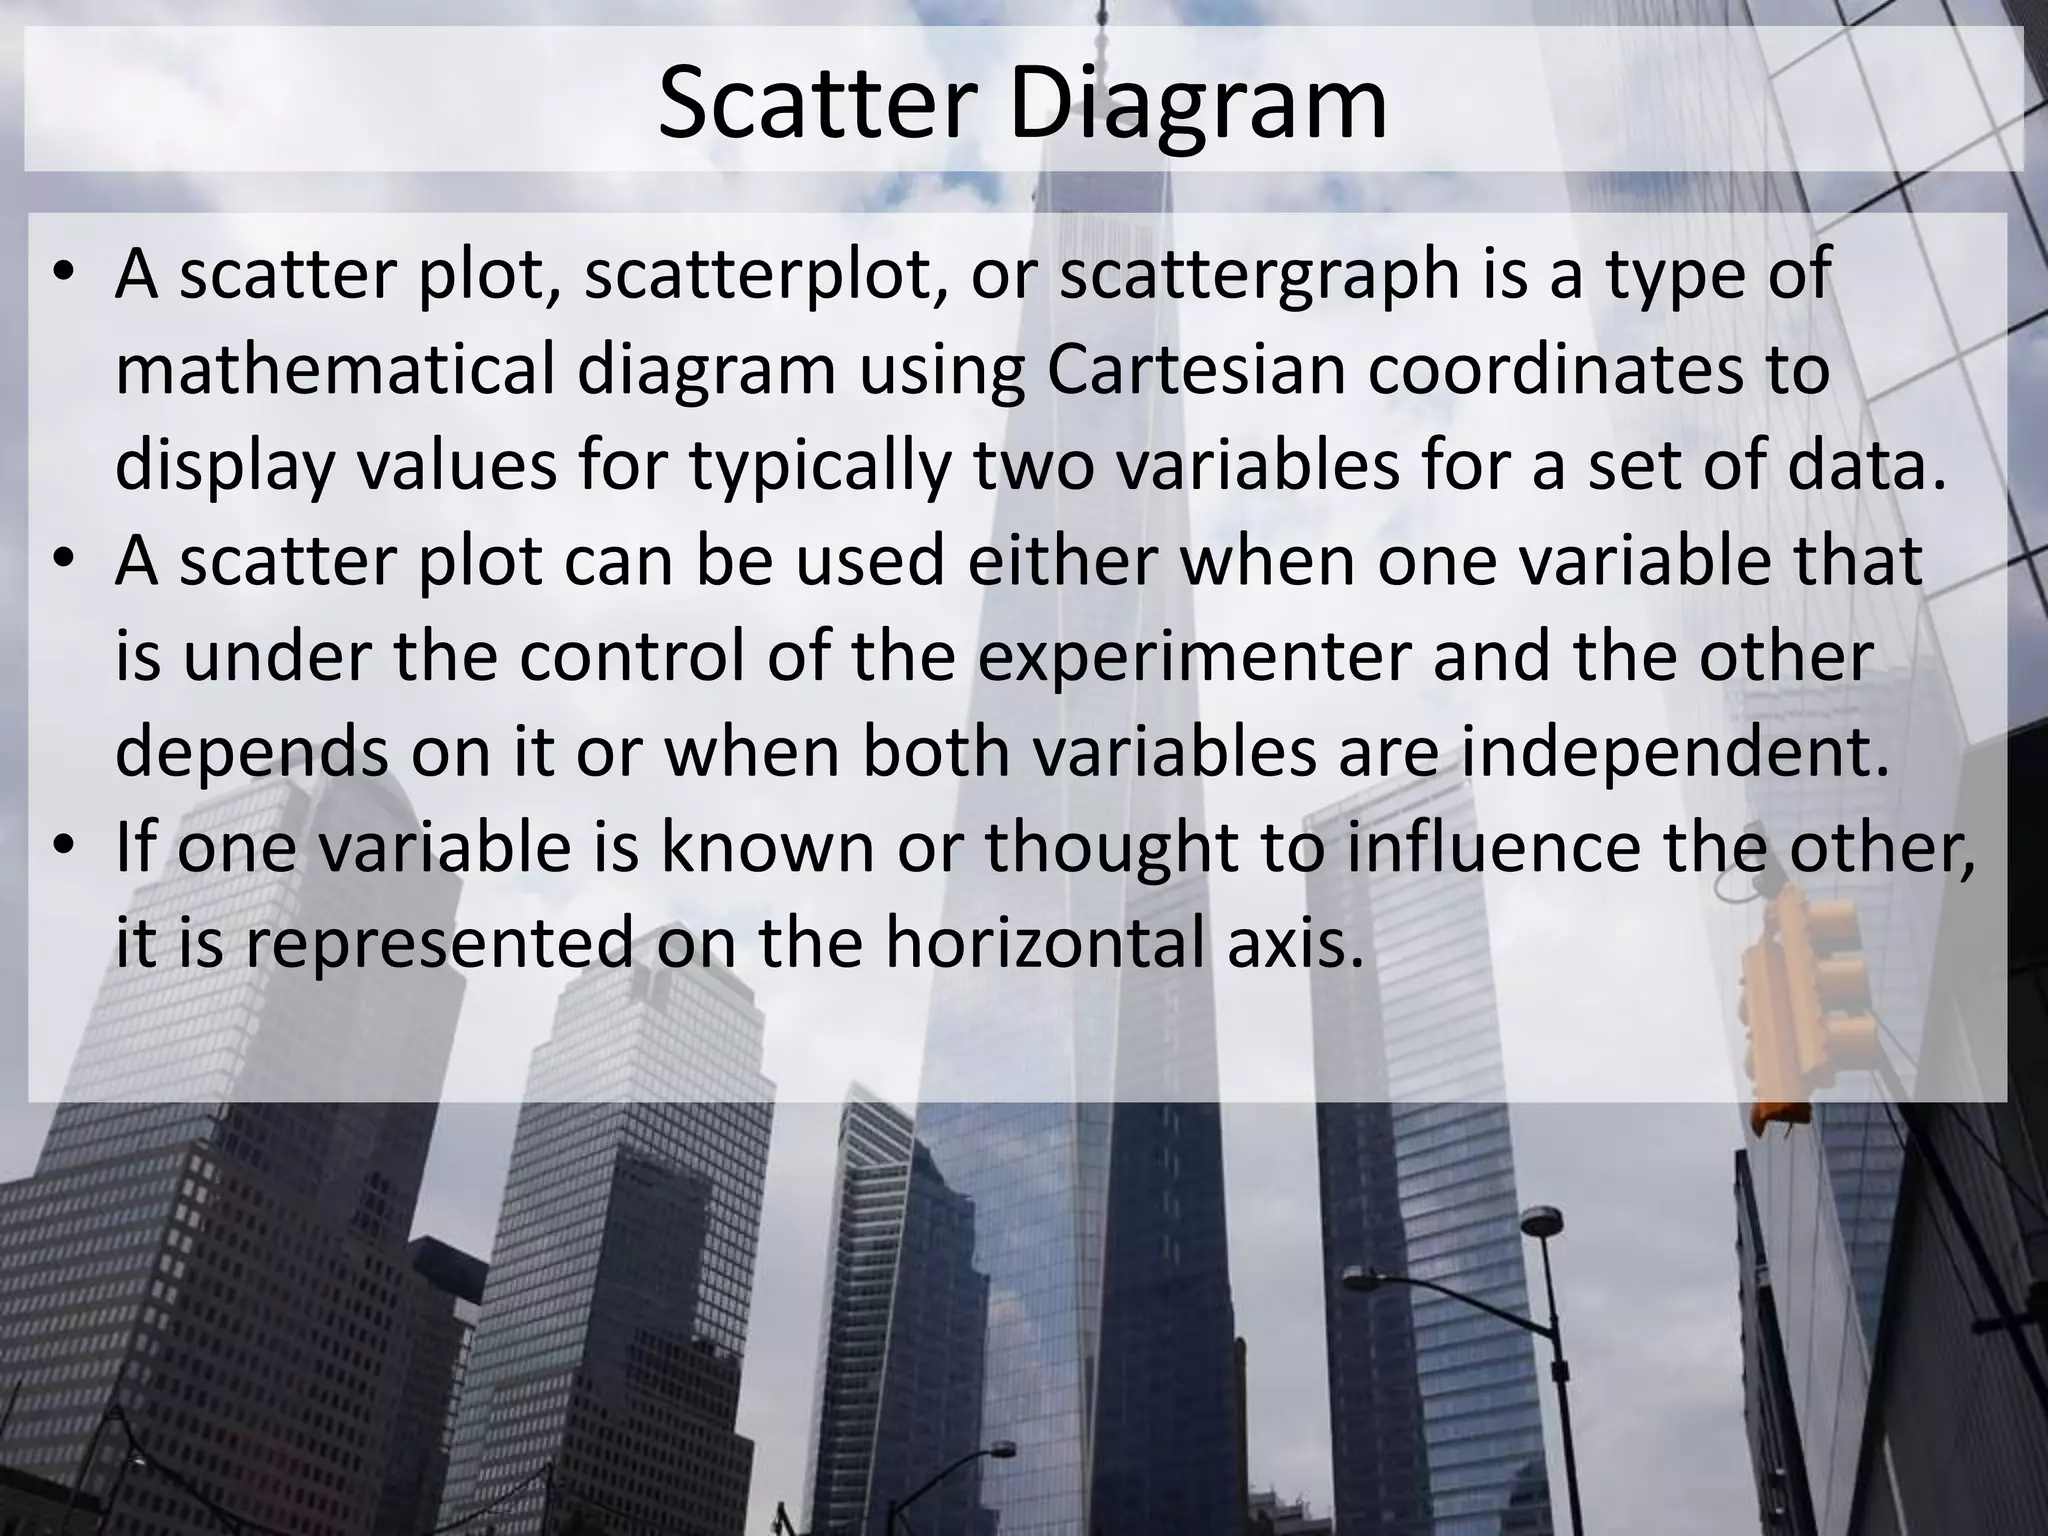
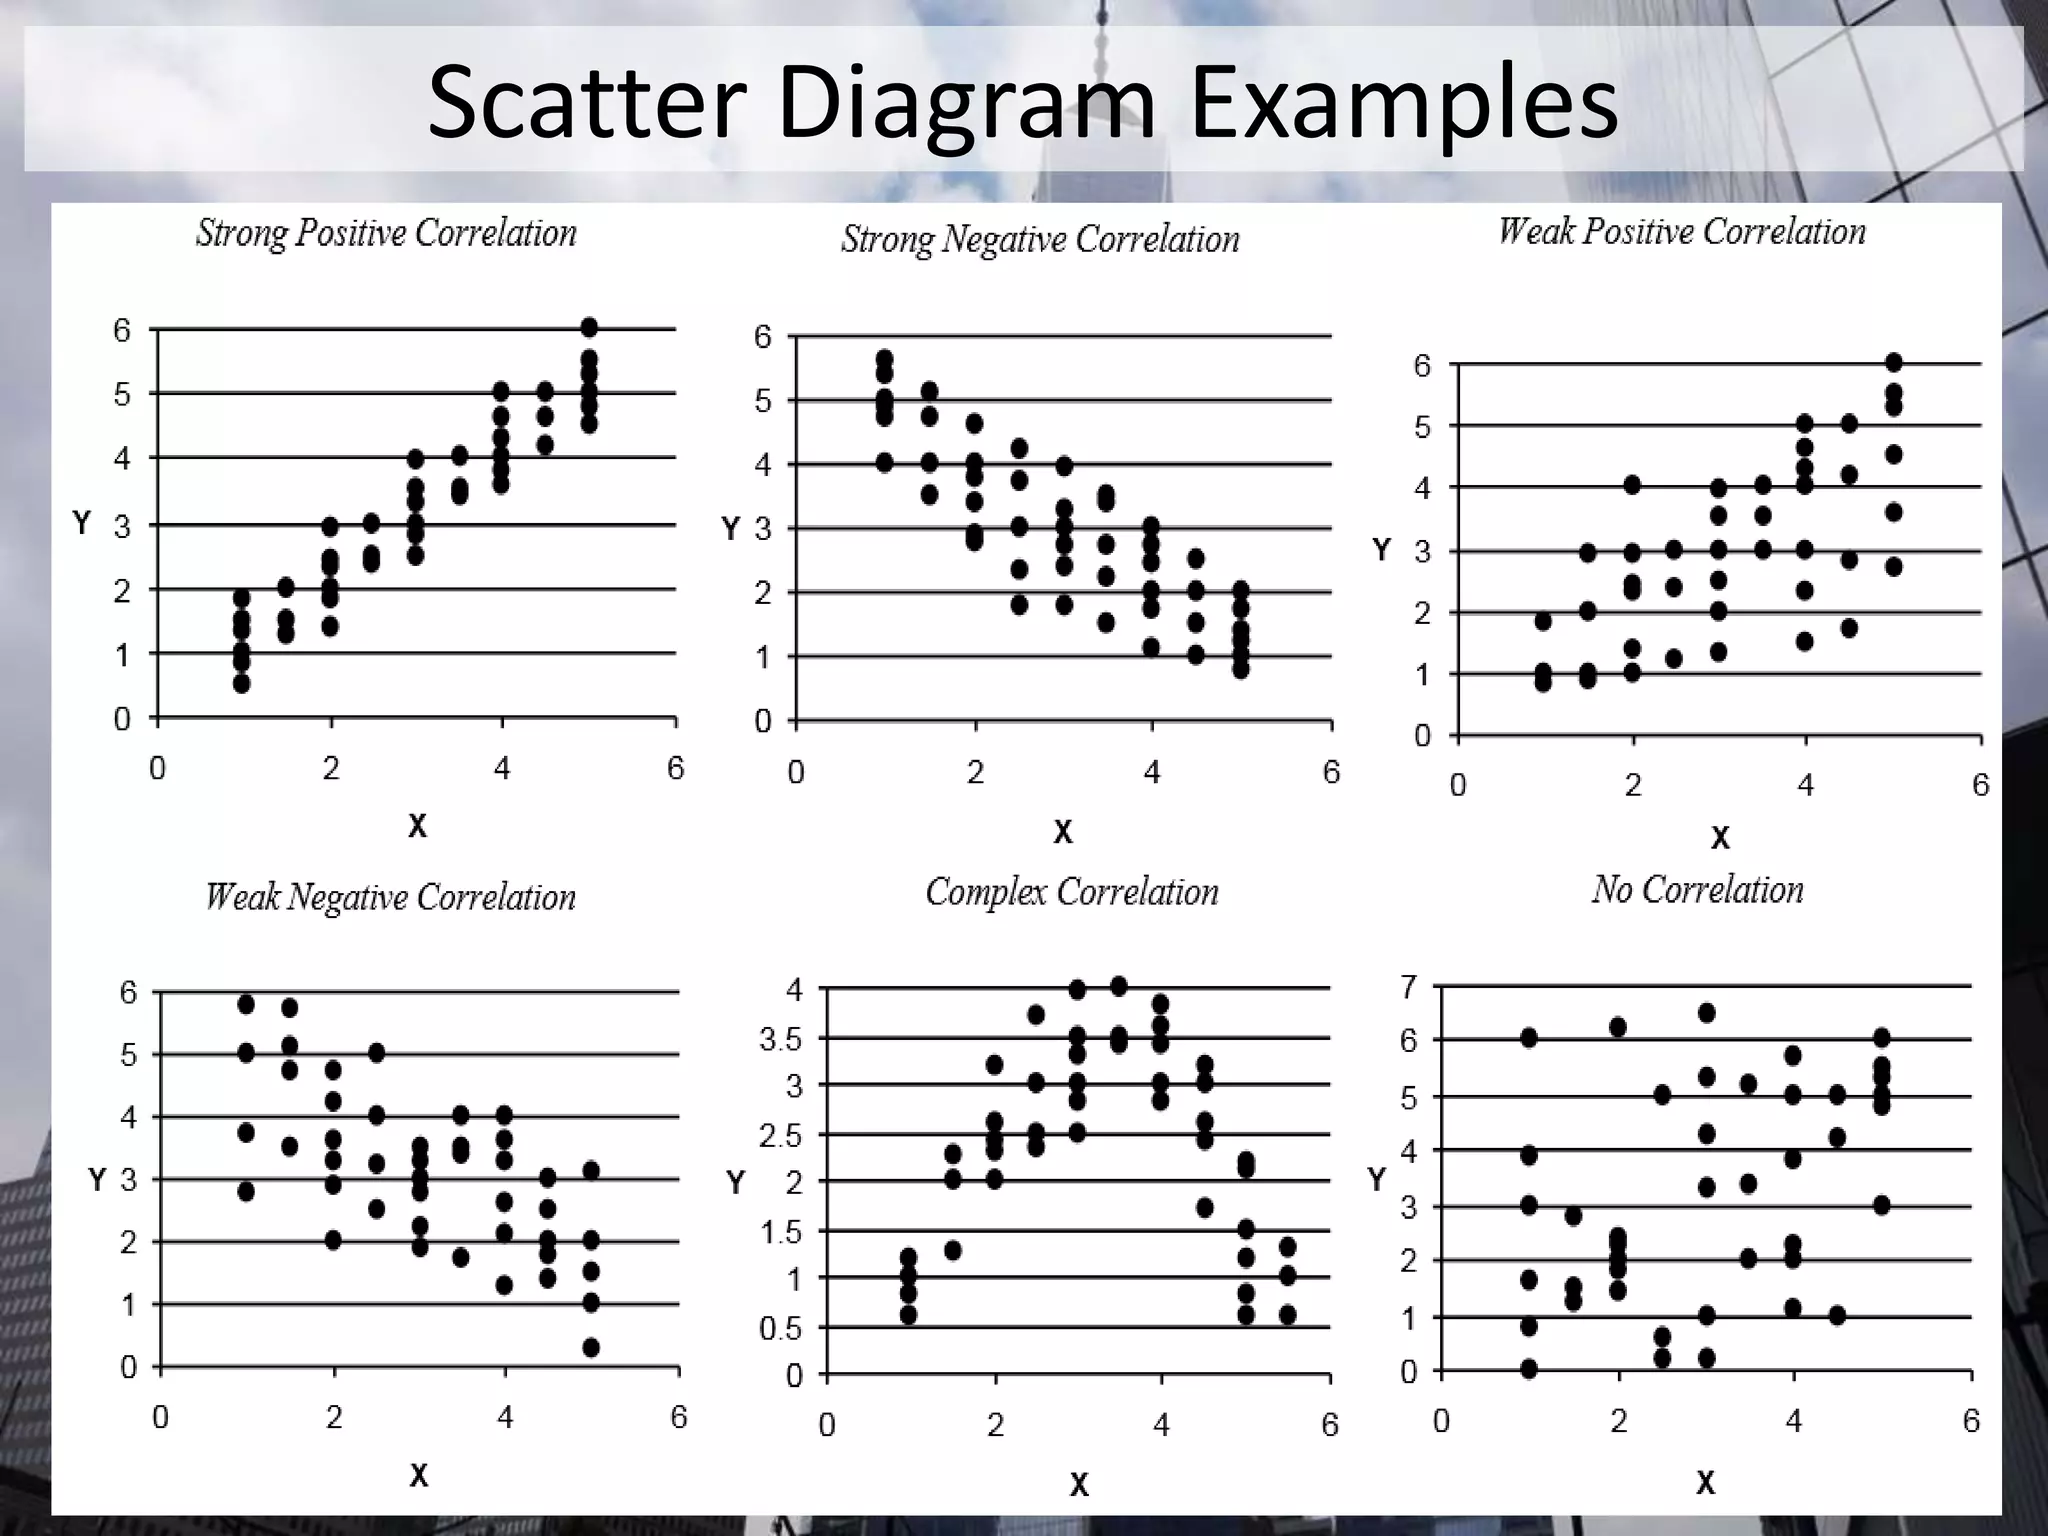


The seven basic tools of quality are graphical techniques used to troubleshoot quality issues. They include Pareto charts, cause-and-effect diagrams, check sheets, control charts, histograms, scatter diagrams, and stratification. Each tool has a specific purpose, such as identifying frequent problems (Pareto), potential causes of issues (cause-and-effect), measuring occurrences (check sheet), monitoring processes (control chart), displaying data distributions (histogram), examining relationships between variables (scatter diagram), and sampling stratified subgroups (stratification). Flowcharts and run charts are also commonly used quality tools.


