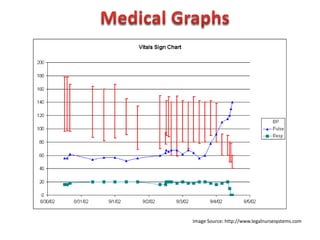
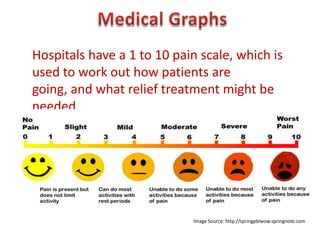
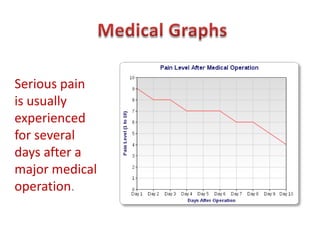
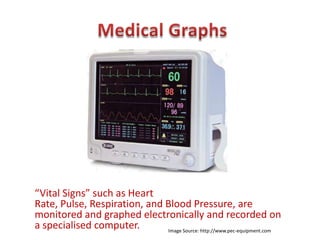
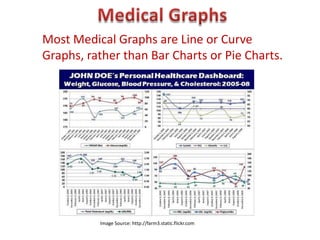
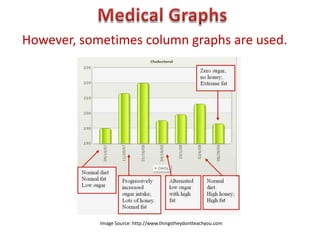
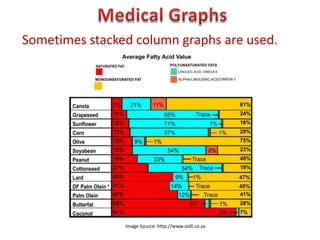
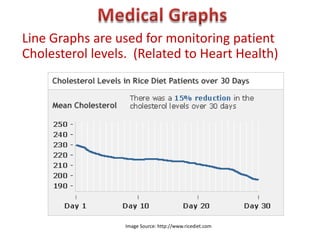
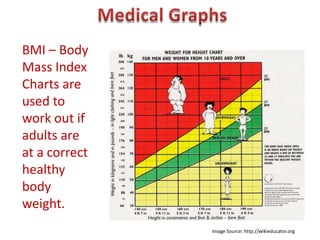
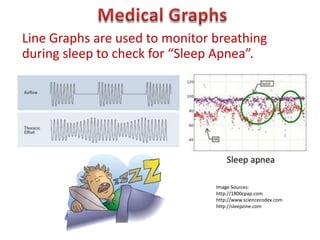
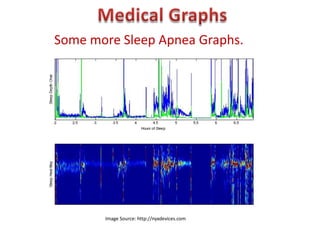
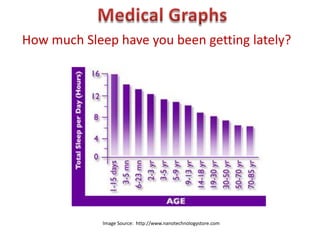
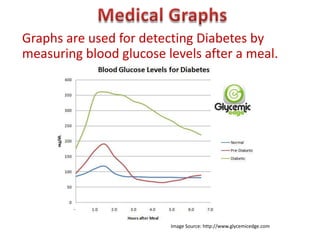

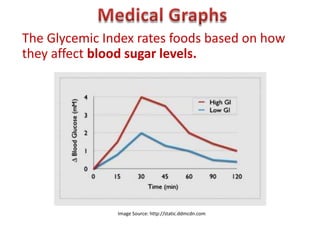
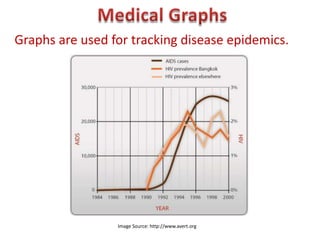
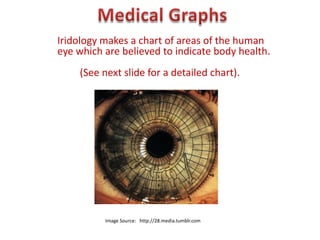
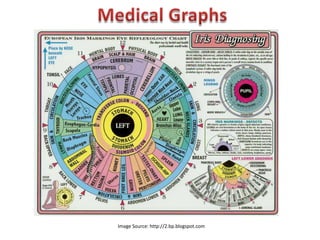
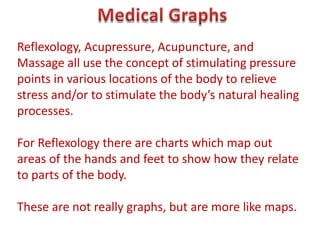
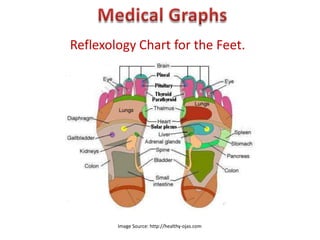
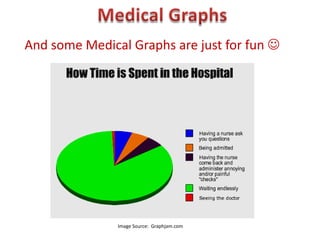


The document discusses how various types of graphs are used in medical contexts. Hospitals use pain scales to assess patient pain levels and treatment needs. Vital signs like heart rate and blood pressure are often graphed electronically. Line and curve graphs are commonly used to monitor things like sleep apnea, cholesterol levels, blood glucose levels, and disease outbreaks over time. Other graphs show concepts like body mass index, sleep patterns, and the glycemic index of foods. Reflexology uses charts to map pressure points on hands and feet to different body parts.