More Related Content
Similar to Alaska State Bridge Profile
Similar to Alaska State Bridge Profile (13)
Alaska State Bridge Profile
- 1. © 2014 The American Road & Transportation Builders Association (ARTBA). All rights reserved. No part of this document may be reproduced or
transmitted in any form or by any means, electronic, mechanical, photocopying, recording, or otherwise, without prior written permission of
ARTBA.
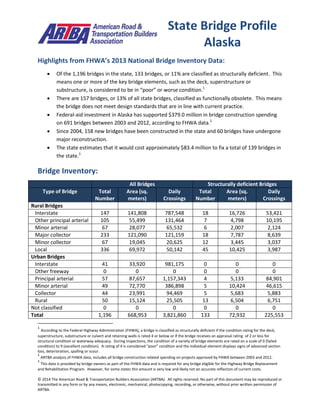
Highlights from FHWA’s 2013 National Bridge Inventory Data:
Of the 1,196 bridges in the state, 133 bridges, or 11% are classified as structurally deficient. This
means one or more of the key bridge elements, such as the deck, superstructure or
substructure, is considered to be in “poor” or worse condition.1
There are 157 bridges, or 13% of all state bridges, classified as functionally obsolete. This means
the bridge does not meet design standards that are in line with current practice.
Federal-aid investment in Alaska has supported $379.0 million in bridge construction spending
on 691 bridges between 2003 and 2012, according to FHWA data.2
Since 2004, 158 new bridges have been constructed in the state and 60 bridges have undergone
major reconstruction.
The state estimates that it would cost approximately $83.4 million to fix a total of 139 bridges in
the state.3
Bridge Inventory:
All Bridges Structurally deficient Bridges
Type of Bridge Total
Number
Area (sq.
meters)
Daily
Crossings
Total
Number
Area (sq.
meters)
Daily
Crossings
Rural Bridges
Interstate 147 141,808 787,548 18 16,726 53,421
Other principal arterial 105 55,499 131,464 7 4,798 10,195
Minor arterial 67 28,077 65,532 6 2,007 2,124
Major collector 233 121,090 121,159 18 7,787 8,639
Minor collector 67 19,045 20,625 12 3,445 3,037
Local 336 69,972 50,142 45 10,425 3,987
Urban Bridges
Interstate 41 33,920 981,175 0 0 0
Other freeway 0 0 0 0 0 0
Principal arterial 57 87,657 1,157,343 4 5,133 84,901
Minor arterial 49 72,770 386,898 5 10,424 46,615
Collector 44 23,991 94,469 5 5,683 5,883
Local 50 15,124 25,505 13 6,504 6,751
Not classified 0 0 0 0 0 0
Total 1,196 668,953 3,821,860 133 72,932 225,553
1
According to the Federal Highway Administration (FHWA), a bridge is classified as structurally deficient if the condition rating for the deck,
superstructure, substructure or culvert and retaining walls is rated 4 or below or if the bridge receives an appraisal rating of 2 or less for
structural condition or waterway adequacy. During inspections, the condition of a variety of bridge elements are rated on a scale of 0 (failed
condition) to 9 (excellent condition). A rating of 4 is considered “poor” condition and the individual element displays signs of advanced section
loss, deterioration, spalling or scour.
2
ARTBA analysis of FHWA data, includes all bridge construction related spending on projects approved by FHWA between 2003 and 2012.
3
This data is provided by bridge owners as part of the FHWA data and is required for any bridge eligible for the Highway Bridge Replacement
and Rehabilitation Program. However, for some states this amount is very low and likely not an accurate reflection of current costs.
State Bridge Profile
Alaska
- 2. © 2014 The American Road & Transportation Builders Association (ARTBA). All rights reserved. No part of this document may be reproduced or
transmitted in any form or by any means, electronic, mechanical, photocopying, recording, or otherwise, without prior written permission of
ARTBA.
Proposed bridge work:
Type of Work Number Cost (millions) Daily Crossings Area (sq. meters)
Bridge replacement 69 $70.1 56,378 26,563
Widening & rehabilitation 2 $0.7 8,281 34
Rehabilitation 4 $1.4 326 589
Deck rehabilitation/replacement 0 $0.0 0 0
Other work 64 $11.3 11,342 15,543
Top 10 Most Traveled Structurally Deficient Bridges in the State
County Year
Built
Daily
Crossings
Type of Bridge Location
(route/water under the bridge, traffic on the bridge and location)
Anchorage 1976 31,210 Urban other
principal arterial
MULDOON OVERCROSSING, MULDOON RD @ GLENN, MILE
POINT 3.3
Anchorage 1966 23,258 Urban other
principal arterial
CAMPBELL CREEK LAKE OTS, LAKE OTIS ROAD, MILE POINT 2.1
Fairbanks
North Star
1963 18,336 Urban other
principal arterial
CHENA RIVER (UNIV AVE), UNIVERSITY AVE, MILE POINT 0.4
Ketchikan
Gateway
1955 18,166 Urban minor
arterial
WATER ST VIADUCT, SOUTH TONGASS HWY, MILE POINT 1.7
Ketchikan
Gateway
1957 16,047 Urban minor
arterial
HOADLEY CREEK, SOUTH TONGASS HWY, MILE POINT 0.2
Juneau 1965 12,097 Urban other
principal arterial
MENDENHALL RIVER, GLACIER HIGHWAY, MILE POINT 9.3
Fairbanks
North Star
1953 7,800 Urban minor
arterial
CHENA RIVER (N HALL ST), WENDELL STREET, MILE POINT 1.2
Anchorage 1966 6,370 Rural Interstate PORTAGE CREEK NO 1, SEWARD HIGHWAY, MILE POINT 78.1
Anchorage 1967 6,370 Rural Interstate PORTAGE CREEK NO 2, SEWARD HIGHWAY, MILE POINT 78.6
Anchorage 1966 5,620 Rural Interstate GLACIER CREEK, SEWARD HIGHWAY, MILE POINT 89.1
Sources: All data is from the 2013 National Bridge Inventory, released by the Federal Highway Administration in March 2014.
Note that specific conditions on bridge may have changed as a result of recent work. Cost estimates of bridge work provided as
part of the data and have been adjusted to 2013$ for inflation and estimated project costs. Contract awards data is for state
and local government awards and comes from McGraw Hill. Note that additional bridge investment may be a part of other
contract awards if a smaller bridge project is included with a highway project, and that would not be accounted for in the total
in this profile.