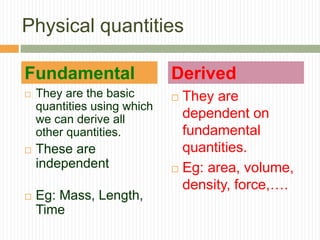
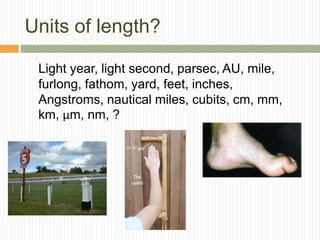
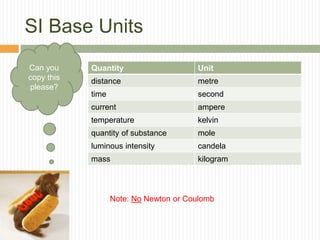
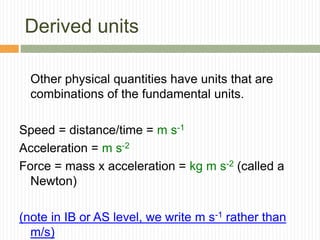
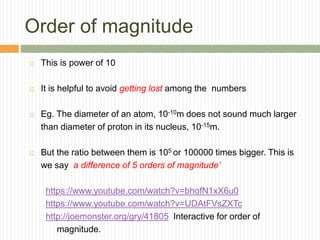
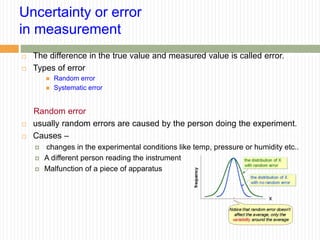
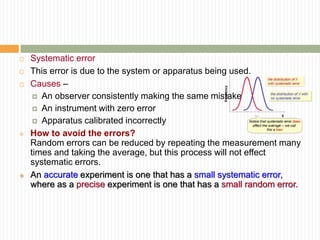
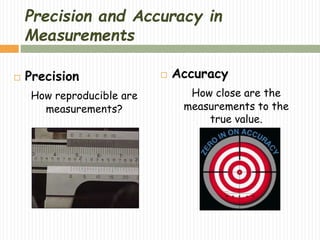
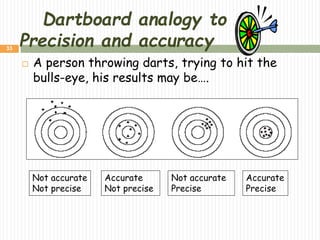
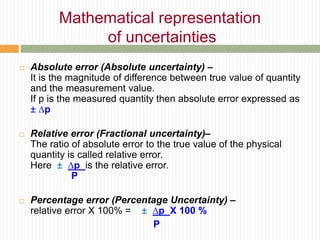
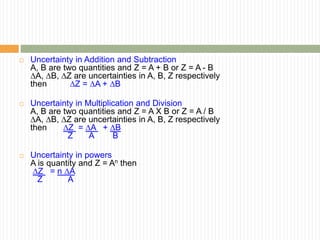
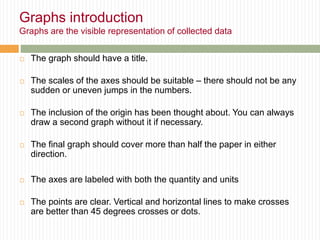
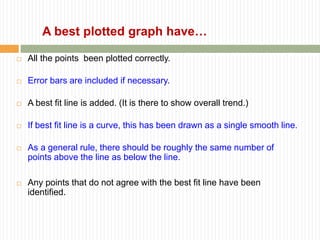
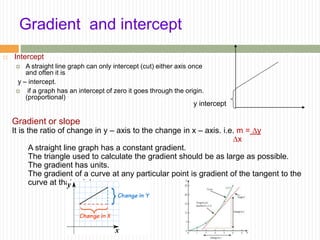
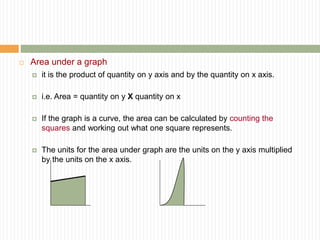
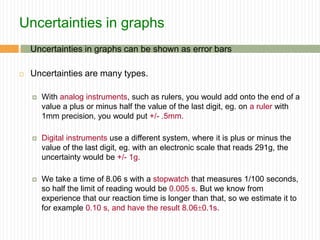
MEASUREMENT AND
UNCERTAINTY
IBDP & AS Level Physics
Information
 Content
 Physical quantities
 Units
 Scalars and vectors
 Significant figures
 Errors
 Uncertainty
 Plotting the graph
 Assessments
 Lab work –
Measuring the
density of an object.
 Work sheet
 Go formative -
http://goformative.co
m/teacher/#/assign
ments/WNCM796/e
dit?assign
Physical quantity
 Nature provides different experiences to the
mankind , Phenomena.
 These experiences which are measurable
scientifically termed as Physical quantities.
 we have two types of physical quantities.
 Fundamental quantities
 Derived quantities
Physical quantities
 They are the basic
quantities using which
we can derive all
other quantities.
 These are
independent
 Eg: Mass, Length,
Time
 They are
dependent on
fundamental
quantities.
 Eg: area, volume,
density, force,….
Fundamental Derived
Units
 A quantity used as a standard of
measurement.
Example: Units of time are second, minute,
hour, day, week, month, year and decade.
How many
different
units of
length can
you think
of?
Units of length?
Light year, light second, parsec, AU, mile,
furlong, fathom, yard, feet, inches,
Angstroms, nautical miles, cubits, cm, mm,
km, μm, nm, ?
The SI system of units
There are seven fundamental base units which
are clearly defined and on which all other
derived units are based:
You need to know these, but
not their definitions.
The metre
 This is the unit of distance. It is the distance
traveled by light in a vacuum in a time of
1/299792458 seconds.
The second
 This is the unit of time. A second is the
duration of 9192631770 full oscillations of the
electromagnetic radiation emitted in a
transition between two hyperfine energy levels
in the ground state of a caesium-133 atom.
 https://www.youtube.com/watch?annotation_id=annotation_2965246921&feature=iv&index=90&list=PLMrtJn-
MOYmfqNgyPxx6NYMZnd25y4shc&src_vid=r7x-RGfd0Yk&v=NXRVtfCpLr4
The ampere
 This is the unit of electrical current. It is
defined as that current which, when flowing in
two parallel conductors 1 m apart, produces a
force of 2 x 10⁻⁷ N on a length of 1 m of the
conductors.
Note that the Coulomb is NOT a base
unit.
The kelvin
 This is the unit of temperature. It is 1/273.16 of
the thermodynamic temperature of the triple
point of water.
The mole
 One mole of a substance contains as many
molecules as there are atoms in 12 g of
carbon-12. This special number of molecules
is called Avogadro’s number and equals 6.02 x
1023.
The candela (not used in IB)
 This is the unit of luminous intensity. It is the
intensity of a source of frequency 5.40 x 10¹⁴
Hz emitting 1/683 W per steradian.
The kilogram
 This is the unit of mass. It is the mass of a
certain quantity of a platinum-iridium alloy kept
at the Bureau International des Poids et
Mesures in France.
THE kilogram!
SI Base Units
Quantity Unit
distance metre
time second
current ampere
temperature kelvin
quantity of substance mole
luminous intensity candela
mass kilogram
Can you
copy this
please?
Note: No Newton or Coulomb
Derived units
Other physical quantities have units that are
combinations of the fundamental units.
Speed = distance/time = m s-1
Acceleration = m s-2
Force = mass x acceleration = kg m s-2 (called a
Newton)
(note in IB or AS level, we write m s-1 rather than
m/s)
Order of magnitude
 This is power of 10
 It is helpful to avoid getting lost among the numbers
 Eg. The diameter of an atom, 10-10m does not sound much larger
than diameter of proton in its nucleus, 10-15m.
 But the ratio between them is 105 or 100000 times bigger. This is
we say a difference of 5 orders of magnitude’
https://www.youtube.com/watch?v=bhofN1xX6u0
https://www.youtube.com/watch?v=UDAtFVsZXTc
http://joemonster.org/gry/41805 Interactive for order of
magnitude.
Range of masses
10-31 Kg
electron Grain of sand/
Blood corpuscle
10-8
Mass of
the earth
1024 1028
Mass of
Milky way galaxy
1040 1044
Mass of the
Observed
universe
1052
Most fundamental particle is quark and it hides inside proton and neutron.
the lightest quark is up quark , whose mass is about 10-30 kg.
Range of lengths
10-15 m
Diameter
of proton
Diameter
of atom
10-10
Radius of
the earth
106 108
Distance of
Earth to sun
1010 1012
Radius of
Observed universe
1026
There is a much smaller fundamental unit of length, Planck length,
which is around 10-35 m.
Range of Time
10-24 10-22
Passage of
Light across
A nucleus
Passage of
Light across
An atom
10-20 10-18
Passage of
Light across
A room
10-8
Heart beat
100
1016 1018
Age of the earth
s1018 1020
Age of the universe
What is theoretical lower limit of time?
Estimation – what is ratio of rest mass of proton to rest mass of electron?
Estimate the following:
1. The mass of an apple
2. The number of times a human heart beats in
a lifetime.
3. The speed a cockroach can run.
4. The number of times the earth will fit into the
sun (Rs = 6.96 x 10⁸ m, Re = 6.35 x 10⁶ m)
(to the nearest order of magnitude)
Estimate the following:
1. The mass of an apple 10-1 kg
2. The number of times a human heart beats in
a lifetime.
3. The speed a cockroach can run.
4. The number of times the earth will fit into the
sun (Rs = 6.96 x 10⁸, Re = 6.35 x 10⁶)
(to the nearest order of magnitude)
Estimate the following:
1. The mass of an apple 10-1 kg
2. The number of times a human heart beats in
a lifetime. 70x60x24x365x70=109
3. The speed a cockroach can run.
4. The number of times the earth will fit into the
sun (Rs = 6.96 x 10⁸, Re = 6.35 x 10⁶)
(to the nearest order of magnitude)
Estimate the following:
1. The mass of an apple 10-1 kg
2. The number of times a human heart beats in
a lifetime. 70x60x24x365x70=109
3. The speed a cockroach can run. 100 m/s
4. The number of times the earth will fit into the
sun (6.96 x 10⁸)3/(6.35 x 106)3 = 106
(to the nearest order of magnitude)
Significant figures
 These are number of digits up to which we are sure about their
accuracy.
 Significant figures do not change if we measure a physical quantity
in different units.
 E.g. 14.5 cm = 0.145 m = 14.5 X 10⁻² m
Here three values have same
significant figures i.e. 3
Rules for significant figures
1. All non zero digits are significant figures.
 17 - 2
 178 - 3
2. All zeros occurring between non zero digits are significant
figures.
 401 - 3
 40056 - 5
3. All zeros to the right of the last non zero digit are not significant
figures.
 20 - 1
 20350 - 4
4. All zeros to the right of a decimal point and to the left of a non
zero digit are not significant figures.
 0.04 - 1
 0.0045 - 2
5. All zeros to the right of a decimal point and to the right of a non
zero digit are significant figures.
 0.20 - 2
 0.2370 - 4
Uncertainty or error
in measurement
 The difference in the true value and measured value is called error.
 Types of error
 Random error
 Systematic error
Random error
 usually random errors are caused by the person doing the experiment.
 Causes –
 changes in the experimental conditions like temp, pressure or humidity etc..
 A different person reading the instrument
 Malfunction of a piece of apparatus
 Systematic error
 This error is due to the system or apparatus being used.
 Causes –
 An observer consistently making the same mistake
 An instrument with zero error
 Apparatus calibrated incorrectly
 How to avoid the errors?
Random errors can be reduced by repeating the measurement many
times and taking the average, but this process will not effect
systematic errors.
 An accurate experiment is one that has a small systematic error,
where as a precise experiment is one that has a small random error.
Precision and Accuracy in
Measurements
 Precision
How reproducible are
measurements?
 Accuracy
How close are the
measurements to the
true value.
33
Dartboard analogy to
Precision and accuracy
 A person throwing darts, trying to hit the
bulls-eye, his results may be….
Not accurate
Not precise
Accurate
Not precise
Not accurate
Precise
Accurate
Precise
 Absolute error (Absolute uncertainty) –
It is the magnitude of difference between true value of quantity
and the measurement value.
If p is the measured quantity then absolute error expressed as
± ∆p
 Relative error (Fractional uncertainty)–
The ratio of absolute error to the true value of the physical
quantity is called relative error.
Here ± ∆p is the relative error.
P
 Percentage error (Percentage Uncertainty) –
relative error X 100% = ± ∆p X 100 %
P
Mathematical representation
of uncertainties
 Uncertainty in Addition and Subtraction
A, B are two quantities and Z = A + B or Z = A - B
∆A, ∆B, ∆Z are uncertainties in A, B, Z respectively
then ∆Z = ∆A + ∆B
 Uncertainty in Multiplication and Division
A, B are two quantities and Z = A X B or Z = A / B
∆A, ∆B, ∆Z are uncertainties in A, B, Z respectively
then ∆Z = ∆A + ∆B
Z A B
 Uncertainty in powers
A is quantity and Z = An then
∆Z = n ∆A
Z A
Graphs introduction
Graphs are the visible representation of collected data
 The graph should have a title.
 The scales of the axes should be suitable – there should not be any
sudden or uneven jumps in the numbers.
 The inclusion of the origin has been thought about. You can always
draw a second graph without it if necessary.
 The final graph should cover more than half the paper in either
direction.
 The axes are labeled with both the quantity and units
 The points are clear. Vertical and horizontal lines to make crosses
are better than 45 degrees crosses or dots.
 All the points been plotted correctly.
 Error bars are included if necessary.
 A best fit line is added. (It is there to show overall trend.)
 If best fit line is a curve, this has been drawn as a single smooth line.
 As a general rule, there should be roughly the same number of
points above the line as below the line.
 Any points that do not agree with the best fit line have been
identified.
A best plotted graph have…
Gradient and intercept
 Intercept
 A straight line graph can only intercept (cut) either axis once
and often it is
y – intercept.
 if a graph has an intercept of zero it goes through the origin.
(proportional)
y intercept
Gradient or slope
It is the ratio of change in y – axis to the change in x – axis. i.e. m = ∆y
∆x
A straight line graph has a constant gradient.
The triangle used to calculate the gradient should be as large as possible.
The gradient has units.
The gradient of a curve at any particular point is gradient of the tangent to the
curve at that point.
 Area under a graph
 it is the product of quantity on y axis and by the quantity on x axis.
 i.e. Area = quantity on y X quantity on x
 If the graph is a curve, the area can be calculated by counting the
squares and working out what one square represents.
 The units for the area under graph are the units on the y axis multiplied
by the units on the x axis.
Uncertainties in graphs
 Uncertainties in graphs can be shown as error bars
 Uncertainties are many types.
 With analog instruments, such as rulers, you would add onto the end of a
value a plus or minus half the value of the last digit, eg. on a ruler with
1mm precision, you would put +/- .5mm.
 Digital instruments use a different system, where it is plus or minus the
value of the last digit, eg. with an electronic scale that reads 291g, the
uncertainty would be +/- 1g.
 We take a time of 8.06 s with a stopwatch that measures 1/100 seconds,
so half the limit of reading would be 0.005 s. But we know from
experience that our reaction time is longer than that, so we estimate it to
for example 0.10 s, and have the result 8.060.1s.
 If we have several (at least about 5) measurements of the same
thing, we can use the highest residual as an absolute uncertainty. A
residual = the absolute value of the difference between a reading
and the average of the readings.
 Ex. Five people measure the mass of an object. The results are 0.56
g, 0.58 g, 0.58 g, 0.55 g, 0.59g.
The average is (0.56g + 0.58g + 0.58g + 0.55g + 0.59g)/5 = 0.572g
 The residuals are 0.56g - 0.572g = (-) 0.012g, 0.58g - 0.572g =
0.008g, 0.58g - 0.572g = 0.008g, 0.55g - 0.572 g = (-)0.022 g, 0.59g
- 0.572g = 0.018g
 Then the measurement is m = 0.572g0.022g or sometimes
0.570.02g (uncertainties are usually approximated to one
significant digit).
Scalars and Vectors
 Scalar quantities are those which have
magnitude(or size) alone. They can be
expressed as number (albeit with unit) and use
the rule of algebra when dealing with them.
 Vector quantities are those which have both
magnitude and direction. They follow the
vector algebra while doing various
mathematical operations.
VECTOR ADDITION
VECTOR RESOLUTION
Questions/Discussions
Work sheet uploaded in Edmodo.
ToK question: How far you are certain
about the fundamentality of the
fundamental units chosen by the S.I
system ?
Assessment : Prepare a report of
various units of time used by
different people in different regions
and different era. Discuss about the
validity compared to the system that
we are following now.
Bibiliography
 IBDP Physics , K.A. Tsokos ,
 ibgrade11physicslesson1-
measurementsanduncertainities-
140923050820-phpapp01
 Physics and Physical measurement by Sivram
Sarma
 https://ibphysics2016.wikispaces.com/Topic+4
+%28Core%29?responseToken=dfed03029cc
c501d0ce99f468a06a0e4

Measurement and uncertainty

  • 1.
  • 2.
    Information  Content  Physicalquantities  Units  Scalars and vectors  Significant figures  Errors  Uncertainty  Plotting the graph  Assessments  Lab work – Measuring the density of an object.  Work sheet  Go formative - http://goformative.co m/teacher/#/assign ments/WNCM796/e dit?assign
  • 3.
    Physical quantity  Natureprovides different experiences to the mankind , Phenomena.  These experiences which are measurable scientifically termed as Physical quantities.  we have two types of physical quantities.  Fundamental quantities  Derived quantities
  • 4.
    Physical quantities  Theyare the basic quantities using which we can derive all other quantities.  These are independent  Eg: Mass, Length, Time  They are dependent on fundamental quantities.  Eg: area, volume, density, force,…. Fundamental Derived
  • 5.
    Units  A quantityused as a standard of measurement. Example: Units of time are second, minute, hour, day, week, month, year and decade.
  • 6.
  • 7.
    Units of length? Lightyear, light second, parsec, AU, mile, furlong, fathom, yard, feet, inches, Angstroms, nautical miles, cubits, cm, mm, km, μm, nm, ?
  • 8.
    The SI systemof units There are seven fundamental base units which are clearly defined and on which all other derived units are based: You need to know these, but not their definitions.
  • 9.
    The metre  Thisis the unit of distance. It is the distance traveled by light in a vacuum in a time of 1/299792458 seconds.
  • 10.
    The second  Thisis the unit of time. A second is the duration of 9192631770 full oscillations of the electromagnetic radiation emitted in a transition between two hyperfine energy levels in the ground state of a caesium-133 atom.  https://www.youtube.com/watch?annotation_id=annotation_2965246921&feature=iv&index=90&list=PLMrtJn- MOYmfqNgyPxx6NYMZnd25y4shc&src_vid=r7x-RGfd0Yk&v=NXRVtfCpLr4
  • 11.
    The ampere  Thisis the unit of electrical current. It is defined as that current which, when flowing in two parallel conductors 1 m apart, produces a force of 2 x 10⁻⁷ N on a length of 1 m of the conductors. Note that the Coulomb is NOT a base unit.
  • 12.
    The kelvin  Thisis the unit of temperature. It is 1/273.16 of the thermodynamic temperature of the triple point of water.
  • 13.
    The mole  Onemole of a substance contains as many molecules as there are atoms in 12 g of carbon-12. This special number of molecules is called Avogadro’s number and equals 6.02 x 10²³.
  • 14.
    The candela (notused in IB)  This is the unit of luminous intensity. It is the intensity of a source of frequency 5.40 x 10¹⁴ Hz emitting 1/683 W per steradian.
  • 15.
    The kilogram  Thisis the unit of mass. It is the mass of a certain quantity of a platinum-iridium alloy kept at the Bureau International des Poids et Mesures in France. THE kilogram!
  • 16.
    SI Base Units QuantityUnit distance metre time second current ampere temperature kelvin quantity of substance mole luminous intensity candela mass kilogram Can you copy this please? Note: No Newton or Coulomb
  • 17.
    Derived units Other physicalquantities have units that are combinations of the fundamental units. Speed = distance/time = m s-1 Acceleration = m s-2 Force = mass x acceleration = kg m s-2 (called a Newton) (note in IB or AS level, we write m s-1 rather than m/s)
  • 18.
    Order of magnitude This is power of 10  It is helpful to avoid getting lost among the numbers  Eg. The diameter of an atom, 10-10m does not sound much larger than diameter of proton in its nucleus, 10-15m.  But the ratio between them is 105 or 100000 times bigger. This is we say a difference of 5 orders of magnitude’ https://www.youtube.com/watch?v=bhofN1xX6u0 https://www.youtube.com/watch?v=UDAtFVsZXTc http://joemonster.org/gry/41805 Interactive for order of magnitude.
  • 19.
    Range of masses 10-31Kg electron Grain of sand/ Blood corpuscle 10-8 Mass of the earth 1024 1028 Mass of Milky way galaxy 1040 1044 Mass of the Observed universe 1052 Most fundamental particle is quark and it hides inside proton and neutron. the lightest quark is up quark , whose mass is about 10-30 kg.
  • 20.
    Range of lengths 10-15m Diameter of proton Diameter of atom 10-10 Radius of the earth 106 108 Distance of Earth to sun 1010 1012 Radius of Observed universe 1026 There is a much smaller fundamental unit of length, Planck length, which is around 10-35 m.
  • 21.
    Range of Time 10-2410-22 Passage of Light across A nucleus Passage of Light across An atom 10-20 10-18 Passage of Light across A room 10-8 Heart beat 100 1016 1018 Age of the earth s1018 1020 Age of the universe What is theoretical lower limit of time? Estimation – what is ratio of rest mass of proton to rest mass of electron?
  • 22.
    Estimate the following: 1.The mass of an apple 2. The number of times a human heart beats in a lifetime. 3. The speed a cockroach can run. 4. The number of times the earth will fit into the sun (Rs = 6.96 x 10⁸ m, Re = 6.35 x 10⁶ m) (to the nearest order of magnitude)
  • 23.
    Estimate the following: 1.The mass of an apple 10-1 kg 2. The number of times a human heart beats in a lifetime. 3. The speed a cockroach can run. 4. The number of times the earth will fit into the sun (Rs = 6.96 x 10⁸, Re = 6.35 x 10⁶) (to the nearest order of magnitude)
  • 24.
    Estimate the following: 1.The mass of an apple 10-1 kg 2. The number of times a human heart beats in a lifetime. 70x60x24x365x70=109 3. The speed a cockroach can run. 4. The number of times the earth will fit into the sun (Rs = 6.96 x 10⁸, Re = 6.35 x 10⁶) (to the nearest order of magnitude)
  • 25.
    Estimate the following: 1.The mass of an apple 10-1 kg 2. The number of times a human heart beats in a lifetime. 70x60x24x365x70=109 3. The speed a cockroach can run. 100 m/s 4. The number of times the earth will fit into the sun (Rs = 6.96 x 10⁸, Re = 6.35 x 10⁶) (to the nearest order of magnitude)
  • 26.
    Estimate the following: 1.The mass of an apple 10-1 kg 2. The number of times a human heart beats in a lifetime. 70x60x24x365x70=109 3. The speed a cockroach can run. 100 m/s 4. The number of times the earth will fit into the sun (6.96 x 10⁸)3/(6.35 x 106)3 = 106 (to the nearest order of magnitude)
  • 27.
    Significant figures  Theseare number of digits up to which we are sure about their accuracy.  Significant figures do not change if we measure a physical quantity in different units.  E.g. 14.5 cm = 0.145 m = 14.5 X 10⁻² m Here three values have same significant figures i.e. 3
  • 28.
    Rules for significantfigures 1. All non zero digits are significant figures.  17 - 2  178 - 3 2. All zeros occurring between non zero digits are significant figures.  401 - 3  40056 - 5 3. All zeros to the right of the last non zero digit are not significant figures.  20 - 1  20350 - 4
  • 29.
    4. All zerosto the right of a decimal point and to the left of a non zero digit are not significant figures.  0.04 - 1  0.0045 - 2 5. All zeros to the right of a decimal point and to the right of a non zero digit are significant figures.  0.20 - 2  0.2370 - 4
  • 30.
    Uncertainty or error inmeasurement  The difference in the true value and measured value is called error.  Types of error  Random error  Systematic error Random error  usually random errors are caused by the person doing the experiment.  Causes –  changes in the experimental conditions like temp, pressure or humidity etc..  A different person reading the instrument  Malfunction of a piece of apparatus
  • 31.
     Systematic error This error is due to the system or apparatus being used.  Causes –  An observer consistently making the same mistake  An instrument with zero error  Apparatus calibrated incorrectly  How to avoid the errors? Random errors can be reduced by repeating the measurement many times and taking the average, but this process will not effect systematic errors.  An accurate experiment is one that has a small systematic error, where as a precise experiment is one that has a small random error.
  • 32.
    Precision and Accuracyin Measurements  Precision How reproducible are measurements?  Accuracy How close are the measurements to the true value.
  • 33.
    33 Dartboard analogy to Precisionand accuracy  A person throwing darts, trying to hit the bulls-eye, his results may be…. Not accurate Not precise Accurate Not precise Not accurate Precise Accurate Precise
  • 34.
     Absolute error(Absolute uncertainty) – It is the magnitude of difference between true value of quantity and the measurement value. If p is the measured quantity then absolute error expressed as ± ∆p  Relative error (Fractional uncertainty)– The ratio of absolute error to the true value of the physical quantity is called relative error. Here ± ∆p is the relative error. P  Percentage error (Percentage Uncertainty) – relative error X 100% = ± ∆p X 100 % P Mathematical representation of uncertainties
  • 35.
     Uncertainty inAddition and Subtraction A, B are two quantities and Z = A + B or Z = A - B ∆A, ∆B, ∆Z are uncertainties in A, B, Z respectively then ∆Z = ∆A + ∆B  Uncertainty in Multiplication and Division A, B are two quantities and Z = A X B or Z = A / B ∆A, ∆B, ∆Z are uncertainties in A, B, Z respectively then ∆Z = ∆A + ∆B Z A B  Uncertainty in powers A is quantity and Z = An then ∆Z = n ∆A Z A
  • 36.
    Graphs introduction Graphs arethe visible representation of collected data  The graph should have a title.  The scales of the axes should be suitable – there should not be any sudden or uneven jumps in the numbers.  The inclusion of the origin has been thought about. You can always draw a second graph without it if necessary.  The final graph should cover more than half the paper in either direction.  The axes are labeled with both the quantity and units  The points are clear. Vertical and horizontal lines to make crosses are better than 45 degrees crosses or dots.
  • 37.
     All thepoints been plotted correctly.  Error bars are included if necessary.  A best fit line is added. (It is there to show overall trend.)  If best fit line is a curve, this has been drawn as a single smooth line.  As a general rule, there should be roughly the same number of points above the line as below the line.  Any points that do not agree with the best fit line have been identified. A best plotted graph have…
  • 38.
    Gradient and intercept Intercept  A straight line graph can only intercept (cut) either axis once and often it is y – intercept.  if a graph has an intercept of zero it goes through the origin. (proportional) y intercept Gradient or slope It is the ratio of change in y – axis to the change in x – axis. i.e. m = ∆y ∆x A straight line graph has a constant gradient. The triangle used to calculate the gradient should be as large as possible. The gradient has units. The gradient of a curve at any particular point is gradient of the tangent to the curve at that point.
  • 39.
     Area undera graph  it is the product of quantity on y axis and by the quantity on x axis.  i.e. Area = quantity on y X quantity on x  If the graph is a curve, the area can be calculated by counting the squares and working out what one square represents.  The units for the area under graph are the units on the y axis multiplied by the units on the x axis.
  • 40.
    Uncertainties in graphs Uncertainties in graphs can be shown as error bars  Uncertainties are many types.  With analog instruments, such as rulers, you would add onto the end of a value a plus or minus half the value of the last digit, eg. on a ruler with 1mm precision, you would put +/- .5mm.  Digital instruments use a different system, where it is plus or minus the value of the last digit, eg. with an electronic scale that reads 291g, the uncertainty would be +/- 1g.  We take a time of 8.06 s with a stopwatch that measures 1/100 seconds, so half the limit of reading would be 0.005 s. But we know from experience that our reaction time is longer than that, so we estimate it to for example 0.10 s, and have the result 8.060.1s.
  • 41.
     If wehave several (at least about 5) measurements of the same thing, we can use the highest residual as an absolute uncertainty. A residual = the absolute value of the difference between a reading and the average of the readings.  Ex. Five people measure the mass of an object. The results are 0.56 g, 0.58 g, 0.58 g, 0.55 g, 0.59g. The average is (0.56g + 0.58g + 0.58g + 0.55g + 0.59g)/5 = 0.572g  The residuals are 0.56g - 0.572g = (-) 0.012g, 0.58g - 0.572g = 0.008g, 0.58g - 0.572g = 0.008g, 0.55g - 0.572 g = (-)0.022 g, 0.59g - 0.572g = 0.018g  Then the measurement is m = 0.572g0.022g or sometimes 0.570.02g (uncertainties are usually approximated to one significant digit).
  • 43.
    Scalars and Vectors Scalar quantities are those which have magnitude(or size) alone. They can be expressed as number (albeit with unit) and use the rule of algebra when dealing with them.  Vector quantities are those which have both magnitude and direction. They follow the vector algebra while doing various mathematical operations.
  • 46.
  • 48.
  • 49.
    Questions/Discussions Work sheet uploadedin Edmodo. ToK question: How far you are certain about the fundamentality of the fundamental units chosen by the S.I system ? Assessment : Prepare a report of various units of time used by different people in different regions and different era. Discuss about the validity compared to the system that we are following now.
  • 50.
    Bibiliography  IBDP Physics, K.A. Tsokos ,  ibgrade11physicslesson1- measurementsanduncertainities- 140923050820-phpapp01  Physics and Physical measurement by Sivram Sarma  https://ibphysics2016.wikispaces.com/Topic+4 +%28Core%29?responseToken=dfed03029cc c501d0ce99f468a06a0e4