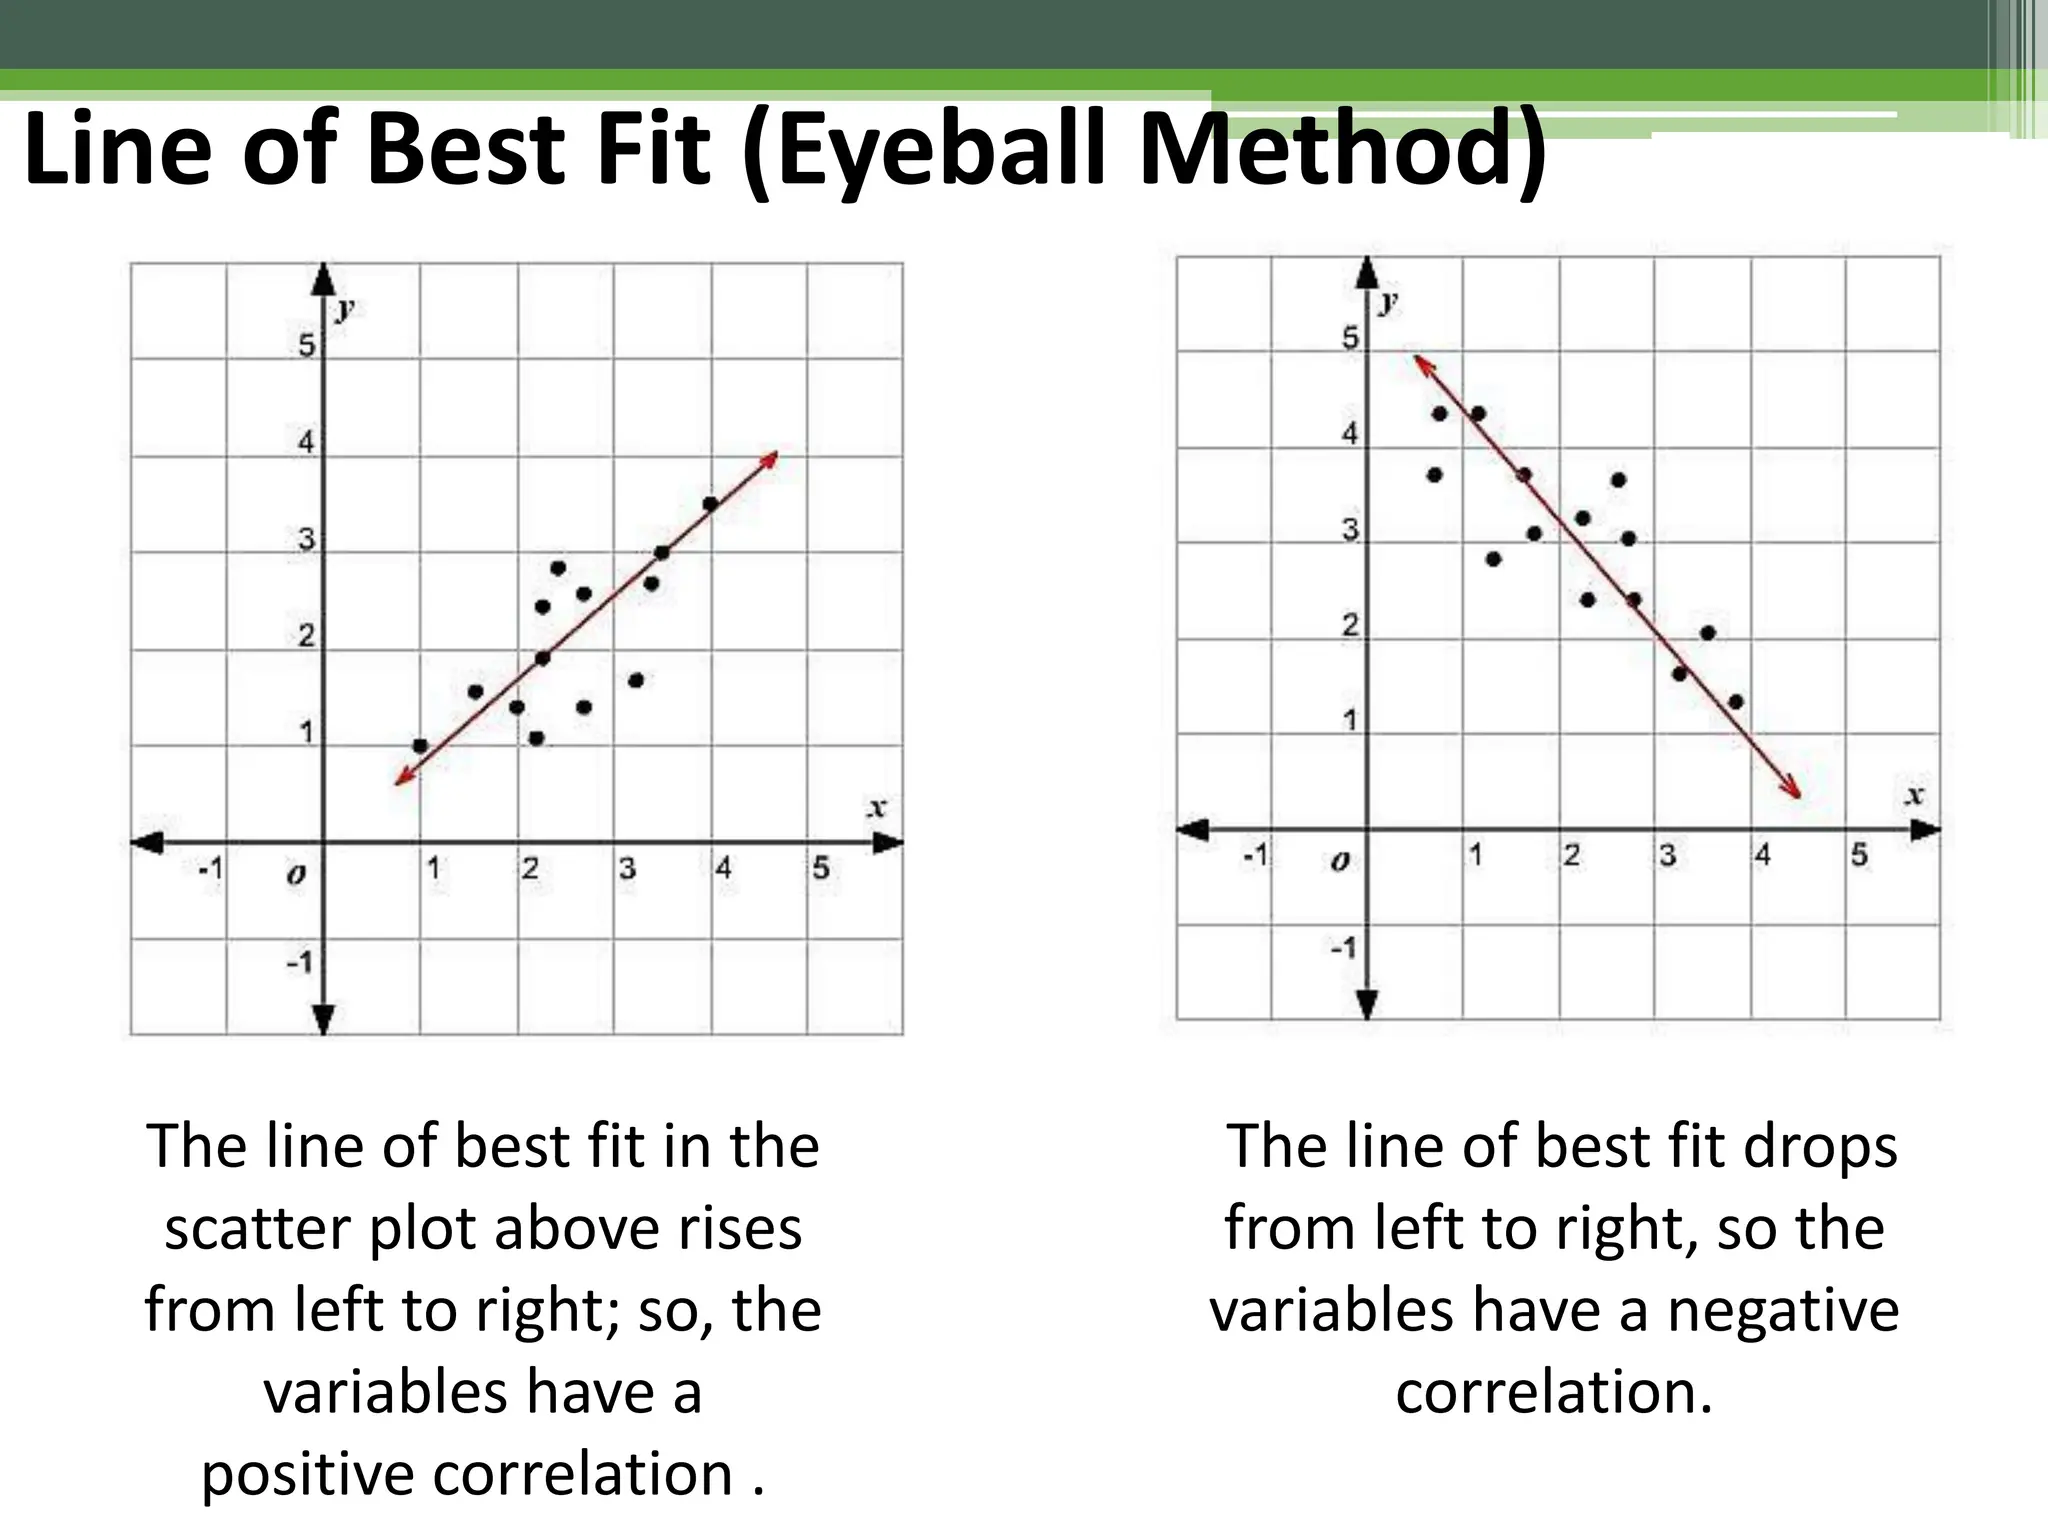
General Physics 1
Units
Physical Quantities
Measurement
Graphical Presentations
Linear Fitting of Data
Introduction
The phenomena of Nature have been found to obey certain
physical laws; one of the primary goals of physics research is to
discover those laws. It has been known for several centuries that
the laws of physics are appropriately expressed in the language
of mathematics, so physics and mathematics have enjoyed a
close connection for quite a long time.
In order to connect the physical world to the mathematical
world, we need to make measurements of the real world. In
making a measurement, we compare a physical quantity with
some agreed-upon standard, and determine how many such
standard units are present.
Introduction
It is important that we have very precise definitions of physical
units—not only for scientific use, but also for trade and
commerce. In practice, we define a few base units, and derive
other units from combinations of those base units.
Base Units
1. Meter
2. Kilogram
3. Second
4. Ampere
5. Kelvin
6. Candela
7. Mole
Systems of Measurement
1. English System
2. SI System
Introduction
Système International (SI) Prefixes
Unit Conversions
A simple unit conversion involves only one conversion factor.
Example. Convert 7 feet to inches.
First write down the unit conversion factor as a ratio, filling in the
units as needed:
Notice that the units of feet cancel out, leaving units of inches. The
next step is to fill in numbers so that the same length is in the
numerator and denominator:
Unit Conversions
More complex conversions may involve more than one
conversion factor. You’ll need to think about what conversion
factors you know, then put together a chain of them to get to the
units you want.
Example. Convert 60 miles per hour to feet per second.
Write down a chain of conversion factor ratios, filling in units so that
they cancel out correctly:
Units cancel out to leave ft/sec. Now fill in the numbers, putting the
same length in the numerator and denominator in the first factor, and
the same time in the numerator and denominator in the second factor:
Unit Conversions
Conversions Involving Powers
Occasionally we need to do something like convert an area or
volume when we know only the length conversion factor.
Example. Convert 2000 cubic feet to gallons.
We know the conversion factor between
gallons and cubic inches. We don’t know the conversion factor
between cubic feet and cubic inches, but we can convert between
feet and inches. The conversion factors will look like this:
Unit Conversions
Problems on Conversion of Units
1. If you are walking at a rate of 2.8 m/s, what is your
speed in kph?
2. The world’s largest cut diamond is the First Star of
Africa. Its volume is 1.84 cubic inches. What is its
volume in cubic meters? In milliliters?
3. The human body can survive an acceleration of -250
m/s2. What is its acceleration in k/h2 and mi/h2?
Accuracy and Precision
Accuracy is a measure of how close a measurement comes to the
actual or true value of whatever is measured. (closest to TRUE Value)
Precision is a measure of how close a series of measurements are to
one another. (repeated Save Value)
Random Errors and Systematic errors
All experimental uncertainty is due to either random errors or
systematic errors.
Random errors are statistical fluctuations (in either direction) in the
measured data due to the precision limitations of the measurement
device. Random errors usually result from the experimenter's
inability to take the same measurement in exactly the same way to
get exact the same number.
Example: You measure the mass of a ring three times using the same
balance and get slightly different values: 17.46 g, 17.42 g, 17.44 g. It is
an accidental error and is beyond the control of the person making
measurement.
Random errors can be evaluated through statistical analysis and can
be reduced by averaging over a large number of observations.
Random Errors and Systematic errors
Systematic errors, by contrast, are reproducible inaccuracies that are
consistently in the same direction. Systematic errors are often due to
a problem which persists throughout the entire experiment. It arises
due to defect in the measuring device.
Example: The electronic scale you use reads 0.05 g too high for all
your mass measurements (because it is improperly set throughout
your experiment).
In reporting a measurement value, one often performs several trials
and calculates the average of the measurements to report a
representative value. The repeated measurements have a range of
values due to several possible sources. For instance, with the use of a
tape measure, a length measurement may vary due to the fact that
the tape measure is not stretched straight in the same manner in all
trials.
What is the height of a table?
A volunteer uses a tape measure to estimate the height of the
teacher’s table. Should this be reported in millimeters? Centimeters?
Meters? Kilometers?
The choice of units can be settled by agreement. However, there are
times when the unit chosen is considered most applicable when the
choice allows easy access to a mental estimate. Thus, a pencil is
measured in centimeters and roads are measured in kilometers.
Least Count
The smallest value that can be measured by the measuring
instrument is called its least count.
The least count is related to the precision of an instrument; an
instrument that can measure smaller changes in a value relative to
another instrument, has a smaller "least count" value and so is more
precise. The least count of an instrument is inversely proportional to
the precision of the instrument.
For example, a stopwatch of Peter has the least count of minute while
John’s stopwatch used to time a race down to second, its least count.
Least count of an instrument is one of the very important tools in
order to get accurate readings of instruments like vernier caliper and
screw gauge.
Significant Figures
The significant figures in a measurement include all of the digits that
are known, plus a last digit that is estimated.
Significant Figures relate to the certainty of a measurement – The
PRECISION of the measurement.
Precision = Same REPEATABLE Value (Certainty)
More Sig Figs = more certainty = greater precision
Significant Figures (Sig Figs) = Known + ESTIMATE
Significant Figures
Which measurement has the most certainty and greatest PRECISION?
_ 1 sig fig (.6 is the estimate)
_ 2 sig figs (.01 is the estimate)
_ 3 sig figs
Rule No. 1: Is the decimal PRESENT or ABSENT
Decimal is
PRESENT
Decimal is
ABSENT
Find the first
NON-Zero
number starting
from the Left
Then count all
numbers to the
Right
Find the first
NON-Zero
number starting
from the Right
Then count all
numbers to the
Left
47.3 = __ S.F.
3
0.0021 = 2 S.F
1.200 = 4 S.F
36 = 2 S.F
2400 = 2 S.F
0.0600 = 3 S.F
104,000 = 3 S.F
Significant Figures
Rule No. 2: Every digit in scientific notation is Significant
Significant Figures
47.3 = 3 S.F
0.0021 = 2 S.F
1.200 = 4 S.F
36 = 2 S.F
2400 = 2 S.F
0.0600 = 3 S.F
104,000 = 3 S.F
4.73 x 101
2.1 x 10⁻³
1.200 x 100
3.6 x 101
2.4 x 10³
6.00 x 10⁻²
1.04 x 10⁵
Rule No. 3: Any number that is counted is an EXACT
number and has UNLIMITED significant digits. There is
no ESTIMATED number.
Significant Figures
I have three cats = 3 Cats
____S.F
Unlimited
Significant Figures
= __ S.F
= 5 S.F
= 4 S.F
= 5 S.F
= Unlimited
= 2 S.F
3
Uncertainty
The absolute uncertainty is the size of the range of values in which
the "true value" of the measurement probably lies. The uncertainty
of a single instrument is half of the least count.
If the least count of a weighing scale is 1 kg and your mass on that
device is 62 kg, how are you going to write your mass if you will
include the uncertainty?
Uncertainty
Addition and subtraction
When performing additions and subtractions we simply
need to add together the absolute uncertainties.
Example:
Add the values
l1 = 1.2 ± 0.1m
l2 = 12.01 ± 0.01m
l3 = 7.21 ± 0.01m
1.2m + 12.01m + 7.21m = 20.42m
0.1 + 0.01 + 0.01 = 0.12
20.42m ± 0.12
Uncertainty
Multiplication, division and powers
When performing multiplications and divisions, or, dealing with
powers, we simply add together the percentage uncertainties.
Example:
Multiply the values l1 = 1.2 ± 0.1m and l2 = 12.01 ± 0.01m
A = lw = 1.2m x 12.01m = 14.4 m2
PU1 = (0.1 / 1.2)(100) = 8.33 %
PU2 = (0.01 / 12.01)(100) = 0.083%
PU12 = 8.33 + 0.083 = 8.41 %
14.4m2 ± 1.2
± 8.4 %
Uncertainty
The two sides of a rectangle are measured to be
19 ± 0.5 cm and 15 ± 0.5 cm.
What is the perimeter of the rectangle?
What is the area of the rectangle?
Line of Best Fit (Eyeball Method)
A line of best fit is a line drawn through the
maximum number of points on a scatter plot
balancing about an equal number of points
above and below the line.
It is used to study the nature of relation
between two variables.
Line of Best Fit (Eyeball Method)
The line of best fit in the
scatter plot above rises
from left to right; so, the
variables have a
positive correlation .
The line of best fit drops
from left to right, so the
variables have a negative
correlation.
Line of Best Fit (Eyeball Method)
X Y
5 14
6 16
12 9
5 17
13 8
7 15
14 5
8 13
3 20
4 17
11 11
9 12
10 12
8 14
Line of Best Fit (Eyeball Method)

General_Physics_physical_.quantities measurements

  • 1.
    General Physics 1 Units PhysicalQuantities Measurement Graphical Presentations Linear Fitting of Data
  • 2.
    Introduction The phenomena ofNature have been found to obey certain physical laws; one of the primary goals of physics research is to discover those laws. It has been known for several centuries that the laws of physics are appropriately expressed in the language of mathematics, so physics and mathematics have enjoyed a close connection for quite a long time. In order to connect the physical world to the mathematical world, we need to make measurements of the real world. In making a measurement, we compare a physical quantity with some agreed-upon standard, and determine how many such standard units are present.
  • 3.
    Introduction It is importantthat we have very precise definitions of physical units—not only for scientific use, but also for trade and commerce. In practice, we define a few base units, and derive other units from combinations of those base units. Base Units 1. Meter 2. Kilogram 3. Second 4. Ampere 5. Kelvin 6. Candela 7. Mole Systems of Measurement 1. English System 2. SI System
  • 4.
  • 5.
    Unit Conversions A simpleunit conversion involves only one conversion factor. Example. Convert 7 feet to inches. First write down the unit conversion factor as a ratio, filling in the units as needed: Notice that the units of feet cancel out, leaving units of inches. The next step is to fill in numbers so that the same length is in the numerator and denominator:
  • 6.
    Unit Conversions More complexconversions may involve more than one conversion factor. You’ll need to think about what conversion factors you know, then put together a chain of them to get to the units you want. Example. Convert 60 miles per hour to feet per second. Write down a chain of conversion factor ratios, filling in units so that they cancel out correctly: Units cancel out to leave ft/sec. Now fill in the numbers, putting the same length in the numerator and denominator in the first factor, and the same time in the numerator and denominator in the second factor:
  • 7.
    Unit Conversions Conversions InvolvingPowers Occasionally we need to do something like convert an area or volume when we know only the length conversion factor. Example. Convert 2000 cubic feet to gallons. We know the conversion factor between gallons and cubic inches. We don’t know the conversion factor between cubic feet and cubic inches, but we can convert between feet and inches. The conversion factors will look like this:
  • 8.
    Unit Conversions Problems onConversion of Units 1. If you are walking at a rate of 2.8 m/s, what is your speed in kph? 2. The world’s largest cut diamond is the First Star of Africa. Its volume is 1.84 cubic inches. What is its volume in cubic meters? In milliliters? 3. The human body can survive an acceleration of -250 m/s2. What is its acceleration in k/h2 and mi/h2?
  • 9.
    Accuracy and Precision Accuracyis a measure of how close a measurement comes to the actual or true value of whatever is measured. (closest to TRUE Value) Precision is a measure of how close a series of measurements are to one another. (repeated Save Value)
  • 10.
    Random Errors andSystematic errors All experimental uncertainty is due to either random errors or systematic errors. Random errors are statistical fluctuations (in either direction) in the measured data due to the precision limitations of the measurement device. Random errors usually result from the experimenter's inability to take the same measurement in exactly the same way to get exact the same number. Example: You measure the mass of a ring three times using the same balance and get slightly different values: 17.46 g, 17.42 g, 17.44 g. It is an accidental error and is beyond the control of the person making measurement. Random errors can be evaluated through statistical analysis and can be reduced by averaging over a large number of observations.
  • 11.
    Random Errors andSystematic errors Systematic errors, by contrast, are reproducible inaccuracies that are consistently in the same direction. Systematic errors are often due to a problem which persists throughout the entire experiment. It arises due to defect in the measuring device. Example: The electronic scale you use reads 0.05 g too high for all your mass measurements (because it is improperly set throughout your experiment).
  • 12.
    In reporting ameasurement value, one often performs several trials and calculates the average of the measurements to report a representative value. The repeated measurements have a range of values due to several possible sources. For instance, with the use of a tape measure, a length measurement may vary due to the fact that the tape measure is not stretched straight in the same manner in all trials. What is the height of a table? A volunteer uses a tape measure to estimate the height of the teacher’s table. Should this be reported in millimeters? Centimeters? Meters? Kilometers? The choice of units can be settled by agreement. However, there are times when the unit chosen is considered most applicable when the choice allows easy access to a mental estimate. Thus, a pencil is measured in centimeters and roads are measured in kilometers.
  • 13.
    Least Count The smallestvalue that can be measured by the measuring instrument is called its least count. The least count is related to the precision of an instrument; an instrument that can measure smaller changes in a value relative to another instrument, has a smaller "least count" value and so is more precise. The least count of an instrument is inversely proportional to the precision of the instrument. For example, a stopwatch of Peter has the least count of minute while John’s stopwatch used to time a race down to second, its least count. Least count of an instrument is one of the very important tools in order to get accurate readings of instruments like vernier caliper and screw gauge.
  • 14.
    Significant Figures The significantfigures in a measurement include all of the digits that are known, plus a last digit that is estimated. Significant Figures relate to the certainty of a measurement – The PRECISION of the measurement. Precision = Same REPEATABLE Value (Certainty) More Sig Figs = more certainty = greater precision Significant Figures (Sig Figs) = Known + ESTIMATE
  • 15.
    Significant Figures Which measurementhas the most certainty and greatest PRECISION? _ 1 sig fig (.6 is the estimate) _ 2 sig figs (.01 is the estimate) _ 3 sig figs
  • 16.
    Rule No. 1:Is the decimal PRESENT or ABSENT Decimal is PRESENT Decimal is ABSENT Find the first NON-Zero number starting from the Left Then count all numbers to the Right Find the first NON-Zero number starting from the Right Then count all numbers to the Left 47.3 = __ S.F. 3 0.0021 = 2 S.F 1.200 = 4 S.F 36 = 2 S.F 2400 = 2 S.F 0.0600 = 3 S.F 104,000 = 3 S.F Significant Figures
  • 17.
    Rule No. 2:Every digit in scientific notation is Significant Significant Figures 47.3 = 3 S.F 0.0021 = 2 S.F 1.200 = 4 S.F 36 = 2 S.F 2400 = 2 S.F 0.0600 = 3 S.F 104,000 = 3 S.F 4.73 x 101 2.1 x 10⁻³ 1.200 x 100 3.6 x 101 2.4 x 10³ 6.00 x 10⁻² 1.04 x 10⁵
  • 18.
    Rule No. 3:Any number that is counted is an EXACT number and has UNLIMITED significant digits. There is no ESTIMATED number. Significant Figures I have three cats = 3 Cats ____S.F Unlimited
  • 19.
    Significant Figures = __S.F = 5 S.F = 4 S.F = 5 S.F = Unlimited = 2 S.F 3
  • 20.
    Uncertainty The absolute uncertaintyis the size of the range of values in which the "true value" of the measurement probably lies. The uncertainty of a single instrument is half of the least count. If the least count of a weighing scale is 1 kg and your mass on that device is 62 kg, how are you going to write your mass if you will include the uncertainty?
  • 21.
    Uncertainty Addition and subtraction Whenperforming additions and subtractions we simply need to add together the absolute uncertainties. Example: Add the values l1 = 1.2 ± 0.1m l2 = 12.01 ± 0.01m l3 = 7.21 ± 0.01m 1.2m + 12.01m + 7.21m = 20.42m 0.1 + 0.01 + 0.01 = 0.12 20.42m ± 0.12
  • 22.
    Uncertainty Multiplication, division andpowers When performing multiplications and divisions, or, dealing with powers, we simply add together the percentage uncertainties. Example: Multiply the values l1 = 1.2 ± 0.1m and l2 = 12.01 ± 0.01m A = lw = 1.2m x 12.01m = 14.4 m2 PU1 = (0.1 / 1.2)(100) = 8.33 % PU2 = (0.01 / 12.01)(100) = 0.083% PU12 = 8.33 + 0.083 = 8.41 % 14.4m2 ± 1.2 ± 8.4 %
  • 23.
    Uncertainty The two sidesof a rectangle are measured to be 19 ± 0.5 cm and 15 ± 0.5 cm. What is the perimeter of the rectangle? What is the area of the rectangle?
  • 24.
    Line of BestFit (Eyeball Method) A line of best fit is a line drawn through the maximum number of points on a scatter plot balancing about an equal number of points above and below the line. It is used to study the nature of relation between two variables.
  • 25.
    Line of BestFit (Eyeball Method) The line of best fit in the scatter plot above rises from left to right; so, the variables have a positive correlation . The line of best fit drops from left to right, so the variables have a negative correlation.
  • 26.
    Line of BestFit (Eyeball Method) X Y 5 14 6 16 12 9 5 17 13 8 7 15 14 5 8 13 3 20 4 17 11 11 9 12 10 12 8 14
  • 27.
    Line of BestFit (Eyeball Method)