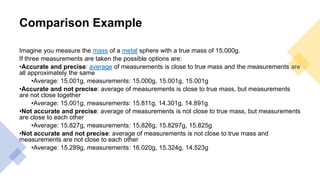
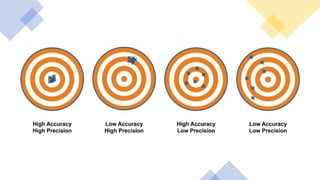
2. Errors
• There are two types of errors: random and systematic.
• Random error occurs due to chance. There is always some variability
some variability when a measurement is made.
• Random error may be caused by slight fluctuations in an instrument,
the environment, or the way a measurement is read, that do not cause
the same error every time.
• In order to address random error, scientists utilized replication.
• Replication is repeating a measurement many times and taking the
and taking the average.
3. • Systematic error gives measurements that are consistently
different from the true value in nature, often due to
instruments or the procedure.
• Instrumental error happens when the instruments being
used are inaccurate, such as a balance that does not work.
• Procedural error occurs when different procedures are
used to answer the same question and provide slightly
two people are rounding, and one rounds down and the
is procedural error.
• Human error is due to carelessness or to the limitations of
human ability. Two types of human error are
estimation error.
4.
5.
6.
7. Uncertainty — Overview &
Importance
• Measuring instruments and techniques are never
perfect which leads to some uncertainty.
Measurement uncertainty is the degree of error in a
measured value.
• All instruments have uncertainty in their measurements.
• Often, the instrument's owner's manual will tell you its
uncertainty.
• However, if it does not tell you, a general rule of thumb
is to use
1
2
unit of the smallest significant digit.
• For example, if you measure something to be 52.5 grams
your uncertainty would be 0.05 grams.
• Should be written as : 52.5𝑔 ± 0.05𝑔
8. Writing Uncertainties
• When we write our uncertainty we use the
format: measurement ± uncertainty.
• For example, let's say we measure the mass of a
substance to be 5.05 grams and our uncertainty is 0.04
grams.
• We would write our value as 5.05g ±0.04g.
• Our uncertainty tells us that we are confident that our
measurement lies between 5.01g and 5.09g.
9. Uncertainties and Significant
Figures
• Uncertainties follow the rules of significant figures.
• It is always the uncertain digit that sets the number of
significant figures. For example, you could not have a mass
of 5.05g ±0.1g.
• In this case, we would be saying that the tenths place is
uncertain.
• However, we were able to measure to the hundredths place.
• That does not make sense!
10. Calculating Uncertainties
• Eventually, you will use statistics to calculate your
uncertainty.
• You calculate uncertainty by taking multiple
measurements and then using the standard deviation.
• The number of measurements you should take will
depend on your level.
• 𝑢𝑛𝑐𝑒𝑟𝑡𝑎𝑖𝑛𝑖𝑡𝑦 =
1
2
∗ (𝑚𝑎𝑥𝑖𝑚𝑢𝑚 𝑣𝑎𝑙𝑢𝑒 − 𝑚𝑖𝑛𝑖𝑚𝑢𝑚 𝑣𝑎𝑙𝑢𝑒)
12. Uncertainties
in
Calculations
: Addition
and
Subtraction
• In some experiments, you will measure
multiple variables to use in a calculation.
• However, each measurement will have its own
uncertainty.
• When you must add or subtract measurements,
the units stay the same.
• When you have the same units, you add the
absolute uncertainties.
• Absolute uncertainties have the same units as
the measurement.
• Addition: 5.05g ±0.04g + 1.01g ±0.03g =
6.01g ±0.06g
• Subtraction: 5.05g ±0.04g - 1.01g ±0.03g =
4.04g ±0.06g
13. Uncertainties in Calculations : Multiplication &
Division
• When we do multiplication or
division, the units in our final answer
are different than our
measurements.
• When we multiply or divide, we
must convert our absolute
uncertainties to percentage
uncertainties.
• Once we have our percentage
uncertainties, we add them
together.
• Finally, we convert our relative
uncertainty back to an absolute
uncertainty:
• Final Answer:
9.29m3 ±4.65% → 9.29m3 ±0.44
m3
𝑎𝑏𝑠𝑜𝑙𝑢𝑡𝑒 𝑢𝑛𝑐𝑒𝑟𝑡𝑎𝑖𝑛𝑖𝑡𝑦 = 9.29 ×
465
100
= 0.44𝑚3
14. Uncertainties in Calculations : Raising
to the power
• If a measurement is raised to a power, for example squared or cubed, then
the percentage uncertainty is multiplied by that power to give the total
percentage uncertainty.
• Example:A builder wants to calculate the area of a square tile. He uses a
rule to measure the two adjacent sides of a square tile and obtains the
following results:
• Length of one side = 84 mm ± 0.5mm Length of perpendicular side = 84
mm ± 0.5mm.
• The percentage uncertainty in the length of each side of this square tile is
given by: Percentage uncertainty = (0.5/84) × 100% = 0.59 % = 0.6 %
• The area of the tile A is given by A = 84 × 84 = 7100 mm2
• Note that this is to 2 SF since the measurements are to 2 SF.
15. • Percentage uncertainty in A = 2 × 0.6% = 1.2%
• Therefore, the uncertainty in A = 7100 × 1.2% = 85 mm2
• So
• A = 7100 mm2 ± 1.2% or A = 7100 mm2 ± 85 mm
16. Accuracy and Precision
• Accuracy is how close the measured value is to the
correct value. Precision is how close repeated
measurements of the same object are to each other.
• When taking measurements of anything there can be
some measurement uncertainty due to limitations of
the measuring instrument or human error.
• There are 2 terms used to describe the amount of
uncertainty in a measurement.
• Accuracy: the closeness of a measured value to
the true value
• Precision: the closeness of different measured
values to each other
17. Comparison Example
Imagine you measure the mass of a metal sphere with a true mass of 15.000g.
If three measurements are taken the possible options are:
•Accurate and precise: average of measurements is close to true mass and the measurements are
all approximately the same
•Average: 15.001g, measurements: 15.000g, 15.001g, 15.001g
•Accurate and not precise: average of measurements is close to true mass, but measurements
are not close together
•Average: 15.001g, measurements: 15.811g, 14.301g, 14.891g
•Not accurate and precise: average of measurements is not close to true mass, but measurements
are close to each other
•Average: 15.827g, measurements: 15.826g, 15.8297g, 15.825g
•Not accurate and not precise: average of measurements is not close to true mass and
measurements are not close to each other
•Average: 15.289g, measurements: 16.020g, 15.324g, 14.523g