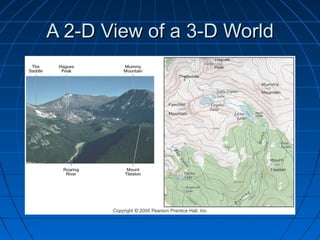
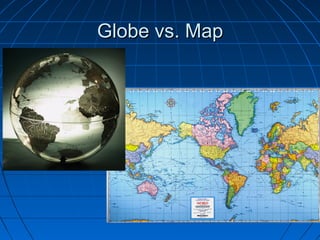
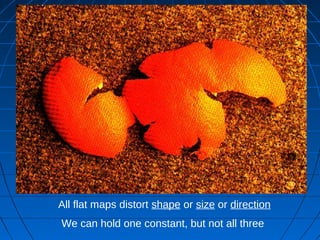
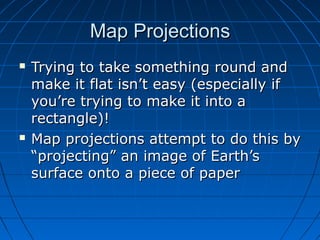
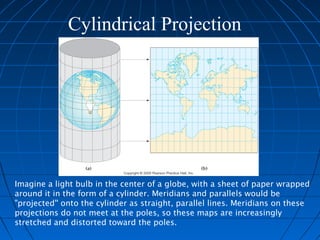
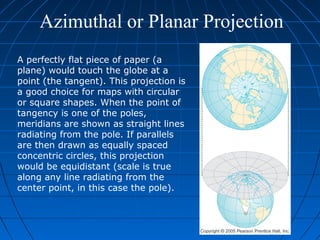
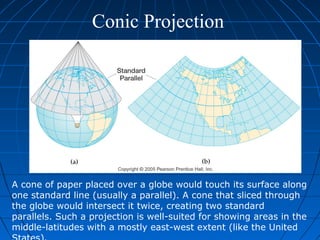
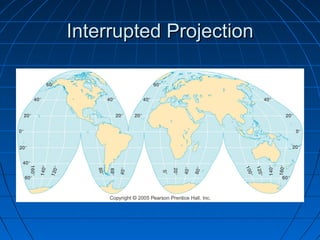
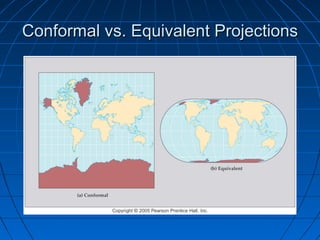
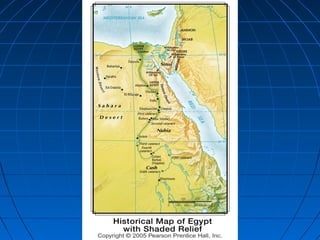
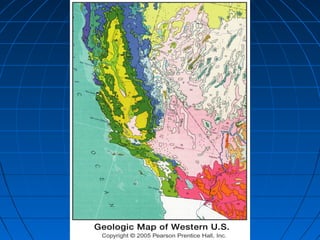
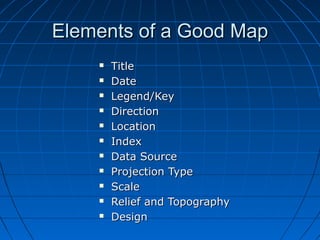
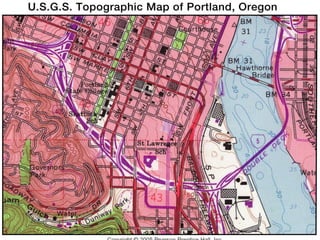
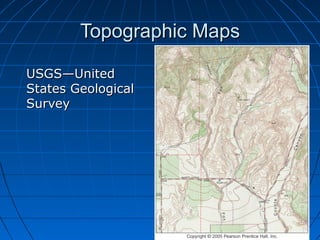
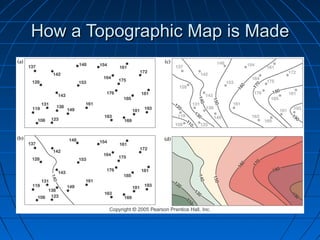
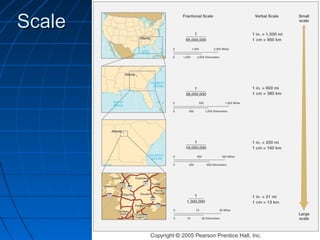
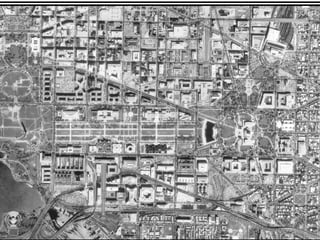
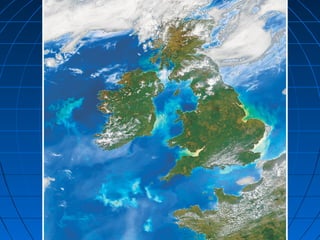
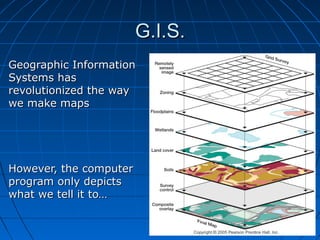
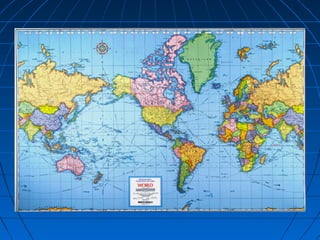
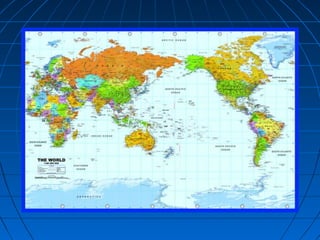
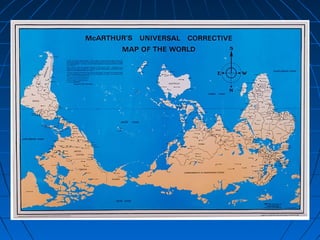
Maps—The Geographer’sMaps—The Geographer’s
ToolTool
Cartography: The art andCartography: The art and
science of making mapsscience of making maps
A 2-D View of a 3-D WorldA 2-D View of a 3-D World
Globe vs. MapGlobe vs. Map
All flat maps distort shape or size or direction
We can hold one constant, but not all three
Map ProjectionsMap Projections
 Trying to take something round andTrying to take something round and
make it flat isn’t easy (especially ifmake it flat isn’t easy (especially if
you’re trying to make it into ayou’re trying to make it into a
rectangle)!rectangle)!
 Map projections attempt to do this byMap projections attempt to do this by
“projecting” an image of Earth’s“projecting” an image of Earth’s
surface onto a piece of papersurface onto a piece of paper
Cylindrical Projection
Imagine a light bulb in the center of a globe, with a sheet of paper wrapped
around it in the form of a cylinder. Meridians and parallels would be
"projected'' onto the cylinder as straight, parallel lines. Meridians on these
projections do not meet at the poles, so these maps are increasingly
stretched and distorted toward the poles. 
Azimuthal or Planar Projection
A perfectly flat piece of paper (a
plane) would touch the globe at a
point (the tangent). This projection is
a good choice for maps with circular
or square shapes. When the point of
tangency is one of the poles,
meridians are shown as straight lines
radiating from the pole. If parallels
are then drawn as equally spaced
concentric circles, this projection
would be equidistant (scale is true
along any line radiating from the
center point, in this case the pole).
Conic Projection
A cone of paper placed over a globe would touch its surface along
one standard line (usually a parallel). A cone that sliced through
the globe would intersect it twice, creating two standard
parallels. Such a projection is well-suited for showing areas in the
middle-latitudes with a mostly east-west extent (like the United
Pseudocylindrical (or elliptical) projections normally have
straight parallels and curved meridians (usually equally spaced).
The Robinson Projection is a popular example. It was created to
make the world "look" right by keeping angular and areal
distortions to a minimum.
Pseudocylindrical Projection
Interrupted ProjectionInterrupted Projection
Conformal vs. Equivalent ProjectionsConformal vs. Equivalent Projections
““Reading” MapsReading” Maps
In order to find your way around aIn order to find your way around a
map, you need to know how standardmap, you need to know how standard
map coordinates are written:map coordinates are written:
As in:
37°21’41”N 122°7’41”W
(Lat.°) (min') (sec”) (N/S) (Long.°) (min') (sec”) (E/W)
Quick Quiz:Quick Quiz:
Which of the following is written incorrectly?Which of the following is written incorrectly?
a)a) 0º0º0º0º
b)b) 0º180º0º180º
c)c) 38ºS 120ºE38ºS 120ºE
d)d) 89º56’62”W 179º01’59”N89º56’62”W 179º01’59”N
Elements of a Good MapElements of a Good Map
All maps need certain characteristics in
order to be easily readable.

So what is it that makes a map
a “good” map?
Elements of a Good MapElements of a Good Map
 TitleTitle
 DateDate
 Legend/KeyLegend/Key
 DirectionDirection
 LocationLocation
 IndexIndex
 Data SourceData Source
 Projection TypeProjection Type
 ScaleScale
 Relief and TopographyRelief and Topography
 DesignDesign
Topographic MapsTopographic Maps
USGS—UnitedUSGS—United
States GeologicalStates Geological
SurveySurvey
How a Topographic Map is MadeHow a Topographic Map is Made
IsolinesIsolines
 Four basic characteristics:Four basic characteristics:
 1. Isolines always form closed shapes. The connecting1. Isolines always form closed shapes. The connecting
section may be cut off at the edges of the map, but atsection may be cut off at the edges of the map, but at
some point all isolines meet and close.some point all isolines meet and close.
 2. Except in rare cases (such as an overhanging cliff),2. Except in rare cases (such as an overhanging cliff),
isolines do not cross.isolines do not cross.
 3. The elevation difference between one isoline and the3. The elevation difference between one isoline and the
next is called an “interval”. Intervals may differ betweennext is called an “interval”. Intervals may differ between
maps, but are usually the same throughout any one map.maps, but are usually the same throughout any one map.
 4. Where isolines are close together, there is a steep4. Where isolines are close together, there is a steep
gradientgradient, or slope, or a rapid change of some sort. Where, or slope, or a rapid change of some sort. Where
they are further apart, there is a gentle gradient, slope, orthey are further apart, there is a gentle gradient, slope, or
slow change.slow change.
USGS Topo MapsUSGS Topo Maps
Take one and check it out!Take one and check it out!
ScaleScale
Maps Illustrate and Reinforce OurMaps Illustrate and Reinforce Our
Ideas about the World Around UsIdeas about the World Around Us
 What we see, what we don’t see, andWhat we see, what we don’t see, and
what we’re not willing to see…what we’re not willing to see…
 How we think about the worldHow we think about the world
around us…around us…
 What is important to us and what isWhat is important to us and what is
not…not…
 These things all “appear” on ourThese things all “appear” on our
mapsmaps
1600’s
1700’s
1800’s
G.I.S.G.I.S.
Geographic InformationGeographic Information
Systems hasSystems has
revolutionized the wayrevolutionized the way
we make mapswe make maps
However, the computerHowever, the computer
program only depictsprogram only depicts
what we tell it to…what we tell it to…
3838
A Simplification or a Lie?A Simplification or a Lie?
““A more subtle form of cartographic censorship usually occursA more subtle form of cartographic censorship usually occurs
as silences--as features or conditions ignored.as silences--as features or conditions ignored.
““Hence basic maps of most cities show streets, landmarkHence basic maps of most cities show streets, landmark
structures, elevations, parks, churches, and large museums--structures, elevations, parks, churches, and large museums--
but not dangerous intersections, impoverished neighborhoods,but not dangerous intersections, impoverished neighborhoods,
high crime areas, and other zones of danger and miser thathigh crime areas, and other zones of danger and miser that
could be accommodated without sacrificing information aboutcould be accommodated without sacrificing information about
infrastructure and terrain.infrastructure and terrain.
““By omitting politically threatening or aesthetically unattractiveBy omitting politically threatening or aesthetically unattractive
aspects of geographic reality...our topographic ‘base maps’ areaspects of geographic reality...our topographic ‘base maps’ are
hardly basic to the concerns of public health and safetyhardly basic to the concerns of public health and safety
officials, social workers, and citizens rightfully concerned aboutofficials, social workers, and citizens rightfully concerned about
the well-being of themselves and others.the well-being of themselves and others.
““In this sense, cartographic silences are indeed a form ofIn this sense, cartographic silences are indeed a form of
geographic disinformation.geographic disinformation.
--Monmonier, How to Lie with Maps, p. 1223838

Physical Geography Lecture 03 - Maps 100316

  • 1.
    Maps—The Geographer’sMaps—The Geographer’s ToolTool Cartography:The art andCartography: The art and science of making mapsscience of making maps
  • 2.
    A 2-D Viewof a 3-D WorldA 2-D View of a 3-D World
  • 3.
  • 4.
    All flat mapsdistort shape or size or direction We can hold one constant, but not all three
  • 5.
    Map ProjectionsMap Projections Trying to take something round andTrying to take something round and make it flat isn’t easy (especially ifmake it flat isn’t easy (especially if you’re trying to make it into ayou’re trying to make it into a rectangle)!rectangle)!  Map projections attempt to do this byMap projections attempt to do this by “projecting” an image of Earth’s“projecting” an image of Earth’s surface onto a piece of papersurface onto a piece of paper
  • 6.
    Cylindrical Projection Imagine alight bulb in the center of a globe, with a sheet of paper wrapped around it in the form of a cylinder. Meridians and parallels would be "projected'' onto the cylinder as straight, parallel lines. Meridians on these projections do not meet at the poles, so these maps are increasingly stretched and distorted toward the poles. 
  • 7.
    Azimuthal or PlanarProjection A perfectly flat piece of paper (a plane) would touch the globe at a point (the tangent). This projection is a good choice for maps with circular or square shapes. When the point of tangency is one of the poles, meridians are shown as straight lines radiating from the pole. If parallels are then drawn as equally spaced concentric circles, this projection would be equidistant (scale is true along any line radiating from the center point, in this case the pole).
  • 8.
    Conic Projection A coneof paper placed over a globe would touch its surface along one standard line (usually a parallel). A cone that sliced through the globe would intersect it twice, creating two standard parallels. Such a projection is well-suited for showing areas in the middle-latitudes with a mostly east-west extent (like the United
  • 9.
    Pseudocylindrical (or elliptical)projections normally have straight parallels and curved meridians (usually equally spaced). The Robinson Projection is a popular example. It was created to make the world "look" right by keeping angular and areal distortions to a minimum. Pseudocylindrical Projection
  • 10.
  • 11.
    Conformal vs. EquivalentProjectionsConformal vs. Equivalent Projections
  • 12.
    ““Reading” MapsReading” Maps Inorder to find your way around aIn order to find your way around a map, you need to know how standardmap, you need to know how standard map coordinates are written:map coordinates are written: As in: 37°21’41”N 122°7’41”W (Lat.°) (min') (sec”) (N/S) (Long.°) (min') (sec”) (E/W)
  • 13.
    Quick Quiz:Quick Quiz: Whichof the following is written incorrectly?Which of the following is written incorrectly? a)a) 0º0º0º0º b)b) 0º180º0º180º c)c) 38ºS 120ºE38ºS 120ºE d)d) 89º56’62”W 179º01’59”N89º56’62”W 179º01’59”N
  • 14.
    Elements of aGood MapElements of a Good Map All maps need certain characteristics in order to be easily readable.  So what is it that makes a map a “good” map?
  • 18.
    Elements of aGood MapElements of a Good Map  TitleTitle  DateDate  Legend/KeyLegend/Key  DirectionDirection  LocationLocation  IndexIndex  Data SourceData Source  Projection TypeProjection Type  ScaleScale  Relief and TopographyRelief and Topography  DesignDesign
  • 20.
  • 24.
    How a TopographicMap is MadeHow a Topographic Map is Made
  • 25.
    IsolinesIsolines  Four basiccharacteristics:Four basic characteristics:  1. Isolines always form closed shapes. The connecting1. Isolines always form closed shapes. The connecting section may be cut off at the edges of the map, but atsection may be cut off at the edges of the map, but at some point all isolines meet and close.some point all isolines meet and close.  2. Except in rare cases (such as an overhanging cliff),2. Except in rare cases (such as an overhanging cliff), isolines do not cross.isolines do not cross.  3. The elevation difference between one isoline and the3. The elevation difference between one isoline and the next is called an “interval”. Intervals may differ betweennext is called an “interval”. Intervals may differ between maps, but are usually the same throughout any one map.maps, but are usually the same throughout any one map.  4. Where isolines are close together, there is a steep4. Where isolines are close together, there is a steep gradientgradient, or slope, or a rapid change of some sort. Where, or slope, or a rapid change of some sort. Where they are further apart, there is a gentle gradient, slope, orthey are further apart, there is a gentle gradient, slope, or slow change.slow change.
  • 26.
    USGS Topo MapsUSGSTopo Maps Take one and check it out!Take one and check it out!
  • 27.
  • 28.
    Maps Illustrate andReinforce OurMaps Illustrate and Reinforce Our Ideas about the World Around UsIdeas about the World Around Us  What we see, what we don’t see, andWhat we see, what we don’t see, and what we’re not willing to see…what we’re not willing to see…  How we think about the worldHow we think about the world around us…around us…  What is important to us and what isWhat is important to us and what is not…not…  These things all “appear” on ourThese things all “appear” on our mapsmaps
  • 29.
  • 30.
  • 31.
  • 34.
    G.I.S.G.I.S. Geographic InformationGeographic Information SystemshasSystems has revolutionized the wayrevolutionized the way we make mapswe make maps However, the computerHowever, the computer program only depictsprogram only depicts what we tell it to…what we tell it to…
  • 38.
    3838 A Simplification ora Lie?A Simplification or a Lie? ““A more subtle form of cartographic censorship usually occursA more subtle form of cartographic censorship usually occurs as silences--as features or conditions ignored.as silences--as features or conditions ignored. ““Hence basic maps of most cities show streets, landmarkHence basic maps of most cities show streets, landmark structures, elevations, parks, churches, and large museums--structures, elevations, parks, churches, and large museums-- but not dangerous intersections, impoverished neighborhoods,but not dangerous intersections, impoverished neighborhoods, high crime areas, and other zones of danger and miser thathigh crime areas, and other zones of danger and miser that could be accommodated without sacrificing information aboutcould be accommodated without sacrificing information about infrastructure and terrain.infrastructure and terrain. ““By omitting politically threatening or aesthetically unattractiveBy omitting politically threatening or aesthetically unattractive aspects of geographic reality...our topographic ‘base maps’ areaspects of geographic reality...our topographic ‘base maps’ are hardly basic to the concerns of public health and safetyhardly basic to the concerns of public health and safety officials, social workers, and citizens rightfully concerned aboutofficials, social workers, and citizens rightfully concerned about the well-being of themselves and others.the well-being of themselves and others. ““In this sense, cartographic silences are indeed a form ofIn this sense, cartographic silences are indeed a form of geographic disinformation.geographic disinformation. --Monmonier, How to Lie with Maps, p. 1223838