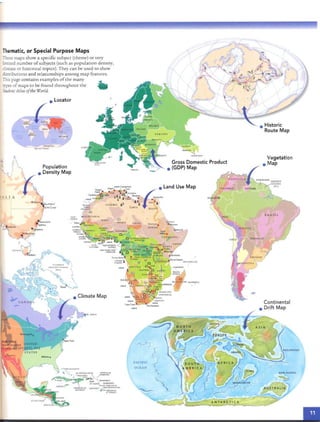
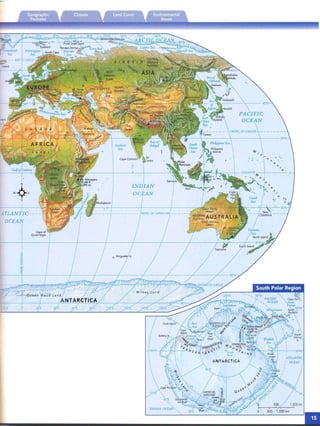
This document provides information about major rivers, deserts, oceans, mountain peaks, and low points around the world. It lists the Nile, Amazon, Chang, and Mississippi-Missouri as the four longest rivers in the world. The Sahara, Gobi, Libyan, and Sonoran deserts are identified as the largest based on area. Details are given about the Arctic, Indian, Atlantic, Pacific, and Southern oceans. Mount Everest is noted as the highest peak and the Dead Sea as the lowest point on land.


![great mountain ranges, and even th e sea ice
that covers much of th e Arcti c. The th ematic
maps include the most up to date mforrnanon
on everything from the world distribunon of
com puters and televisions to life expectancy,
religion and literacy. If you want to see the
ocean floor, or to find wh ere 111 the world vol
canoes fo rm , this IS the sec tion to look in.
Contin ents
The continent units are designed to all have
the same kinds of map s. This will enable you
to compare and contrast one continenr with
another with ease and accuracy. There ISa
political map, a ph ysical map, and a to tal of
seven thematic maps per co n tinen t.
Used individ ually each map can provide
answers to many qu estions. But all together,
each set of maps can be used to tell a story.
Fie! ._1Vanco~ *
. N ~~;~;: 0"
T"c~" . •
.( Portlafld.
- ..."1::
Im agine a journ ey cro ssmg a continen t. You
can see the regions vrsired, the rnounrams
climbed, or the deserts crossed. You can tell if
many people are passed along the way or few.
You can describe the acnvin cs of the people.
Will you see nuners or ranc he rs or farmers?
And you can tell about the different climates
experienced along the way. All of rhrs informa
tion and more is on th e maps for every conn
nent but Antarctica.
Environm ental Issues
There ISa special "Environmental
Issues" feature for each continent
and one for the world. To create
these features the latest SCIentific
informan on was gathered and orga
nized for yo u. The topiCScover th e
three major en vironmental Issues
faced by crn zcn s today, desertifica
tion, deforestati on, and acid ram.
t P
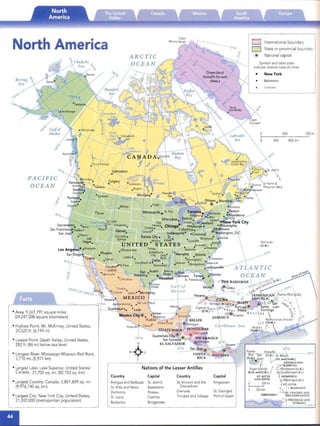
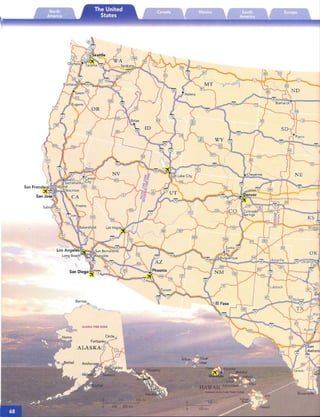
The United States
L.- oston In the section on the Umred States
NY MA you will find a political map WIth
T 1 two pages of poliucal facts, a physi
cal map With two pages of physical
facts, and seven themanc map
spreads .
Canada and Mexico
Ca nada and Mexico both have their own
spreads that include a political and physical
map.
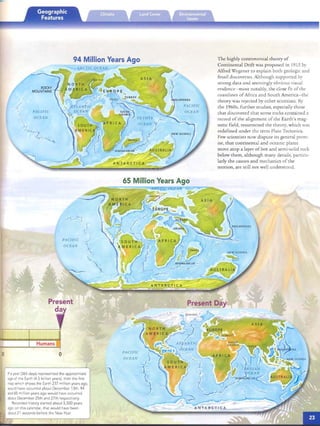
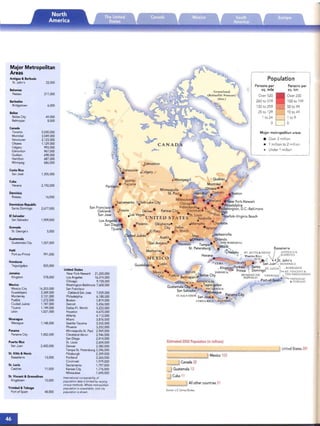
Geographic Features
There are two special "Geographic
Features" mcluded in this atlas. To
find out how the continen ts, Earth's
greatest land features, have been
drifnng arou nd the globe, turn to
pages 22 -23. To take an 1t1 de pth
look at fall line s, divides, and fau lts
turn to the United States Geographic
Features spread on pages 58-59.
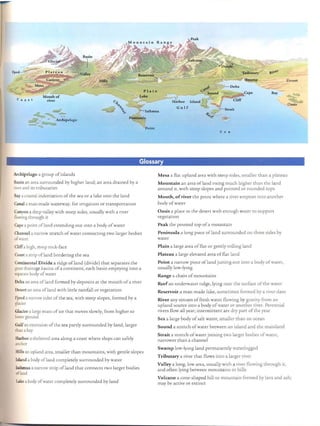
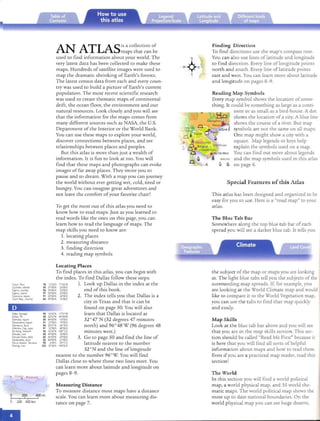
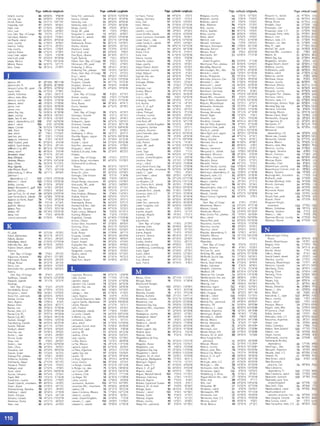
Charts and Graphs
1.
This atlas IS filled With charts, graphs and dia
grams. They are used to gIve more information
about su bjects shown on th e maps. To make
these charts and graphs, long lists of the most
up to date data was gathered. Then all those
numbers were o rganized into graphic disp lays
th at can be read sim ply and acc ura tely.
- - Consumpt ion
5
] 10f-- -:7"'S,£-- """"= '----.:::>---.-E.
5 f'-----+-~"'-----
20
-----~
i;
Line graphs are used to showl 1
change in amounts over time.
o
~
1950 1960 1970 1980 1990 2000
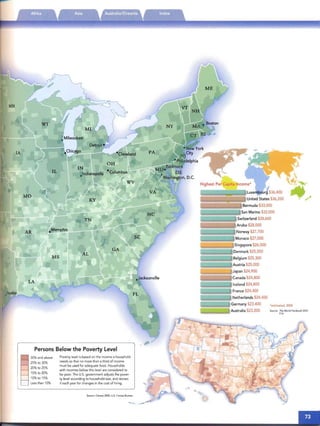
IA $2.679
NC $1,624 Bar graphs are used to com
MN $1,083 pare amounts.
IL $762
NE $640
IN $545
Pie chart s show percentages of
a total.
Glossary
There are many geographic terms found on
maps such as fjord, isthmus, or plateau. You can
find th e meaning of th ese and other terms in
the geographic glossary located on the inside
back cover.
Thestaffat Mapquestworked hard to make thisatlas
a referencebook that isbothfull ofinformation and
fun and ea.ry touse. We hopethatyou enjoy your copy.](https://image.slidesharecdn.com/student-world-atlas-malestrom-161219130615/85/Student-world-atlas-7-320.jpg)


![, ..
Climate Graphs
Average daily Average monthly
temperature precipitation
range(InoF) (in inches)
'~l ~~~h l[~:
ATlANTA. USA
':j _ ::::::::_ [20'- - - 10'
:1 1 1 . 0,
Jan Apr Jul Oct
FAIRBANKS. USA
100"] l2o'65° ~~ __ 10'
32".21 to -
00 -, - • - - 0'
Jan Apr Jul Oct
MEXICO CITY, Mexico
':j==-=[::
0" I . O·
Jan Apt Jul Oct
MINNEAPOUS,USA
'~l-=:=-:-~[~:
Jan Apr Jul Oct
NUUK, Greenland
'~:j [20'- - 10'
12' ---- =
0" --- • • O·
Jan Apr Jul Oct
NEWYORK CITY. USA
':j _--[20'
_ _ - - 10'
ll' ~
0" • • • • O·Jan Apr Jul Oct
PHOENIX. USA
'OO'j _=_[20
65'
- - - - 10'
12'
0" O·
Jan AfJr Jul Oct
ST. JOHN'S, Canada
100'j - l2o'W
- - -- 10'
12' - -
0" =t=, . 1 O·
Jan Apr Jul Oct
SAN FRANOSCO. USA
l~:l -__[20'- __ - - - - 10'
11'
0" 1 ~
Jan Apr Jut Oct
SAN JOSE,Costa Rica
': j=====::::::::r [::
l~ • I O.
Jan Apr Jul Oct
SANJUAN, Puerto Rico
':
1
====[::1: 1 1 1 1 0'
Jan Apr Jul Oct
VANCOUVER. Canada
'~:l r-r--: [20'- 10'
12' - -
0" .1: • 1 O·
Ja" Apr Jul Oct
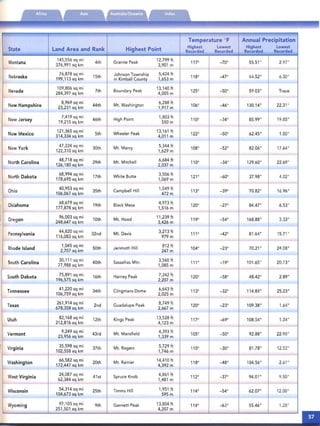
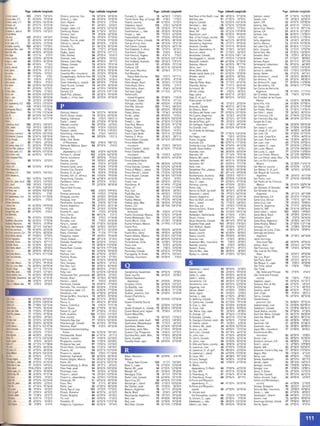
Environmental Issues
• Currentforest
D Cleared forest
~ Area at highest risk of desertification
o Areas most affected byacid rain
• Poor airquality'
"Citiesexceed ing at least one of the World Health
OrganIzation's (WHO) annual meanguidelines for ai,
qualit}'
SOurces: Global Distribution of Originaland Remaining Forests,
UNEPW CMC. 2002World Soil Resources Map Index, USDAlNRCS. 2002
World Development Indicarors. World Bank. 1999
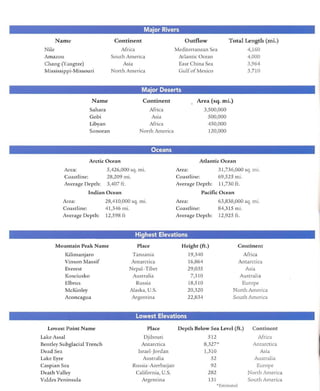
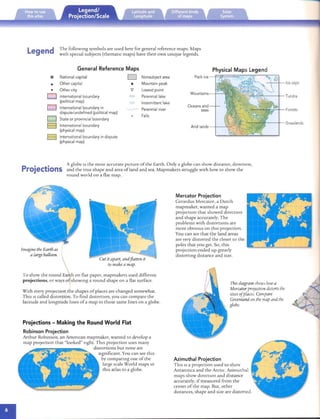
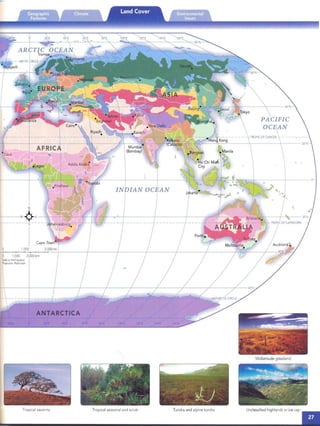
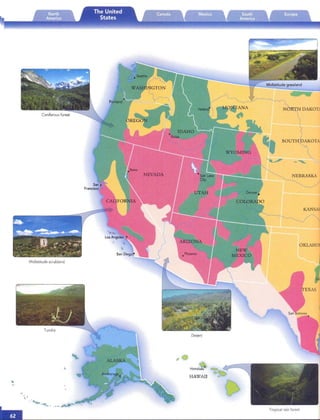
Vegetation
Unclassifiedhighlands or ice cap Mixed forest
Tundra and alpine tundra Midlatitude scrubland
Coniferous forest Midlatitude grassland•0
Midlatitude deciduous forest DesertD 0
Subtropicalbroadleaf evergreen Tropical seasonaland scrub
D forest
Tropical rain forest0
Deserts spanning the U.5./Mexico border join
the tropical plant life of Central Ame rica and
southe rn Mexico to the temperate and arctic
vegetatIOn of Canada and the U.S.- vegetation
predominat ely forest lan d bu t spli t by the arc of
the Great Plains and in ter woven with scrub
lands able to endure infrequent rainfall.
See photograph s of different the kinds of veg
eta tion on page 26 - 27.
AN llGUA&
BARHUOA
In the U.S. and
Canada, heavy con
sumption of energy
and other resources
is a source of many
environmental prob
lems. Environ mental
laws and regulatio ns
have helped, but air
pollutants and gases
continue to cau se
health problems and
may contribute to
global warming.
In the western
U.S. and parts of
Mexico, large areas
are susceptible to
desertificat ion from
overgrazing and
agriculture.
Deforestation is a
major issue in Lat in
America and th e
Caribbean. In Haiti,
for example, all th e
native rain forests
have been dest royed,
causing irreversible
harm to ecosystems.
_") TH E BAHAMAS
# ~, .. ST KITTS &. NEVIS A."IT1GUA e
- ' . ; # . ... ~eno ~ro /BARBUDA
6 - .....;;;;;:'.....~_..; (u .s .) J '.
AD' ,pi- # ... . co, DO Mf NTC".A
.. ST . tUCIA~ • BARBADO..CO
::=::-ST. VINCENT e
GREN AD A; TIn GRF.NADlN[S
~ TR1NmAO
& TO BAGO](https://image.slidesharecdn.com/student-world-atlas-malestrom-161219130615/85/Student-world-atlas-51-320.jpg)


![GULF OF MEXICO
Feet Meters
Above 1~40- - Above 500
. 200
655
0 - 0
100 200mi
" I
100 200km
ATLANTIC
OCEAN
a
I
a
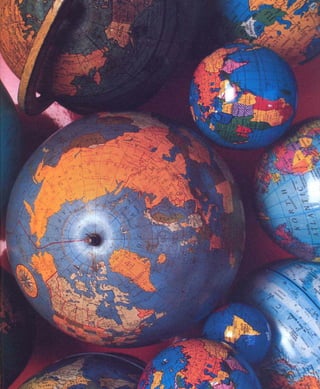
FallLine
National capital
Cityelevation
State boundary§
@
9 ft.
(3 m)
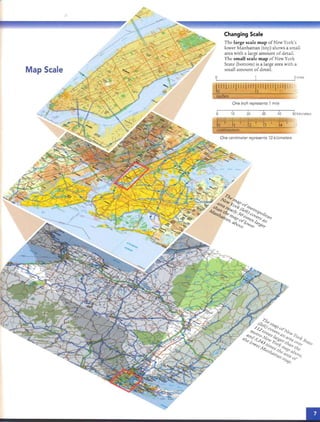
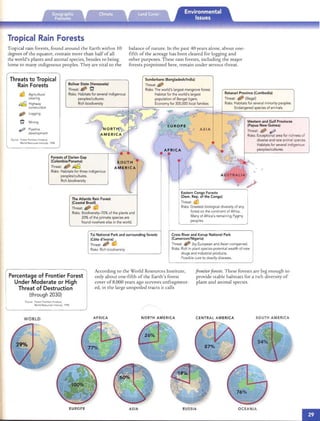
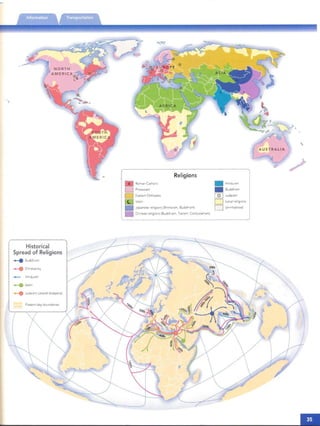
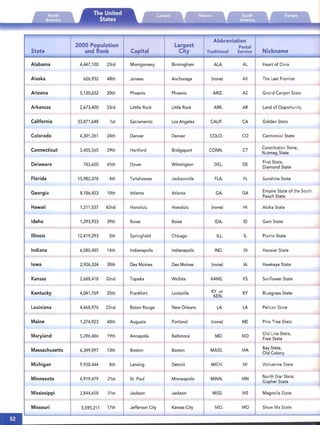
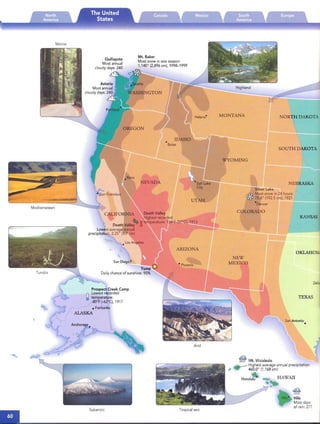
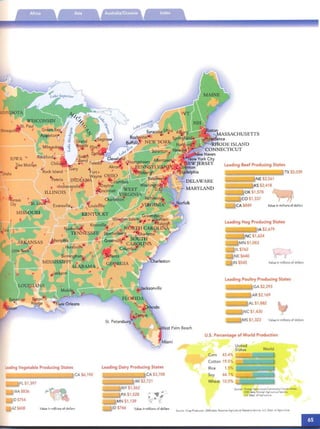
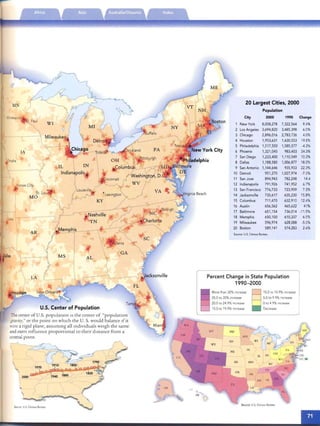
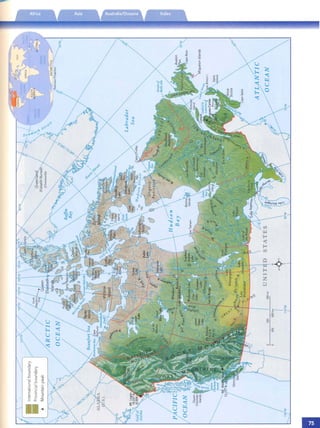
FALL LINE: A geologicfeature where uplands meet lowlandsand a
series of waterfallsand rapids occur. Fall lines are form ed whe re a
region of hard roc k borders softer rock, and the softer rock has
eroded away. The eros ion creates a led ge that water flows over.
Fall Line
TN
Fall Line
State boundary
@ National capital
(j ~) City elevation
A maj or fall hne exists in the easte rn United States. It marks the
boundary between th e Coastal Plain and the Piedmont and runs
between New York an d Alabama. Cities have grown into
ind us trial and co mmercial hub s aro und each waterfall on th e
fall line for two reasons. First , the energy of the falling water can
be captured an d used by industry. Second, the fall lin e IS often
the far thest pomt reachable by ships carrying goods up river,
which means that goods are transferred to land-based transp ort
at tha t po int. So me fall lin e cities on the East Coast incl ude
Trenton, Philadelphia, Baltimore. Washington, D.C., Richmond,
Petersburg, Co lumbia, Macon, and Montgomery. If you d raw a
line on a map co nnecting th ese city dots, you will have d rawn
the Eastern Fall Line.
It
Fault
he
:0
hquakes
rred in
listrib
major
(ted on
map to
a
I
a
PAC IFIC
OCEAN
I
100 km
[ - - Faultline ]
FAULT: A break in the Earth's crustcausedby movement. So lid rock on one
side of the fault no longer match es the so lid roc k on the other side. The
moveme nt may tak e place in any direcn onc-u p, down, or sideways. The
movement may be a few inches or thousands of feet.
A fault that moves up o r down IS calle d a dip-slip fault. Niagara Falls
cascades over an esca rpment caused by rlus kind of
movemen t.
A fault th at moves sideways is call ed a strike-slip fault. T he San
Andreas fault IS an exam ple of this kind. Horizo ntal m ovement along
rlu s fault cau sed th e devasta ting San Fra ncisco earthquake in 1906 and
will cause more earthquakes in the future. T his happens because th is
fault marks the boundary between the Pacific Plate and the No rrh
American Plate (see page 20).
Wh ere two parallel faults pu ll away fro m each other, th ey create a long,
su nken valley between the m called a rift. T he Great Rift Valley in Africa
IS th e wo rld's most visible example (see page 91). Underwater, the huge
Mid-Ocean Ridge IS th e longest rift on Earth (see pages 18- 19).](https://image.slidesharecdn.com/student-world-atlas-malestrom-161219130615/85/Student-world-atlas-61-320.jpg)
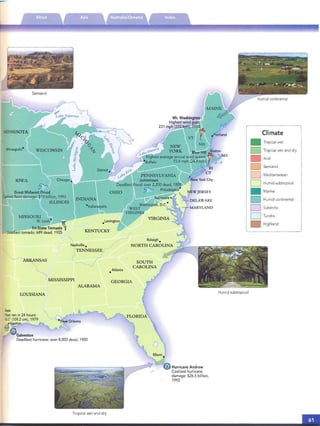


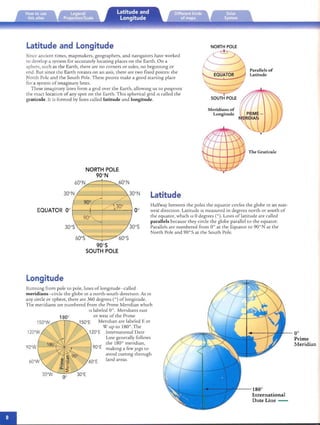
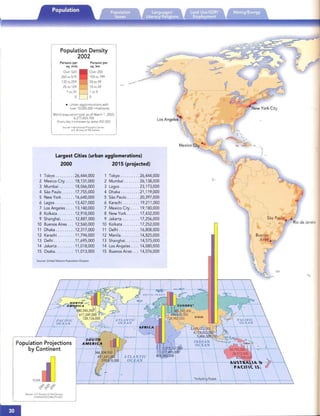
![Durango
Guerrero
MichoacanMorelos
NuevoLeonOaxaca
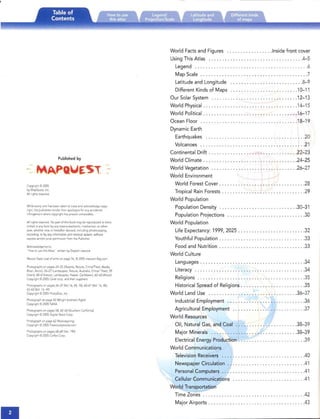
oInternationalboundary
oStateboundary
®Nationalcaptial
*Othercapital
Symbolandlabelsizes
indicaterelativesizesofcities:
•MexicoCity
Veracruz
Cancun
MexicoAguascalientesBajaCaliforniaBajaCaliforniaSurCampeche
ChiapasChihuahuaCoahuila
30"NColima
Ciu~adAcufia.:~
PiedrasNegras.,•.
NuevaRosita.
COAHUILA
Monclova"
SanPedro.
delasColonlas
Torreon.0
DURANGOSaltillo*
1ConcepciondelOro.
SINALOAour9o
*ZACATECAS
-;:::-p
~-"~~~~~~~
~'":o•.~...
•~1"~"'NuevoLar~
ih0.
Anauaci
NUEVO'~
LE6NReynoRsa.~
Liner5AULIPAS
TAM~
i
DistritoFederal
Guanajuato
*Monterrey"Matamoros
.•
---ZS'NHidalgo1
1
CiudadVictoria
----Matehuale,*Mazatlan:---------F~e-;n"Jlo------
•San··ZacatecasL.CiudadMahteI~•UI5•
Acapon~l:'·PotosiSANLUI!,~ampico
N~YARJTAGUASCAUENTES*POTOSI..~~
°0;t;,'Aguascalientes*CiudaddeValles·e-,.Teplc!,.
_
9S'WNayaritI
·~'ua""Leon.GUANA~~~T,O,......;>Tuxpan
Puertovaliartf·1da1iljiJ/'iJ*.Guanajuato:~.,~~lQ,!ER~TtA~O~ozaRicaNBayof
(""Ameca"'..rma.•*Querear.~4ZO'N___.'ALISCO~Yilo"!ce"y~.IHID;'L.GOh..Campeche
-,.--·'-Laki--..vcoa~--'.AE:ambaro-4--,*fa~c~.WE
utlanChapala~Ia*MEl<ICOMexicoCityXalapa
"ColimaUruapan,lJISTRITOFEDEJ{Al,@T~x4T~~laS*,
I
Manzanlllo0*,Toluca*,*Pbla~,,
COU~.MJCHOACAN.C.uemavacae'-,ue..v~~E~.z
..'a.........IMORl-:lOS~Orizaba~
f--R.i~;--'Tax*:oVERACRUZ-:·.PUEBLA.'",
.'....".9IgualaTehuac",nI~.
10S"WLazaroCardena,,,,",-rkv,Tuxtepec"aco~CO
I.UU&E=I0*.HuajuapanCoat7.IIxtapa"~RRER
..~.ChilpanclnqodeLeo~OaxacaPACIFIC
AcapUIc°I'~OAXACAJuchitisn..
OCEANPueblaSalinaCruz..l00"W
I
QuintanaRooQueretaroSanLuisPotosi
]aliscoMexico
o200400rni
I',
o200400krn
90'W
J;~C''7",_
'7....
0-6
I'???
8S'W"'.....
zooN-+
Caribbean
Sea
9O"W
Sinaloa
YucatanZacatecasSonoraTabascoTamaulipasTlaxcalaVeracruz
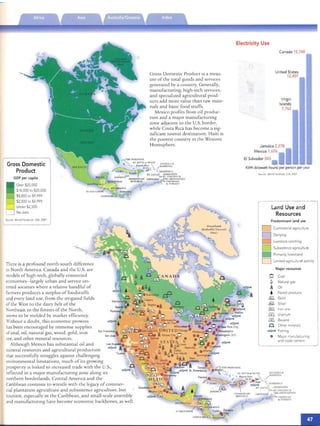
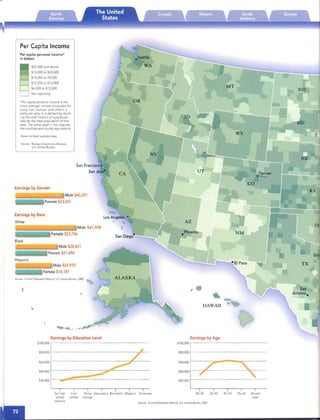
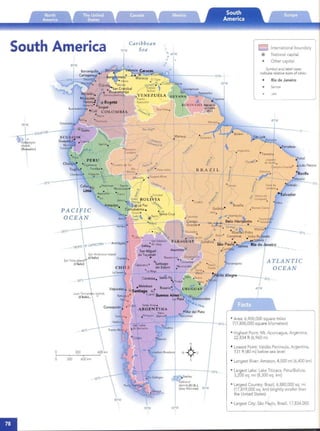
"Area:742,490squaremiles
(1,923,040squarekilometers)
"HighestPoint:PicodeOrizaba,
18,405ft.(5,610m)
"LowestPoint:LagunaSalada,
33ft.(10m)belowsealevel
"LongestRiver:RioBravodelNorte,
1,240mi.(1,996krn),alongU.S.border
"LargestLake:LakeChapala,
417sq.mi.(1,080sq.km)
"LargestCity:MexicoCity,
DistritoFederal,8,489,007](https://image.slidesharecdn.com/student-world-atlas-malestrom-161219130615/85/Student-world-atlas-78-320.jpg)

![...
Climate Graphs
Average daily Ave rage mon thly
temperature preci pitation
range (in'F) (in inchesJ
'~j~l::
ASUNCION,Paraguay
0
-[::. I
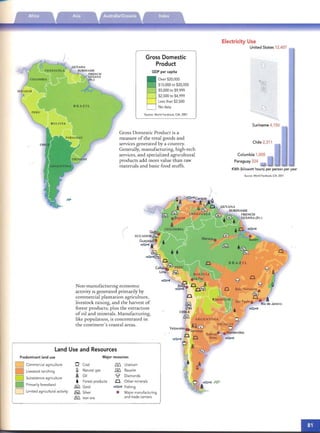
South Amen ca IS dommated by
tropi cal vegeta tlo n, including
Earth 's most extensive rain forest.
Farther south, a vast grassland, the
Pampa, fades gradually in to the dr y
and meager vegeratlon of Para gonia.
See ph otographs of the different
kin ds of vegetation on pages 26-2 7.
Vegetation
)BRAZIL
The destruction of forest
areas- especially in the
Amazon Basin- is one of th e
leading environmental
issu es in South America. In
Brazil , ir is estimated rhar an
average of 15,000 acres of
forest are lost each day as
peop le clear lan d for timber
and to grow cro ps. Human
activities have im pacted
other rypes of vegerarion, as
well. For example, over
grazing has caused damage
to grasslands in many areas,
putting th em ar risk of
beco mi ng inferti le deserts.
Poor urban air quality is
anoth er serious concern in
th e region, with nearly 80
percent of the population
living in cities.
,ecife
lry
Jao Apr J,I Oct
BOGOTA.Colombia
IWj65'
32' . I . I~
Jan Apr J, I Oct
BUENOSAIRES, Argentina
1WI65
Unclassified highlands D
or ice cap D
Midlatitude deciduous D
lorest
Mixed forest D
Midlatitude scrubland D
Midlatitude grassland
Desert
Tropi cal seasonal and scrub
Tropical rain forest
Tropical savanna
•
m
en
32' -=:-- 10'
0" •Jan •Apr •Jul •Oc t On
CARACAS, Venezuela
'~j I I l::Jan Apr Jul Oct
CAYENNE,French Guiana
'~j
~
Jan Apr
LA PAZ, Bolivia
lOOj
61' _
J2'
~ I .
Jan Apr
UMA,Peru
I~j
:Jan Ap,
t.lANAUS, Brazil
IlXl'j'65
32' I I
--f:
::
Jul Oct
J, I Oct
_
J,I Oct
~ ~
Jan Apr Jul Oct
PUNTAARENAS, Chile
':j~-!!!!!!!!!-=
~ •
Jan Ap' Jul OCI
RECIFE,Brazil
IIXl']65' _
J2' I I
~ ~
Jan Apr Jul Oct
RIODEJANEIRO, Brazil
[20
10
0'
[20
0'
[::
0'
[20
10
0
[20,
10'
O'
l::
0'
[20,'
10'
O
E
Environmental Issues
• Current forest
D Cleared forest
~ Area at highest risk of desertification
• Poor air quality'
'Cures exceeamq at leas! one of the World Health
O'ganlzavon·s (WHO) onnual mean gUidelines fo,.dll
qualrry
Sources Global Dlsrnbutlon 01 Ongmal a nd Remaining ro-esr s.
UNEPWC MC.2002
World 50,1Resources Map rndell. USDAl NRCS. 2002
World Developmenllndicarors. World Bank. 1999
I~)65'
---[::32'
I
" IJao Apr
SANTIAGO, Chile
100']
65:
32
0'
Jan Ap'
• • O.
Jul Oe1
_1[::,.
• 0Jul OCl](https://image.slidesharecdn.com/student-world-atlas-malestrom-161219130615/85/Student-world-atlas-85-320.jpg)
![.cr'"
60"E
SO'E
.,rs'"
Internationalboundary
Nationalcapital
Othercapital*
§]
®
•HighestPoint:Mt.Elbrus,
Russia,18,510ft.(5,642m)
Symbolandlabelsizes
indicaterelativesizesofcities:
Varna
•London
Helsinki
•Area:4,032,000squaremi.
(10,443,000squarekilometers)
•LowestPoint:CaspianSea
92ft.(28m)belowsealevel
•LongestRiver:Volga,
2,290mi.(3,685km)
•LargestLake:CaspianSea,
143,244sq.mi.
(371,000sq.km)
•LargestCountry:Russia
(European),1,663,870sq.mi.
(4,309,400sq.km)
•LargestCity:Paris,France
9,645,000(metropolitanpop.)
40'E
61t1ck.Sea
60'E
S<J<E
3<J<E
J.lrakfio
30'E
Crete
20'E
20'E
Pan;elleria
~t.)®Vallena
MALTA
1<J<E
nean
10"W
..............
20"W
500km
Bayof
Disc"y
.Gij6n
250
BJlbao
".
V.lla~olid''.-l-
SPAIN.Z.r~goza
~Madrid
0'
FaroeIs.
,~(Den.)
I
Norwegian
0'
.Cordoba
Valencia-BalearicSea
•M.ijortoj;-q
.).PalmaOMiooJra.
.Allcante.deM..llorcaBalearicIs.Sardinia
Malag.a«GrenadeI(Sp.){It.}•.
'GIBRALTAR(U.K.)/
Mediterra
So"~
o
o250500mi
I.'•
Vigo_.
Porto.
SlTolj(Of
Gil"'all,Jr
-,
40o~
ATLANTI~
OCEAN
10'W](https://image.slidesharecdn.com/student-world-atlas-malestrom-161219130615/85/Student-world-atlas-86-320.jpg)
![Climate Graphs
Averagedally Average monthly
temperature precipitation
range(lnoFl (in inches)
lOO'l= - t9h [20'W lev.' 10'
Jr
~ O·
ARKHANGELSK, Russia
100'1 [20'65'
- 10'
Jr - =
0' ----w- _ . O·
Jan Apr Jul Oct
ATHENS, Greece
':1 _===[20=:- 10
Jr
(l' • • 0
Jan Ap. J",I Ocr
COPENHAGEN, Denmark
':1 - [20'Jr - = - = 10'
0' • • • • 0'
Jan Apr Jul Oct
DOBUN,Ireland
':1 - [20,"
3r = = - = 10'
D" • • • • 0
Jan Apr Jul Oct
USBON, Portugal
':1==-=[:::3~ I . • 0"
Jan Apr Jul Oct
MOSCOW, Russia
':j -=-[::Jr -
0' :::;:: . • • O·
Jan Apr l ui Oct
NAPLES,ltaly
':j __= [20'- - 10'
: --;- . I 0'
Jan Apr lui OCI
ODESA. Ukraine
'::=j - . .--=[::O·
Jan Apr l uI Oct
PARIS,France
d
~ rs
REYIUAVIK.lceland
n
100'] [20'
e 65' _ = _ 10'
Jr - -
ie, 0' I • • • 0'
Jan Apr Jul Oct
of
nt. TROMS0, Norway
': ] _ [20'- 10 '
Jr - =
~ r --;- . I ·O
Jan Apr lui Oct
VlENNA, Austria
':j == [20'- == 10 '
1r -
0" • • • • 0'
Jan Apr l ui O ct
Vegetation
D
D Tundra and alpine tundra
• Coniferous forest
D
L:J Mixed forest
• Midlatitude scrubland
D Midlatitud e grassland
Forests, nounsh ed by plentiful pre
cipita tio n, dominate in Europe, but
grass land and scrubland thrive where
ramfall becomes sparse or ISseasonal.
Deciduous trees disappear as the win
ters grow harsh, rep laced by vast and
hardy srands of coniferou s forest that
are merely the western end of an
unrnen se belt srrerching across RUSSia
to rhe Pacific Ocean.
See ph otographs of th e different
kinds of vegetation on pages 26-27.
A
JCE IAN
Unclassified highlands or ice cap
Midlatitude deciduous forest
Area at highest risk of desertification
Areas most affected by acid rain
POR
Emissions from th e many cars, trucks, and facro ries in Euro pe have led
to problems with air pollu tion and acid ram over a large parr of rhe
contment. Land and water pollution (from ferri lizers, pesticides, and
industrial waste) lSalso widespread . Since the 1960's, th e am ounr of
fore sr area in Western and Central Euro pe has acru ally increased , but
many foresrs (nearl y 60%) are dam aged due ro acidification , pollution,
droug hr , or fires. Overfi shmg-vesp ecially 111 rhe North Sea-is a serious
problem for marine ecosystems.
• Poor air quality'
"Cutes exceed ing at leasl one of the World Health
O rganization's (WHO) annual mean guide hnes for a ir
qu ality
So urces: Glob al D'stributlOn o f Orlgmal ar'td Remaining Fores ts.
UNEP-WCMC.2oo2World 5011Resources Map Index. USDAlNRCS,2002
World Development Indicators. World Bank. 1999](https://image.slidesharecdn.com/student-world-atlas-malestrom-161219130615/85/Student-world-atlas-91-320.jpg)


![(i'
I
I
I
I
I
I
I
I
7
I
I
I
1/
800E
7lYN
INDIANIOCEAN
W<N50~N40~N
600E
IIIe.-.._
30,000It--~!df:sea---------~!~~~~:.::.::.--~agrol~~ts---J.~'c'.-..!~~.:~~-------~~~"!..~-~':~':~-~l/~~a~------------------------------------------~:~w_~=~South-~1~==
25,000It.-------.----------------------------------.---]."hI'",-----------------------------------------------------------------------------------------------Korea--E
~mJA...~~~-=~::;~;~:~~--~_:_~~~~-.~~~~:====-.:..~~~=~~~=~=_~~~==:;:~====i~_B
?o~
3erN](https://image.slidesharecdn.com/student-world-atlas-malestrom-161219130615/85/Student-world-atlas-99-320.jpg)
![~
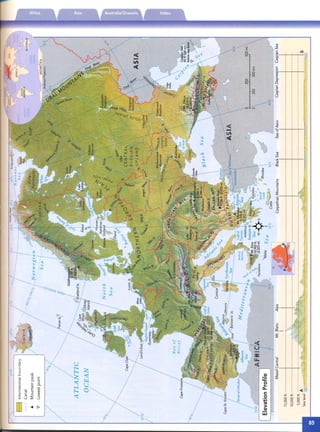
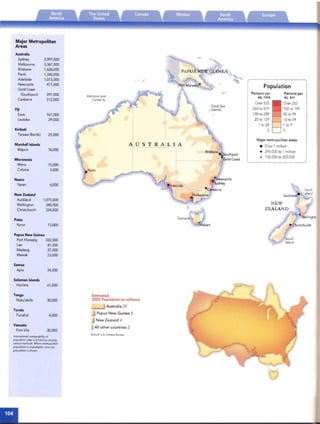
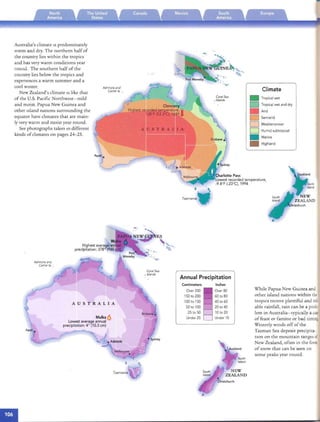
Major Metropolitan
Areas
Afghanistan
Kabul 2,029,000
Bahrain
Manama 151,000
Bangladesh
Dhaka 6,487,000
Bhutan
Thimphu 8,900
Brunei
Bandar Seri
Begawan 50,000
Cambodia
PhnomPenh 1,000,000
China
Shanghai 12,910,000
Beijing 10,820,000
Tianjin 8,970,000
Hong Kong 6,708,000
Shenyang 4,740,000
Wuhan 4,450,000
Chongqing 4,070,000
Guangzhou 3,910,000
Chengdu 3,120,000
Xi'an 2,990,000
Harbin 2,960,000
Nanjing 2,670,000
Cyprus
Nicosia 273,000
EastTimor
Dili 140,000
India
Mumbai
(Bombay) 16,368,000
Kolkata
(Calcutta) 13,217,000
Delhi 12,791,000
Chennai
(Madras) 6,425,000
Bangalore 5,687,000
Hyderabad 5,534,000
Indonesia
Jakarta 9,374,000
Bandung 5,919,000
Bogor 5,000,000
Malang 3,174,000
Iran
Tehran 6,759,000
Mashhad 1,887,000
Iraq
Baghdad 4,336,000
Israel
TelAviv-Jaffa 2,595,000
Jerusalem 628,000
Japan
Tokyo 12,059,000
Yokohama 3,427,000
Osaka 2,599,000
Nagoya 2,171,000
Sapporo 1,822,000
Kobe 1,494,000
Kyoto 1,468,000
Pukuoka 1,341,000
Kawasaki 1,250,000
Hiroshima 1,126,000
Jordan
Amman 1,147,000
Kazakhstan
Almaty 1,129,000 laos
Persons per
sq. mile
Over 520
260 to 519
130 to 259
25 to 129
1 to 24
o
G
arPopulation
fa
Persons per
sq. km Major metropolitan tu
areas alOver 200
• Over 2 million 01
100 to 199
50 to 99
A• 1 million to
2 million al10 to 49
1 to 9
o
A
a
c
(
h
'Male
d
~LALI>JVES
n
];
Estimated 2002 Population (in millions)
s
l:
China 1,284 t
India 1,046
___._.__...... ...__ ,.,J Indonesia 232
Pakistan 148
Bangladesh 133
Japan 127
Philippines 85
___-' Vietnam 81
Thailand 62
South Korea 48
All oth er countr ies 365
Sou rce: If.S. Cens us Bueau
Myanmar (Burma) Philippines Singapore Thailand Uzbekistan
Vientiane 331,000 Yango n Manila 9,933,000 Singapore 4,131,000 Bangkok 6,320,000 Tashkent 2,142,000
North Korea (Rangoon) 4,101,000
P'yongyang 2,741,000 Lebanon Qatar SriLanka Turkey (Asian) Vietnam
Beirut 1,500,000 Nepal Doha 264,000 Colombo 642,000 Ankara 3,203,000 HoChi Minh
SouthKorea (core city only) Kathmandu 421,000 lzrnir 2,232,000 City 4,990,000
Seoul 9,854,000 Malaysia Russia(Asian) Syria Hanoi 2,464,000
Susan 3,655,000 Kuala Lumpur 1,379,000 Oman Novosibirsk 1,400,000 Halab (Aleppo) 1,813,000 Turkmenistan
Daegu 2,474,000 Muscat 477,000 Yekaterinburg 1,314,000 Damascus 1,394,000 Ashgabat 407,000 Yemen
Maldives Omsk 1,177,000 Sanaa 927,000
Kuwait
Kuwait
Kyrgyzstan
Bishkek
193,000
753,000
Male
Mongolia
Ulaanbaatar
74,000
760,000
Pakistan
Karachi
Lahore
Faisalabad
Islamabad
9,339,000
5,143,000
2,009,000
529,000
Chelyabinsk
Saudi Arabia
Riyadh
Jeddah
1,111,000
2,776,000
2,046,000
Taiwan
Taipei
Tajikistan
Dushanbe
2,720,000
529,000
United Arab
Emirates
Abu Dhabi 904,000
Intemationalcomparabilityofpop
ulation datais limited by varying
censusmethods. VVhere metro
poUtanpopulationis unavailable,
corecitypopulation;s shown.](https://image.slidesharecdn.com/student-world-atlas-malestrom-161219130615/85/Student-world-atlas-100-320.jpg)
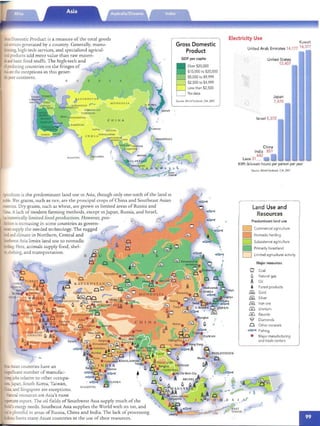
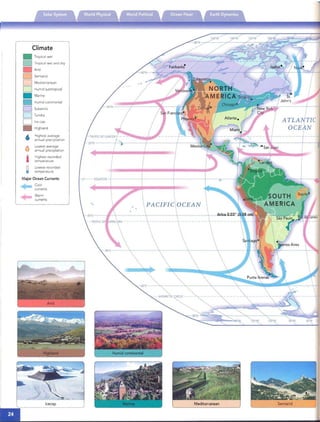
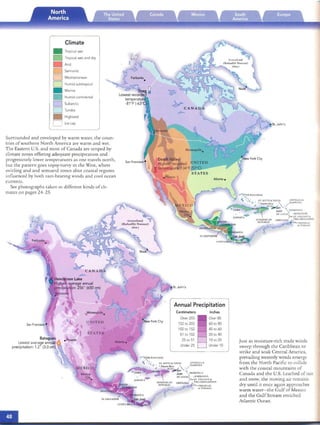
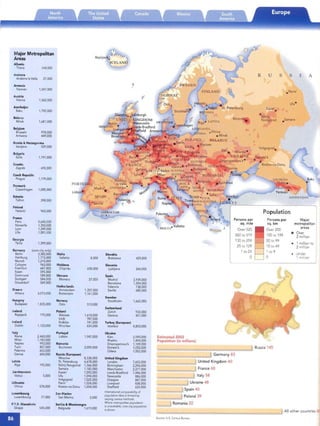
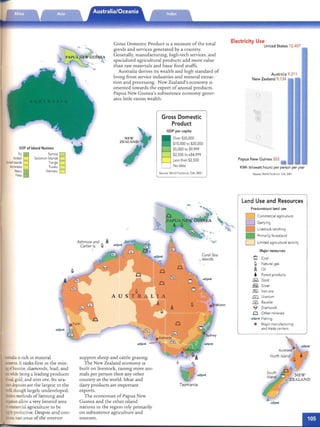
![Asia has many climares. This can be expec red on a
landmass rha r covers an area fro m below rhe Equ ator
co rhe Arcric Ocean and from rhe Medirerranean Sea co
rhe Pacific Ocean . Wearher condirions flu cruate from
rhe sub-freezing remperarures and snow of rhe run dra
climare in No rrhern Russia, rhrough rhe more rem per
are humid conn nen rai climate, pasr rhe arid condi
nons of Sou rhwesr and Cen tral ASia, and finally co rhe
warm an d wet zones of So urh and Southeast Asia.
See ph ocograp hs raken In differenr kinds of climates
on pages 24-25.
R
•
Climate
Tropical wet Humid subtropical
•
D
Tropical wet and dry Humid continental
Arid SubarcticD
Semiarid TundraD
Mediterranean
• High land
D
Annual Precipitation
Centimeters Inches
Over 203 Over 80
152 to 203 60 to 80
102 to 152
40 to 60
S1 to 102
20 to 40
25to 51
10to 20
Under 25
Under 10
R u
okyo
,'/
f
r4f;"" J'
D . E S I A,
('' . ... " '-".. ft.
• ~;~ST ' o/-• ..".-... • TI MOR r
The counr nes of Sour h and
Southeast Asia experience rhe
mosr rainfall. This rainfall occurs
primarily between rhe monr hs of
April and October. Warm, moisr
winds from rhe sourh, called
Mon soons, bnng rhe rain to this
part of rhe conrinenr and also
pile snow deeply upon rhe peaks
of rhe Himalayas. The Mo nsoons
do nor reach rhe inrerior of rhe
conri nenr, which remains dry
rhro ugho ur rhe year. The dri esr
counr ries are III rhe southwest.
,"
Climate Graphs
Average daily Average monthly
temperature precipitation
range {in "Fl (in inches)
';::] ( [ : : :~~~h
0' O'
AlMATY. Kazakhstan
10os'']
0
=•
[::O'
Jr -
D· =.Jan Ap' Jul Oct
BEIRUT, Lebanon
I~l l -:- =[::
• O'
Jan Ap, Jul Oct
COLOMBO, Sri Lanka
100'j_ _ ==[20'os. ~ 10'J2'
D· O'
Jan Apr Jul Oct
DHAKA, Bangladesh
T"'"'l z::::::;:
100'j [20'
J2'
0' O'
OS" I I I 10'
Jan Apr Jul Oct
HONG KONG. China
- - 10'
l: j . I [20'I IJ2'
D· O'
Jan Apr Jul Oct
JAKARTA.Indonesia
1~~:lJ _ = [20'
J~: I • • :~.
Jan Apr Jul Oct
NEWDELHI, India
1~~:1 _ r=l= [20'__ 10'
J2'
I
00 - O·
Jan Apr Jul Oct
RIYADH, Saudi Arabia
1::1_- --[:
::32'
D· O'
Jan Apr Jul Oct
TEHRAN, Iran
TIANJIN, China
100ss-'] ,--" [20'_ - 10'
32' I
00 - O·
Jan Apr Jul Oct
TOKYO, Japan
1~~1 [20'
__ - 10'J2' ,,--, I00 ---:- I I O·
Ja n Apr Jul Oct
YAKUTSK, Russia
1~~:jT,m p ---, [:: :
32~ ~;Jf~ _
00 _45,-=~~~__---,_ O.
Jan Api Jul Oct](https://image.slidesharecdn.com/student-world-atlas-malestrom-161219130615/85/Student-world-atlas-102-320.jpg)
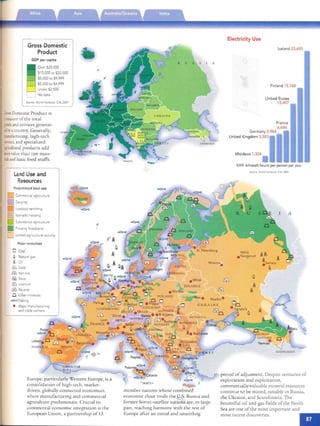
![Allislandseastof180
0
withinthe
RepublicofKiribatiobservethesame
dateastheIslandswestof180·,even
thoughtheyarepositionedon
OppositesidesoftheInternational
DateLine.
~_.,..."
French"':Po·IJne~ia
Tahiti(Fr.)"
"-;.TROPICOFCAPRICORN-
150'W
HawaiianI~o(U.S.)V
PalmyraIs,(U.S.)
OCEAN
JarvisI.
(U.S.)
CookIslands
(N.Z.)
165'W
NiueI.
(N.Z.)
American
Samoa
(U.S.)
JohnstonI.
(U.S.)
PACIFIC
/
/
/
/
/
I
I
I
T~!fG~
®:
Nukualoja
'tIT_L_IUu-l_III
---,---1------
I
I
I
I
I
I
rur
Z
::J
w
~
o
<!.
z
a
~
~c-
O<'
180°
180"
Fiji
Sea
KIIRIBA'TI
®Tarawa(Bairiki)
TINALU
Funaf~ti®
Hoy-landI,(U.S.)
II:Baker/.(U.S.)
MARSHALL
IS'LANDS
Wake/.
(U.S.)
--~:KermadecIs.I
(N.Z.)wi
51
wi
~I
01
;;'1
61
FI
~I
ffil
~I
-I
I
ChathamIs,I
(N.Z.)I
'llI
•I
165"E
165'E
lS0'E
150"E
:~~T~.f:."II,n.}I'.;]"HII'~,CoralSea<:0~..•.....~-~II'.-.,'15'S
Northe
MarianaIs.
(U.S.)
LordHowe/.
(Australia)•
:Newcastle
:,Sydney
r~'e'iWoliongong
AUSTRALIANCAPITALTERRITORY
Tasman
Sea
..:I.Palikir~
FEDERATE~STA"TES
brMICRONESIA'
Guam
(u.S.)
15"N-1•~iI.1I15'N
NNorfolkIsland
r~i~::rJ:!1(;OldCoast.i.(Australia)
"-to.'AI~C!,
.,....,.~
S
135°EIIPhilippin'!...I,
Sea
INDIAN
OCEAN
1,000km
1200
E
Honiara
Sydney
Perth
500
•
Internationalboundary
Stateboundary
Nationalcapital
Symbolandlabelsizes
indicaterelativesizesofcities:
§
®
o5001,000mi
I',
o
--~-f--~----
.Carnarvon~WESTERN
'".,JAUST~LIA
",--:"..~';,
300S
'jt""I'"..,,1
•Kalgoorhe
165°W....
lS0'W
•Area:3,300,000squaremiles
(8,547,000squarekilometers)
•HighestPoint:Mt.Wilhelm,
PapuaNewGuinea15,400ft.(4,694m)
•LowestPoint:LakeEyre,
52ft.(16m)belowsealevel
•LongestRiver:Murray-Darling,
2,510mi.(4,039km)
•LargestLake:LakeEyre,
3,500sq.mi.(6,475sq.km)
•LargestCountry:Australia,2,967,909sq.mi.
(7,686,850sq.km)
•LargestCity:Sydney,Australia,3,997,000](https://image.slidesharecdn.com/student-world-atlas-malestrom-161219130615/85/Student-world-atlas-104-320.jpg)
![~
_3005
AMERICA
Babelthua~
13S~E150"E165"'E
.--;
:~~
ManihikiI..
TongarevaIs.~
CookIslands.
RarotongaI.•
HiO'16S--N
KaUil'
...Oahu
"~Maui
Hawaiian15._Hawaii
.WakeI.
:Northern
.MarianaI:
.JohnstonI.
i"PIIIIIIlS'N-
Guam-·
PACIFICOCEANMMarshall•C_r0
Islands
'"Jf]
e'.'CarolineIs"/nd;.ps
/
o
'"HowlandI./
Tarawa,I
GilbertIs.:SakerI..J
"..PhoenixIs.
Tuvalu
Marques~;.
~FlintI.Islands
:'''';0
JOel'""'~'<.o,$l
French'-;<,~-:s:
TongaI.NiueI.Polynesia~.~.....,..
,~"
-TROPICOFCAPRICORN"-
Fiji
SeaN
.NorfolkIsland
1-..~-~~-'"~Iut:"/uw:tt:"di1~/::~.I30'SE:KermadecIs.w4.LordHoweI.
01,000mi5
I,5
901,
05001,000km
I
Tasman
BInternationalboundary
Sea
ElStateboundary
INDIAN
"-Mountainpeak
OCEANChathamIslLowestpoint
.SouthEa$t7.,..)120'ECape
45'S
I
16S'W
I
13S'EIS0'ElWE180'
IIII
::~~~"'.
lS0'W
-f"·I
I
Mount
Kosciuszko
NORTH
~:'I~'·=-z~_,__''__.---'_-'-_.-_.=_-_'-._-.-.~~-~~:=~~~~::---..~-·=:~=-'---~~~~~='='~~'=='~=~~~"-"--"-------'~-~~~f~e"......~1.-.~3~t3,000ft.---....--..-------------.--------.---.-.-----.-..------....---..-------~="'====="-.--
5~:~~v:i~.....'7--.-.-....""""'--'cO'=---r-...-----.---...-._B.](https://image.slidesharecdn.com/student-world-atlas-malestrom-161219130615/85/Student-world-atlas-105-320.jpg)
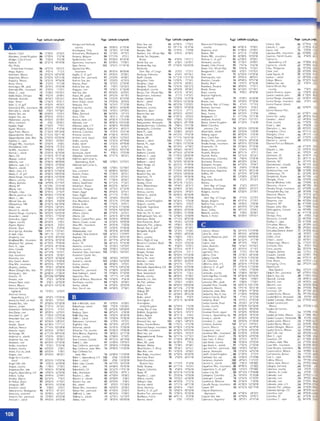
![Climate Graphs
,l,ver~ daily Average monthly
temperaillre precipitation
rallge(in"Fj (in inches)
BRISBANE,Australia
':1_=__
-
17'
~ I • . II
Jan Apr Jul Oct
PERTH, Australia
'~I .
-------,,-----,,-I
Jail Apr lui DC!
[20'10·
O.
[:
Abundant Australian for est
lands ar e lirrured to relatively
narrow coastal regIon s where
moistu re, even if seasonal, IS
adequate. Mo st o f th e rest of
the contin en t is cove red by
specIes of tr ees, bush, and
grass es adapted to arid condi
tions. Eucalyptus are th e most
common trees 111 Australia.
Papua New GUlI1ea has
den se tropical ram fore sts,
and New Zea land has mixed
forests and grasslands anslI1 g
from ItS temperate chrnare.
See photographs of differ
ent kmds of vegeta tion on
pages 26- 27.
CoralSea
~ Islands
Ashmore and
Cartie r Is.
Biodiversity loss (a de crease It1 the vanety of life
forms and ecosystems ) IS a lead ing enviro nmen tal
prob lem In both Australia and New Zealand. Over
th e past two h und red years, vast areas have been
cleared for settle me nts and far m land. ThIS land
clean ng, along WIth th e mrroducnon of non -native
plant and animal speCIes, has permanently altered
the ecological balance. In New Zealand, It IS
estimated that eighty-five percen t of the o rigmal
lowland forests and wetlands have been lost due to
human influences. Desertification, often brought
on by overgrazmg, IS another serious environmen
tal threat in many parts of Aus tralia.
,.
EA D-,
•
D
D
D
D
o
o
o ,
TdsmaniaV
,
• ..
Coral Sea
, Islands
'..
Ashmore and
Ca-nerIs.
Tasmania
SOU~hIsland . . NE W
ZEALAND
"
Environ mental Issues
Current forest
o Cleared forest
I22a Area at highest riskof desertification
• Poorair quality*
"Dries exceeomq at least one of the World Health
Organization'S(WHO)annual mean gUidelines for air
quality
Sources: Global Distribution of Original and Remaining Forests.
UNEP·WCMC.2OO2
World SoilResources Map Index. USOAlNRCS, 2002
World Deve lopme nt Indicators. World Baok. 1m
Veget at ion
Subtropical broadleaf
evergreen forest
Mixedforest
Midlatitude scrubland
Midlatitude grassland
Desert
Tropicalseasonal and scrub
Tropical rain forest
Tropical savanna
D
d
he
reli
:>b-
rase
ing.
of
rm
AUCKLAND,New Zealand
11lI'1 [20'65'_=_- io-
Ir -
~ • I I I 0'
Jan Apr Jul Oct
PORT MORESBY, Papua New Guinea
':'1_::::::::_ ==[2010 '
1~ 1 1 •• o
Jan Apr Jul Oct
AOeL:JDE,Austrafia
'~l' ====[::.
v • O'
Jan Apr Jul Oct
MEtBOURNE.Australia
IIlI'MI::::- - [20'_ - _ TO'
: . . --=- . o·
Jan Apr Jul Oct
SYDNEY,Austraiia
OiRISTCHURCH, New Zealand
J1l] ~ _ [20'6S r--"""': 10'
II -
tI" • • O'
Jan Apr Jul Oct](https://image.slidesharecdn.com/student-world-atlas-malestrom-161219130615/85/Student-world-atlas-109-320.jpg)
!['
'
ngitude
IS"OS'E Page Latitude longitude Page LatitudeLongitude Page Latitude Longitude Page LatitudeLongitude Page Latitude Longitude
ll"OO'W <"wrbta Mts"mountalns . 15 S1°00'N 11'rOO'W Denekil,region 91 13"00'N 41"00'E George, fiver. 75 S7"OO'N II "OOW Halifax Bay,bay 103 19"00'5 147'OO'E
'roow ~a Plat., plateau 54 4sooo'N 118°eX)'W Denmark, country 84 S6'OO'N lO"OO'E Georgetown, Guyana 78 6"41N 58"01W Hall Pen , peninsula. 75 65"00'N 66"00W
4S"00'E ,,",M.GA. 51 32"28'N B4°S9'W DenmerkStr., strait 45 6S"00'N 31'OO'W Georgia, country 84 43°00'N 43"00'E Hamburg, Germany . 84 53"33'N 10'01'E
;2°19'W ra.-. OH . 51 39°S8'N 83"00W Denver, CO 50 39°44'N 104°S9W Fairbanks,AK 50 64"SO'N 141'43W Georgia, state, U.s 51 33"00'N 83"00W Hamersley Range,
~. Mexico. .. 76 16°1S'N srsr« Dese, Ethiopia. 90 11°10'N 39"311 Farsalebad. Pakistan 96 31°24'N 73'On Germany,country 84 S2'00'N 11"oo'E mocn tems 103 23'00'5 118'OO'E
n-oow ~ RlVadavla, Des Memes, IA 51 41'36N 93' 31W Falcon Res" lake 77 21'OON 99'OOW Ghedamrs.libya 90 30'08'N 9'3 0'E Hamilton. Canada . 74 43' I6N 19'5IW
l1"OO'W .ooa, 78 45"51'5 67"29W Des MOines. nver 55 43'ooN 94°OOW Falkland Is.• Ghana. country 90 9'OO'N 2"00W Hamilton. NewZealand 102 31'415 175'18'E
23"S4'E
c..m.C.Cd!" . 97 8"00'N 78'oo'E Desne, nver 85 S2'OON 32'oo'E dependency, UK 78 52"00'5 59'OOW Gbardae . Algena 90 32'30'N 3'40'E Hernrnertest. Norway . 84 70'40N 23'42'E
2°00'W Caooros.country .. 90 12"00'5 43'OO'E Detroit, MI 51 42°20'N 83'03W Falkland Is., Islands 79 52'00'5 S9'OOW Gibraltar, dependency, U.K 84 37"00'N 5'OOW Hannover, Germany . 84 S2'22'N 9'4S'E
'1°39'W CaromsIs..islands . 91 11'00'5 43'oo'E Devon I, Island 75 16'OON 85'OOW Farewell,C, cape 45 60'OO'N 44°OOW Gibraltar.Str.of, strait 85 36'OO'N 6'OOW HanOI, Vietnam . 96 21'02'N 105'49'E
S' OO'W Cooairy,Guinea ... 90 9°31'N 13'42W Dhaka, Bangladesh 96 23'43N 9O"26'E Fargo, ND 50 46'S3'N 96'41W Gibson Desert, desert 103 25'00'5 12I'OO'E Happy Valley-Goose Bay.
'(J°49'W
~, Chlle. " .. 78 36'48'5 13'02W Dretenbaker, L. fake 75 SO'oo'N 10l'OOW Faro. Canada 74 62'16'N 133'24W Gllon, Spam 84 43'32'N S041W Canada . 74 S3'20'N 60'23W
22'OO'E CcrcepciOn.Paraguay . 78 23'23'5 SI'2SW DIJon, France 84 47"20'N S' 02'E Faroe ls., dependency,Den. 84 62'OO'N 7"OOW Gila, fiver 54 33'oo'N 112'OOW Harare, Zimbabwe. . 90 11'49'5 31"03'E
""""",,,IOro. Dill. EastTImor 96 8'35'5 12S'36'E Faroe ts..Islands 85 62'OO'N rar« Gilbert ls., ,slands 103 0'00' 173'oo'E Harbin, China . 96 4S'43N 126'43 E
22'oo'E _..........
76 24°36'N 101°26W Dmanc Alps. mountams 85 44'OON 17"00'E Faya-Largeau, Chad 90 1I' 56N 19' OI E Giza,Egypt 90 30'01'N 31' 13'E Hargeysa, SomalIa . 90 9°31'N 44"03'E
S'OO'W Ccrapb:n, Pt., cape. . 54 34'oo'N 120'OOW DireDews, Ethiopia 90 9'36N 41' 52'E Fear,C , cape 55 34'OO'N 18'OOW Glama.flver 85 60'OO'N l1'OO'E Harnsourg, PA . 51 40' I6N 16'S3W
O"OO'W Cmx:nos,rr.'t'f.. 77 29'OO'N 10S"OOW DirkHartog I.,,sland 103 26'00'5 I13'oo'E Federated States Glasgow.United Kmgdom 84 5S'51'N 4°16W Hartford. CT . 51 41°46'N 72'41'W
59' oo'E UJwd. NH,. 51 43°12'N 1I' 32W Drstnto Federal, of Mrconesra,country 102 6' oo'N ISO'oo'E Gobi, desert 97 43' oo'N ' OS'OO'E Hatteras, C. cape . 55 35'OO'N IS'OOW
43'OO'E Cltgo,nver. 91 2'oo'N 22'oo'E fed dlst., Mex 76 19'OON 1OI'ooW Feee de Santana. Braz,1 78 12"15'5 38'S8W Gcdaven.fiver 97 19'OO'N 78'OO'E Havana, Cuba 44 23'09'N 82'23'W
l#Igo Sasln,basrn.. 91 1'00'5 23'OO'E DJibouti. country 90 l1'oo' N 4I'OO'E Fes. Morocco 90 34'04'N 4'58W GoliIOla, Braz,/. 78 16' 42'5 49°1SW Havre-St-Piene. Canada 74 SO'IS'N 63'36W
37'oo' E '1l'I«tICUt,nver .. 55 42'OO'N 13'OOW Djibouti, DJibouti. 90 11°34'N 43'08'E Feuriles. Raux, fiver 75 S8'OO'N 73'OOW Gold Coast, Australia 102 27'57'5 IS3'23'E Hawaii,Island . 54 20'oo'N ISS'OO'W
-.::Kut.state, IJS 51 42'oo'N 13'OOW Dnieper.flvel 85 4I'OO'N 33'OO'E Fe narantsoa. Madagascar. 90 21'2 7'5 41'04'E Gold Coast, region 91 S' oo'N roow Hawaii,state, US . SO 2I'OO'N IS8'OOW
36'OO'E --.ce,L., lake .. 85 48'oo'N 9'OO'E Dnieper Upland, highlands 85 49°00'N 32'OO'E FiJI, country 102 19'00'5 118'OO'E Gonder, Ethiopia. 90 12' 34'N 37'26'E Hawauan Is..,slands . 54 2I'OO'N ISI"OOW
l'OO'W mtta , Romanl<l . 84 44°11'N 28'39'E Druester,river 85 49'OO'N 26'oo'E FijiSea, sea 103 21'00'5 177'OO'E Good Hope. C of, cape 91 35'00'5 18'oo'E Hay, fiver . 75 58'00 N 118'OOW
O'OO'W '~,AlgeFla .. 90 36'22'N 6' 36'E Drupropetrovs'k. Ukraine 84 48°27'N 34' S9'E Filchner Ice Shelf, ICe shelf 15 80'00'5 40'OOW Goteborg. Sweden 84 S7"42'N 11' 56'E Hay River,Canada 74 60'49'N 115'46W
19'oo'E
',def""d",cy. NZ 102 20'00'5 IS8'OOW Dcdoma. Tanzania 90 6'09'5 3S'42'E Fnobulke Shelf, Iceshelf 15 10'00'5 S'OO'W Gotland, Island 85 S7'OO'N 18'OO'E Hearst, Canada . 74 49°42'N 83'40W
14'oo' E ott ls.. I$i'~nds . 103 20'00'5 IS8'ooW Doha, Datar 96 2S'lS 'N SI'26'E Fsusterre. C; cape 85 43'oo'N 9'OOW Govemedorvaladares. Hecate Str.,strait . 75 S3'OO'N 13I'ooW
4'OO'W lI1. Mt,peak . 103 44'00'5 170'OO'E Dommca. country 44 16°00'N 61'OOW Finland, country 84 66"OO'N 26'OO'E Brazll 78 18'51'5 41'S9W Helena. MT . 50 46'36N 112'02W
25°18'E Str"strait .. 103 41'00 5 174°00'E DominicanRep, country 44 20'oo'N 10'OOW Finland, G of, gulf 85 60'OO'N 26'OO'E Grain Coast, region 91 6°oo'N 10'OOW Helsnkr,FInland 84 6O'11'N 24'56'E
13'On ~, Denmark . 84 S5°41'N 12'35'E Don. river 85 48°00'N 40'OO'E Fitzroy, river 103 18°OO'S 12S'oo'E Granada, Spain 84 37c
ll 'N 3'36W Hermosillo, MeXICO .76 29'04'N 110'SSW
12'oo'E ~,cn,Je .. 78 21'23'5 IO' I8W Dcnets. fiver 85 49°00'N 38'OO'E Flagstaff, AZ 50 3S' 12'N 111'39W Gran Chaco. plain 79 23'00'5 62' OO'W Herrero, Pt., cape . 77 19'00N 81'OOW
0'00 'W Unyon, canyon 77 27'ooN 108'OO'W Donets Basm. basm 85 48°00'N 38'oo'E Flattery.C. cape 54 48'OO'N 125'OOW Grand, fiver. 55 43°00'N 86'OOW HIdalgo, state. Mex . 76 21'OO'N 99'OOW
SeJ,sea.. 103 15'00'5 ISS'oo'E Donets'k.Ukrame 84 48' 01'N 37'48'E Fhoders, fiver 103 19'00'5 141°00'E Grand Canyon, canyon 54 36'OO'N 113'OOW Hidalgo del Parra', MeXICO . 76 26'S6'N IOS'41W
9'09'W Se.1 Is1ands Ierr., Douala. Cameroon 90 4°03'N 9'43'E Fhnders I., Island 103 40'00'5 148'OO'E Grande, river. 79 20'00'5 48'OOW Highlands, mountams . 85 SI'OO'N S'OO'W
s-cow ~, AustJ . 102 11'00'5 ISO'OO'E Douredos, BrazJl 78 22"14'5 54"48W Flinders Ranges, rnounrans 103 32'00'5 139'OO'E Grande Prame.Canada 74 Ss011'N llB048W High Level. Canada 74 S8'31'N 117'06W
18'oo'E 'lCob.1.Argerltina . 78 31'23'5 64°11W Dourc, nvet . 85 43°0l)'N ror« FlmHen Canada 74 S4°48'N 101°S2W Grand Erg OCCidental, Hnumea I.. ,sland . 85 S9'OO'N 22'OO'E
1'S6'W 'lIilba, Spaln.. 84 37'S3'N 4°47W Dover,DE 51 39'09'N 7S'31W Flmt,MI 51 43'OI'N 83c4
1'W desert 91 31°00'N 2'O~'E Hilo, HI 50 19°44'N 15S·0S'W
1'3 8'W Ireland.. 84 S1'S4N 8'28W Dover.Str of,strait 85 51'OO'N I'OO'E Flmt.nver 55 31' oo'N 84°00W Grand Erg Onental.desert 91 31'00'N 8'OO'E HImalayas, mountains 97 27'00'N 86'oo'E
)'S l'W Brook Canada . 74 48'S7'N 57'51W Drakensberq, mountains 91 30'00'5 30'OO'E Flint Hills. hIlls 55 38'OO'N 97'00W Grand Falls-wmdsor. HinduKush, mountains . 97 3S'OO N 71'OO'E
3"08'W .Ceaca. 74 45'02N 74°45'W Drake Passage.strait 14 60'00'5 10'OOW Fllntl, Island. 103 11'00'5 IS2'OOW Canada 74 49'OO'N SS'3SW HIspaniola. ,sland . 45 18'OON 69'OO'W
''OO'W 1rjM000stl.TX... 50 27°48'N 97"24W Dresden, Germany 84 SI'03'N 13'44'E Florence. Italy 84 43'46'N 11°15'E Grand Forks,ND 50 41' S6'N 97'02W Hobart. Australia 102 42'48'5 14r18'E
s-cow ",les,Atgentma .. 78 27'30'5 S8'49W Dryden, Canada 74 49°47'N 92°49W Florence . Colombia 78 l'36'N IS'3SW Grand Rapids. MI 51 42°58'N 85'40W Ho Chi Minh City. Vietnam . 96 IO'43'N 106'43'E
S'19'W 'flle!1t~.c.,cape . 77 2O'OON 100"OOW Dobawnt. fiver 75 63'OON 104'OOW Floneno. BrazJI 78 6'4 7'5 43' ooW GranrtePeak. peak 54 45'OO'N 110'OOW Hokkaoo. Island . 97 44°00'N 143'oo'E
l1°26'E .O'SQ.lsland,. 85 43'OO'N 9'oo'E Dubawot L, lake 75 63'oo'N teo-cow Plonanopohs.Brazil 78 21'36'5 4B034W Graz,A ustfla 84 47"OSN IS'21'E Holman,Canada . 74 70043'N llr41'W
W06'E ~, Brazil .... 78 19'01'5 SI'38 W Dublin, Ireland 84 S3'21'N 6' I6W Honda. state, U.S 51 29'OO'N 82"OOW Great ArtesianBasin, baSin 103 22'00'5 141'oo'E Homel', Belarus . 84 S2'29N 31'oo'E
~' 16'E
'15laRica.counrry . 44 10'OON 85'OOW Dubrovmk.Croatia 84 42'39'N 18'OS'E Honda Keys, Islands 55 2S'oo'N 82'OOW Great Australian Sight. bay 103 34'00'5 130'OO'E Honduras, corJfltry . 44 1rOO'1I 8S'OOW
!5°S9'E CDlf d'''''OIre,counrry.. 90 S'OO'N s-cow Duluth, MN 51 46°47'N n'06W Honda, Straits of, strait 45 24'OO'N 82'OOW Great BarnerI, 'sland. 103 36'00'5 175'OO'E Hong. rwer 97 23'oo'N 100'oo'E
11'oo'E ___ I...", .. 77 20'OON 81'00W Dund-Us. Mongolia 96 41' S9N 9,'39 'E Former Yugoslav Rep. Great BarnerReef, reef 103 15'00'5 146'OO'E Hong Kong. Chrn . 96 22'1SN 114°11'E_.ea_.. a
/'oo'W 11S046W14 49"31"N Dunedin, New Zealand 102 45'52'5 110'28'E of Macedonia. country. 84 4I'OO'N 22'OO'E Great Bassi. baSin 54 40'OO'N II I'OOW Home-a,Solomon Islands '02 9'19'5 :W·44·E
1' 17'W CrttL,Jake .. 75 SI'OO'N 108'OOW Durango, Mex!Co 76 24'02'N 104'39W Fortaleza. BraZIl 78 3' 46'5 38'33W Great Bear l. . /ake 75 6S'OO'N 120'OOW Honolulu. HI . 50 21°18'N 157°Sl'W
roow U!I!,i5Jar,d .. . ... . 85 3S'OO'N 2S'00'E Durango, state, Mex 76 24'OO'N 100'OOW FortCollms. CO 50 40'3S'N 10S'OSW Great Dlvldmg Range, Honshu. Island . 97 31'OON 140'OO'E
I ~OO 'W
tftt!.Seaof.sea.... 85 36'oo'N 2S'oo'E Durban. S Afflca 90 29'50'5 31'01'E FortFrances, Canada 74 48'38'N 93'23W mountams 103 22'00'5 149'OO'E Hood. Mt., peak . 54 45'OON 122'OOW
" 49'W Crmea, peninsu!a ,. 85 45°00'N 34'OO'E Dushanbe, Tajikistan 96 38'34'N 68'48'E Fortl auderdale, Fl 51 26'Ol'N 80'00W Greater Antilles, Islands 45 18'OON IS'OOW Hormuz. Str of, strait . 97 26'OO'N S6'OO'E
roow Uo.Jt.a,coontry .. .... 84 45'OO'N 15'OO'E Dzonqanen Basn . basm 97 45'OO'N 88'OO'E Fort McMurray,Canada 74 S6°41'N 111°22'W Greater Khmgan Range, Horn, C. cape . 79 56'00'5 68°00W
~021 'W
CslizefodoSul,BraziJ.. 78 7'38'5 72°40'W Fort McPherson, Canada 74 67'26'N 134' S2W mountainS 97 4s000'N 118'OO'E Hornof Afnca, regIon . 91 9'oo'N 4r OO'E
IOJ9'W
Cuwldo,river . 91 15'00'5 22'OO'E Fort Nelson, Canada 74 S8·4]·N 122' 42W Greater Sunde ts.,,slands 97 5'00'5 110'OO'E Horen. China . 96 3I'OS'N 19'54'E
~049'W
uatltemoc.Me...cc . 76 28'2S'N 106'SIW Fort Peck L, lake. 54 48'OO'N 101'00W Great Falls, MT 50 4r 30'N 111°18'W Houston, TX . 51 29'46'N 9S'22W
I'OS'W Ula"""tty....... 44 22"00'N 8O'OOW FortSt John, Canada 74 S6'13'N 120'SlW Great Plalns,plaln 45 4S'OO'N 105'OOW Howland I,
jOOO'w
C......'" ..... 45 22"OON 80'OOW Esst CbmaSea. sea 97 29'oo'N I24'OO'E FortSrmpson, Canada 74 61°50'N 121°21W Great Salt L, lake 54 4I'OO'N 113'OOW dependency, U S 102 l' oo'N 177'OOW
j003'W
Ubango,llV{'r ...... 91 15'00'5 18°oo'E Easter ' , dependency 16 21'07'5 109'22W FortSmith, AR. 51 3S'23N 94°24W Great SaltLake Desert, Howland I., Island 103 I'OO'N 177'OOW
,0OO'W
GIMa, Colombia . . 78 1'53" 12'29W Easter I,I sland 14 21' 07'5 109'22W FortSmith, Canada 74 6O'00'N 111' SIW desert 54 41°00N 114°00'W Hrodna. Belarus 84 53'41'N 23'Sn
I'OO'W 97c19W
GJenca,Ecuador...... 78 2'54'5 79°01W Eastern Desert, desert. 91 26'OO'N 32'oo'E FortWorth, TX 50 32'44'N Great SandyDesert, desert . 103 21'00'5 12S'OO'E HuaJuapan de Leon,Mex!Co 76 11'48'N 91'41'W
" oo'W ~aca, Mexico .. 76 18'SS'N 99'14W Eastern Ghats. mountarns 97 lS'OO'N 82'OO'E PoxeBasin, bay 75 66'OON 79"OOW Great SlsveL, lake 75 63'OO'N 115'OOW Huambo, Angola . 90 12'46'5 IS'44'E
!OO6'W
Gaba.8laziI.. 78 15'35'5 S6'OlW East London. 5 Afflca 90 33'00'5 21'54'E Foxe Pen.. penmsula 75 6S'oo'N 78°00W Great VletOna Desert, Huancayo, Peru 78 12'05'5 7S°13'W
l'oo'W Ub. Mexico........ 76 24°47'N 10r 23W East Sibenan Sea, sea 97 73'OO'N 165'OO'E France. country 84 4I'OO'N 2'OO'E desert 103 28'00'5 I28'OO'E Huang (Yellow), fiver 97 37'OO N 111"OO'E
"'31'W IiJl'lJ'Ia,VenellJela . .. 78 10'27" 64' I1W East Timor, country 96 9'00'5 12S'oo'E Franceville,Gabon 90 1'39'5 13'34'E Greece, country 84 39'OO'N 22'OO'E Huanuco, Peru 78 9' 54'5 76' I6W
l03S'W
·J'l'tlerland, river ,........ 55 37'OO'N 88'OOW Ebro, fIVer 85 43·00'N 2'OOW FranCistown, Botswana 90 21'12'5 27'32'E Green, fiver 55 38'OO'N 8I' OO'W Huascaran. MI.. peak 79 9'00'5 18'OOW
8'oo'E ItIOerland Pen.•penmsula .75 66'ooN 6S'ooW Ecuador,country 78 2'00'5 80'00W Frankfort, KY 51 3Bo12'N 84°52W Green, fiver 54 42'OO'N 110'OOW Hudson, fiver 55 42'OO'N 14'OOW
7' SO'E ~and PlaL. plateau , . 55 3S'oo'N 8S'OOW Edinburgh, United Kingdom . 84 SS'S7'N 3'11W Frankfurt, Germany 84 SO'07'N 8°41'E Green Bay,WI 51 44°31'N 88' 01W Hudson Bay, bay 75 S9'OON 8S'ooW
"02 'W ~nd Sound, bay .... 75 6S'oo'N 6S'OOW Edmonton. Canada 74 S3'3S'N 113'31'W Franz Josef land, ,slands. 97 81'OO'N SS'oo'E Greenland. ,sland 45 IS'OON 40'OOW Hudson Str, strait 75 63'OON 73'OOW
B051'E
lQliO.isJand... . ,...... 45 12°10'N 69'OOW Edwards Plat.. plateau 54 31'oo'N 10l'ooW Fraser, nver 75 S2'OON 123'OOW Greenland (KalaalhtNunaat), Hull, Canada 74 4S' 26'N 7s044'W
1'26 'E BrazIJ............ 7B 25'215 49·16W Egypt,country. 90 26'OO'N 29'OO'E Fraser L,,sland 103 25'00'5 IS3'OO'E dependency, Den. 44 IS'ooN 40'00W Humphreys Peak,peak 54 3S'00'N I1I"OOW
,'29'E Pou .. 78 13'325 71"S6W Elba, Island 85 43°00'N 10'OO'E Fredericton. Canada 74 4S' S7'N 66°40W GreenlandSea, sea 15 6S'OON IO'OOW Hungary. country 84 47'00'N 19'OO'E
:lldes. l5lands.. .. 85 31'OO'N 2S'oo'E Elbe, fiver 85 S4°00'N l1'oo'E Freetown. SIerra leone 90 8'27N 13' 13W Green Mts., mountains . 55 44°00'N 73'OOW HuntSVille. Al 51 34°44'N 86'3SW
2' 37'E :l!i.rounuy .......... 96 3S'OO'N 33'oo'E Elbert,Mt.,peak 54 39'OO'N 106'OOW French GUiana. Greensboro, NC 51 36°04'N 79°48W Huron. L, lake 45 41'oo'N 82'OOW
'OO'W lIJI6,iSlatTd . , . 97 3S'OO'N 33'oo'E Elbrus. Mt., peak 85 43'oo'N 42'oo'E dependency,Fr 78 4'OO'N S2'OOW Grenada, country 44 12'OON 62'OOW Hyderabad, India 96 11' 20'N 78°31'E
'OO'W Q,reglon........ . 91 2S'OO'N 24'OO'E ElburzMts., mountams 97 36'00'N S3'oo'E French PolyneSia. GnJalva, fIVer 77 II'OON 93'OOW
09'W UJdl Rep.,country ., . . . . . 84 49000'N lS'OO'E Eldoret, Kenya 90 O'32'N 3S' 16'E dependency,Fr 102 15'00'5 140'OOW Groote I., Island 103 14'00'5 137'OOE
'oo'W EIFashlr. Sudan 90 13'38'N 2S'21'E French Polynesra. ,slands 103 15'00'5 140'OOW Groznyy,RUSSia 84 43°24'N 45'41'E
800'W
EIKharga. Egypt 90 2S'27'N 30'33'E Fresndlo. Mex!Co 76 23'10'N 102'SIW Guadalaj31a, MeXICO 76 20'4~'N 103'21'W
'OO'W 84 41' ION 21'36'EEllesmere I, Island 75 83'OO'N 16'OOW Fresno.CA 50 36' 45'N 119'46W Guadalcanal l , ls/and 103 10'00'5 160'oo'E
827'W
90 7'24N 3'S3'EEllJot Lake, Canada 74 46' 23'N 82'39W Frla. C, cape 91 18'00'5 12'OO'E Guadalupe I, Island 77 29'OO'N 118'00'W
'S6'W 78 4°24'N 7S01SWs..g.1 .......... 90 14°42'N lr27W Ellsworth Land, region '5 76'00'5 90'OOW FriSian Is,. islands 85 54'OON 6'OO'E Guadalupe Peak. peak . 54 32'OON 104'OOW
' 32'W 85 41'OO'N 4'OOWJX . ........ 50 32'4/'N 96°48W Ellsworth Mts., mountains 15 80'00'5 8S'OOW FrODlsher Bay,bay 75 64'OO'N 66'OOW Guadeloupe,
' 10'W .reglon. .. . ..... 85 44'ooN 16"00'E EIObeld, Sudan 90 13°l 1'N 3O'13'E Front Range, mountains 54 40'OO'N 10S'OO'W dependency, Fr. 44 18'OO'N 62' OOW
85 39'OO'N I' OO'E
_ Iand.legion,. . 91 21'00'5 19'OO'E EIPaso, TX 50 31'46'N 106'29'W Fuerte, fiver 77 26'oo'N 109'OOW Guadlana, fiver 85 39"00'N 8"OOW 78 14'03'5 IS'4SW
'42 'W ~scus, Syria . ..... 96 33'31'N 36'18'E EISalvador, country 44 14'OON 89'OOW FUJI, Mt.,peak 97 3S'21'N 138°44'E Guaw a-Mlnm, BraZil 78 10'48'5 6S'22W 84 6S'ooN 18'OOW
:!~. Cap, cape ... 91 12'00'5 48'00'E EITigre,Venezuela 78 8'S3'N 64'16W Funafuti, Tuvalu 102 8'37'5 m '07'E Guam, dependency, U.S. 102 13'OO'N 14S'OO'E Iceland, ,sland 85 6S'oo'N 1B"OOW
'49'W OtNallg,Vretnam . . 96 16"03'N 108"2 'E Eml Koussl,peak 91 19'OO'N 2I'OO'E Fundy. Bayof,bay 75 45'OON 67'00W Guam, lsland 103 13°00'N 14S'OO'E Idaho, state, US SO 44"OO'N 114°00'W
'01'W .rlVer.• . 85 49000'N 10'oo'E EncarnaCion. Paraguay 78 27'20'5 SS' S2W Fuzhou. China 96 26'04N 119' 18'E GuanaJuato, MeXICO 76 21°00'N 101°17W Iguala, MexICO 76 18'21N 9'I'32W
'38'W DnbeDeita,deita. . .. 85 45'OO'N 29'OO'E Encounter Bay, bay 103 31'00'5 139'00'E Guanajuato, state.Mex 76 22'OO'N 101'OOW Iguazu Falls. falls 79 26'00'5 S5'OOW
'27W ~, srrait ........ 85 .lO"OO'N 21'OO'E Enderby Land, region 15 70'00'5 40'00'E Guangzhou, China 96 23'08N 113'18'E lIebo. Dem.Rep of Congo 90 4'20'5 20'38'E
'S6'W ts Sa~am. Tanzania . .. 90 6'495 39' 17'E England. dIVISIon, U.K 84 52'OO'N 2"OOW Guapore, liver. 79 '3'00'5 63'OOW Ilheus, BraZil 78 14°47'5 39'03W
'S6'W
OIrimg, river" . .. 103 31'00'5 144'oo'E English Channel, strait 85 SO'OON 4'OOW Guasave, MeXICO. 76 2S'34'N 108'29W IIhmanl. MI., peak 79 1rOO'S 68'OO'W
'08'W !¥wrJ,Australia ...... .. 102 12"2S'S 130'S3'E Ensenada, MeXICO 76 31' S2'N 116' 31W Gabes. G of, gulf 91 34'OO'N 12'00'E Guatemala, country. 44 16"OO'N 91'OOW illinOIS. fiver. 55 4I'OO'N 90'OOW
tTw t:til1+Kavir.desert ...... 97 3S'OO'N S4°00'E Equatonal GUinea, country 90 2'OO'N ll 'OO'E Gabon. country 90 0'00' 12'OO'E Guatemala CIty.Guatemala 44 14°37'N 90'31W illinOIS, state, U.s. 51 4I'OO'N 89'OOW
OO'W o..g."".L.,.•.. . 84 SS'53'N 26'32'E Erg Chech, desert 91 24'OON 3'OOW Gaborone, Botswana 90 24'38'5 2S'SS'E GuayaqUIl, Ecuador. 78 2' 12'5 79°54W 1I0rln, Mgefla 90 8'29'N 4' 33'E
42'W ~1Il. CanadJ ....... 74 51"10'N l00"04W Ene, PA 51 42'08N 80'05W Galapagos Is" Islands 79 1'00'5 91°00W GuayaqUILG of, gulf 79 3'00'5 80'OOW Imperatnz, Brazr! 78 5'29'5 47' 30'W
OO'W Dfoo.Philippines . ...... 96 1'04'N 125'36'E Ene, L., lake 45 43'OON 83'OOW Galdh0plggen, peak 85 62'OO'N 8'OO'E Guaymas, MeXICO 76 27'5S'N 110'S3W I.n-Amenas,Algena 90 28'03'N 9'34'E
llO'W o...,.n, lA .......... 51 41°31'N 9O'3SW Entrea, country 90 18'OO'N 38'OO'E Galveston Bay, bay 55 29'OO'N 95'OOW Guernsey, ,sland 85 49' OO'N 3'OOW India. country 96 23'oo'N 79'oo'E
OO'W r.vtsSea. sea . .. . . . 15 65'005 9S'OO'E Esfahan, Iran 96 32'39'N SI'3 9'E Gambia. country 90 12'oo' N 18'oo'E Guerrero, state. Mex 76 1I'OO'N 10l'OOW Indiana. state, US 51 4I'OO'N 86'OOW
SOW Of..Is S:r.,walt . ...... .. . 45 66'ooN S8'ooW Esmeraldas, Ecuador 78 O'SIN 79°40W Gander, Canada 74 48' S7'N 54'36'W Guerrero Negro, MexICO 76 21' S8'N 114'03W Indianapolis, iN 51 39'46'N 86'09W
08'W ~. CJnada ........ . 74 64°04'N 139°24W Esplntu Santo, ,sland 103 15'00'5 167"00'E Ganges, river 97 2S'OO'N 80'OO'E GUIanaHrghlands, plateau 79 S'OO'N 62'OOW Indian Ocean, ocean 15 10'00'5 80'00'E
OO'W Oiwlon Creek. Canada .... 74 55"4S'N 12001SW Esquel, Argentina 78 42' 55'5 1I'20W Gangetic Plain, plain 97 28'oo'N 81'oo'E GUinea, country. 90 l1'OO'N 12'OOW Indochina Pen , penmsula 97 16'oo'N 10S'oo'E
4j 'W
1It,Ioo.0H... . . .. . . . . . . 51 39'46'N 84°12W Essen. Germany 84 51'21N 7'03'E Gao,Mali 90 16'16'N O'OO'E GUinea·BISsaU, country 90 12'OO'N 16'OOW IndoneSia, country 96 2'00'5 119'oo'E
OO'W ~Sea, depressIon ..... 97 31'oo'N 3S'oo'E Estevan. Canada 74 49'08N 103'OOW Garonne, nver 85 4S'OO'N 0'00' GUinea. G of, gulf 91 2'OO'N 3'OO'E Indus, fiver 97 31'OO'N 71'OO'E
S6'E Val.,dE'fJl'f.'Ssion 54 36'00'N 117'OOW Estonia, country 84 59'OO'N 29'OO'E Garoua, Cameroon 90 9' 18'N 13'231 GUlyang, China 96 26'36'N 106'41'E InfiernilioRes., lake 77 19'oo'N 102"OO'W
OO'W r.t.ao,H ""9'~ ....... 84 47'32N 21'39'E Ethiopia, country 90 8'OO'N 40"00'E GarryL., lake 75 WOO'N 100'OOW GulfCoastal Plain. plain 55 30'OO'N 93'OOW I-n-Salah, Algena. 90 21'12'N 2"31'E
S2'E 'aIa.I1....... ...... 51 39°50'N 88'SIW Ethiopian Highlands, plateau. 91 9'OO'N 39'oo'E Gary, IN 51 41' 36'N 87'21W Gurupl. BraZIl 78 11°46'5 49'OSW Inuvlk, Canada 74 68'22'N 133'42W
'W im.r1P1al,plateau ...... 97 23'ooN 79'OO'E Etna, Mt., peak 85 38'OO'N IS'oo'E Gaspe, Canada 74 48' SO'N 64"30W Guyana, country 78 7'OO'N S9'OOW Ionian Sea. sea 85 37'00N 19'00'E
OO'W r-uware,nver.. .. .. .. 55 42'00'N 75'OOW Eugene, OR 50 44'03'N 123'OSW Gaspe Pen., peninsula. 75 49'OO'N 63'OOW Gwardafuy, C, cape 91 12'OO'N SI'OO'E Iowa. liver 55 43'OON 93'OOW
DO'W _are, slate, U.S,. . 51 39'00'N 74'OOW Eugenia Pt., cape 77 28'OO'N 115'OOW Gdansk, Poland. 84 S4'22'N 18'38'E Gweru,Z,mbabwe. 90 19'28'5 29'49'E Iowa, state, U S 51 43'ooN 94'OOW
OO'W I'IoIIm Bay,bay ........ 55 39'OO'N 75°00W Euphrates, river 97 33'ooN 42'OO'E Gedaref, Sudan 90 14"02'N 3S'23'E Iqalutt, Canada 74 63'4S'N 68'26W
1Igm.c..cape. . 91 10'00'5 41'oo'E Europe. continent 15 SO'OO'N 10' OO'E Geelong, AustraiJa 102 38'11'5 144'23'E IqUlque, Ch,le 78 20°14'5 70'07W~:~ .... . 96 28'41'N 1I'12'E EvanSVille, IN 51 31'58'N 81'33W Genesee. fiver 55 43'OO'N 18'OOW IqUitos, Peru 78 3'45'5 73'11W
DO'W , Me~ico ........ 76 28°12'N lOs028W Everest, Mt., peak 97 27'S9'N 86'S6'E Geneva.SWitzerland 84 46°12'N 6'09'E Irakho, Greece 84 3S'20N 2S'08'E
2'W c..",,*, .......... 74 6S012'N 123°2TW Eyre, L., lake 103 29"00'5 137'00'E Geneva, L.,lake 85 46°00'N 7'OO'E Harnan, Island . 97 19'OO'N 110'OO'E Iran, country 96 3I'OO'N S7'oo'E
'W -n:ra!lc Rep Eyre Pen , peninsula 103 33'00'5 I36'oo'E Genoa, Italy 84 44°2S'N 8'S6'E Hartl, country 44 19'OO'N 73'OOW Irapuato. MeXICO 76 20' 39'N 10l'22W
~the Coogo. country ." 90 1'00'5 21'oo'E Geograpfle Bay, bay 103 33'00'5 I1S'OO'E Halifax,Canada 74 44°38'N 63'36W Iraq, country 96 32'00'N 4I'OO'E
lasl. Romania
Ibadan, N'gefla
Ibague, Colombia
Iberian Pen , peninsula
Iblza, Island
Ica, Peru
Iceland, country](https://image.slidesharecdn.com/student-world-atlas-malestrom-161219130615/85/Student-world-atlas-111-320.jpg)
![I
Page lat itude Longitude Page latitude Longitude Page Latitude Longitude Page Latitude Longitude Page Latitude Lo~
Sewarc Pen , penrnsula 54 65'OO'N 165'OOW Sude], five' 97 31'OO'N 73' 00'[ Tombiqbee. Mer. 55 34'oo'N 89'OOW vatencra. Venezuela 78 10'Il'N 67'S8W WestVirginia, state, US .. 51 39'oo'N 81
Seychelles, country 90 9'00 '5 S2'OO'E Suva, Fiji 102 17" 8'5 178' 32'[ Tombouctou, Mal, 90 16' , S'N 3'02W Valera, Venezuela 78 9' I9'N 70'38W Wheeler Peak, peak .. 54 37'OO'N 10S'OOI
SeychellesIs., Islands 91 8' 00'5 S2'OO'E Svalbard, Islands 15 78'OO'N 18'00' [ Iomsk, RUSSia 96 S6'28 'N 8"59'[ valladohd. MeXICO 76 200
41N 88'I2W Wheeling, AIV .. 51 ' O"04'N 80"
Sfax, Tunls,a 90 34"47N IO'46'E Swaziland. country 90 28' 00'5 29'00'[ Ionala. MeXICO 76 16'03 'N 93' 44W valladohd. Spam 84 " '39'N 4"43'W White, fiver · 55 3S'OO'N 91m
Shackleton IceShelf, Sweden, country 84 61' OO'N 15'00' [ Tonga,country 102 20' 00'5 17S'OO'W Valletta, Malta 84 3S'S''N , " 31'[ Whlte, rlver .. 55 39"00'N 87'OCl
ICe shelf IS 64' 00'5 100'00 '[ SWiftCurrent, Canada 74 SO"17'N 107"47'W Tonga, Islands 103 20' 00'5 17S'OOW valparaiso, Chile 78 33' 02'5 71'38 W White, river .. 54 44"OO'N 101'00'1
ShanghaI, Chilla 96 31"12'N 121'28 '[ SWitzerland, country 84 '6' OO'N 8' 00'[ Tongareva Is. ,slands 103 10'00'5 IS8'OOW Vancouver,Canada 74 '9' IS'N 123' 07W whrtecourt. Canada . 74 S4"OTN 115'39'1
Shasta, Ml., peak 54 42' OO'N 122'OOW Sydney, Australia 102 33'5"5 151' 12'[ Ioowoomba.Australia 102 27'3 "5 151' 59'[ Vancouver I., Island 75 '9'OO'N 127' OOW Whitehorse, Canada .. 74 6O'44'N 13S't'
Shaweuqan, Canada 74 46'33 'N 72'4SW Sydney, Canada 74 46"09'N 60"12'W Topeka.KS 51 39'03 'N 9S' 41W vanem. lake 85 S9"00'N 13' 00'[ White Mts., mountains .. 55 'S ' oo'N 71'1l1l
Sheffield, UnJted Kingdom 84 S3'22 'N 1' 28W Syktyvkar, RUSSia 84 61"4TN Sl"02'E Iormo, river. 85 68'OO'N 21'00 '[ vanua Levu, Island 103 16'00 '5 179'00 '[ White Nile, Mer .. 91 12'OO'N 32't
Shenyang,Chona 96 41"49'N 123'30 '[ Syracuse, NY 51 '3'03'N 76'09W Toronto, Canada 74 43'3 9'N 79"23W Vanuatu,country 102 17"00'5 167'00 '[ White Sea, sea .. 85 66' oo'N 36W!
Shert eooke, Canada 74 45"24N 71"53'W SyrDarya,fiver 97 44'OO'N 68'00 '[ Torreon, MeXICO 76 2S'32 'N 103"27W Varna, Bulgaria 84 ' 3"12'N 27'55'[ Whitney, Mr.,peak .. 54 37'OO'N 119'1lJ'1
Shetland Is ,lslands 85 60' OO'N l"OO'W SYria, country 96 3S'OO'N 38'00'[ Torres Str., straIt 103 10'00'5 "2'OO'E Vatican City, country 84 ' 2'OO'N 12'00' [ whcldaraL., lake. , 75 62'OO'N 105'001
Sbxokc, Island 97 33' OON 133'00' [ SynanDesert, desert 97 32"OO'N '0'00'[ Touggourt,Algena 90 33'07 'N 6'0 " [ Vatnajokull, glaCier 85 67'OO'N 16'OOW whyalla. AustralIa , 102 33'01'5 137':;::
Shdke. river 97 S2' OO'N 10S'OO'E Szczecn. Poland 84 S3'26 'N 14' 33'[ Toulon, France 84 43'08 'N 5'57'[ vartem. face 85 S8' OO'N 14' 00'[ Wlchlta,KS 50 37"2'N 97'2'1l
Sh,raz, lran 96 29'37 'N S2'32 'E Toulouse, France 84 43'36 'N 1'28'[ Velikly Novgorod, RUSSia 84 S8']2'N 31°14'E Wiihelm, Mt.,peak , 103 6'00'5 145'0:'
Shreveport, LA 51 32'31'N 93"45'W Tours, France 84 47"24'N 0' ,1'[ Venezuela, country 78 8'OO'N 66' OOW Wilkes Land, region 15 70"00'5 12O"t(':
Siberia, region. 97 64' OO'N 98' OO'E T : Townsville, Australia 102 19'1 7'5 " 6" 8'[ venice, Italy 84 'S' 26'N 12'20'[ Williams lake, Canada .. 74 S2' 09'N 122W'
SICIly, Island 85 37'00'N 14'00'[ Trail, Canada 74 49"06'N 117"44'W Veracruz, MexICO 76 19'O?'N 96'08W Wililston L., lake .. 75 S6'OO'N 135Wl
SrcdyStr oisrra« 85 37'00 'N 12' OO'E Tebasco.state, Mex 76 18' OO'N 98' OOW Iransaotarcnc Mrs.. Veracruz, state, Mex 76 18'oo'N 96' OOW Wilmington, DE .. 51 39"4S'N 7S'm
Sidra, G of, gulf 91 32'OO'N 19' OO'E Tabora. Tanzania 90 5' 01'5 32" 9'[ mountains 15 86'00' 5 180'00 ' Verde, nver 54 3S'OO'N 112'OOW Windhoek, Namibia .. 90 22'335 17'CoI:
SierraAwl, mountams 77 23'OO'N 99'OOW Tabre. Iran 96 38'OS'N 46"lS'E Transcaucasia, regIon 85 42' OO'N '5' 00'[ Verde, nver 77 16"OO'N 98'OOW WIndsor, Canada. .. 74 ' 2' 18'N 83'Oll
SierraLeone, country 90 9'OO'N 12' OOW Tacna, Peru 78 18'0 2'5 70' ISW TransylvanianAlps, VerkhoyanskRange, Wmdward Is" Islands. .. 45 I" OO'N 61'00'1
Sierra Madre de Cbepas. Tacoma, WA 50 ,7 ' 1S'N 122'27W mountains 85 46' OO'N 23' 00'[ mountains 97 6S' OO'N 130' 00'[ WlflIsk,flver .. 75 SS'OO'N 88'001
mountains 77 16'OO'N 93' OOW TademartPlat.,plateau 91 28'OO'N 5' 00'[ Trenton, NJ. 51 40' 13'N 7"'SW Vermont, state, U.s 51 44' OO'N 73'OOW Winnipeg,Canada .. 74 49"S4'N 97'm.
Sierra Madre delSur, Tagus, Mer 85 ' O'OO'N 8'0 0'[ Trinidad, BolMa 78 14'50'5 64"S4'W Verona, Italy 84 4S"26'N 11' 00'[ Winnipeg, L., lake .. 75 S3'OO'N 98'00'1
mountains 77 P'OO'N 99'OOW Tahat, peak 91 2''OO'N 5' 00'[ Touded . Island 45 11' OON 61' OOW Vert, Cap, cape 91 " ' OO'N 18' OOW wmmpeqosrs.L" lake · 75 S3'OO'N l00Wf
SierraMadreOCCidental, Tahiti, !s/and 103 18'00 '5 " 9'OO'W Trinidadand Tobago, vrcebsk. Belarus 84 SS' 13'N 30' 13'[ winston-Salem. NC , 51 36"06'N 80'11'
mou'ltams 77 27' OO'N 107'OOW Tahoe, L, lake 54 39'OO'N 120' OOW country 44 11"OO'N 61'OOW vrctcna.Canada 74 '8'26'N 123' 22W WiSCOnSin, river . 55 4S' OO'N 9O'OO't
SierraMadreOriental. Taipei, Taiwan 96 2S'04'N 121' 33'[ Trinity, Mer 55 32' OO'N 96'OOW vrctcna. Seychelles 90 " 37'S 55'27 '[ WiSCOnSin,state, U,S . 51 44"00'N 89'001
mountams 77 25' 00'N IOO'OOW Taiwan, country 96 2" OO'N 121'00'[ Tripoli,Libya 90 32'S3 'N 13' ll 'E Vrctcna, state, Austl. 102 37'00 '5 " 5' 00'[ Wollaston L.,lake . 75 S8' OO'N 104'001
SerraMorena, mountaIns 85 38'OO'N S'OOW Taiwan, ,sland 97 2" OO'N 121' 00'[ Inpohtama.region 91 30' OO'N " 'OO'E Victoria Falls, falls 91 19'00 '5 26'00'[ Wollongong, Australra 102 3"2"5 150';('
SierraNevada, rnounta.ns 54 38'OO'N 120'OOW Tatyuan, China 96 37'SS'N 112'36' [ Trors-Rvreres.Canada 74 46"21'N 72'33 W Victoria I, Island 75 72'OO'N 109' OOW Woods, L.ofthe, lake . 55 49"OO'N 95'OC1
Sierra San Pedro Martlr, Tejikrstan. country 96 39'OO'N 71'00 '[ Irornse. Norway 84 69'3 9' N 18' 55'[ Victoria, L., lake 91 1' 00'5 33'00 '[ Worcester, MA . 51 ' 2' I6'N 71'';
mounrams 77 32'oo 'N 116'OOW Iakhmakan Desert,desert 97 39'OO'N 81' 00'[ Trondheim,Norway. 84 63' 2S'N 10'26 '[ vredma.Argentina 78 '0'51'5 62'S9W Wrangel l, lsland . 97 71' OO'N 1m
Seoferopol', Ukraine 84 34' 06'[ Talca. Chile 78 35'26 '5 71'38 W Ircjillo. Peru 78 8' 08'5 79' 01W Vienna, Austrra 84 '8'13'N 16' 23'[ Wrath, C., cape . 85 S8' OO'N 544cSS·N
SI'IalPen, penrnsula 91 29' oo'N 34'00'[ Tallahassee, FL 51 30'26 'N 8, ' I7W Truro, Canada 7' 'S ' 21'N 63' I6W Vientiane, Laos 96 P'S8'N 102' 38'[ Wroclaw, Poland . 84 SI'06 'N 17
Smaioa,state, Mex 76 2, ' OON 107'OOW Tarhnn, EstOnia 84 S9'2" N 2" 44'[ Tstukapa, Vietnam, country. 96 14'OO'N 109'00 '[ Wuhan, Chma , 96 30'32 'N 114'm
Smcelejo. Colombia 78 9'18 'N 7S'2'W Tamale, Ghana 90 9' 2"N O'SOW Oem. Rep ofCongo 90 6' 23'5 20'52 '[ VlgO,Spam 84 '2' 13'N S"44'W Wyndham, Australia 102 15'29 '5 128
Singapore, country 96 l 'OO'N 10" 00'[ Tamaorssset. Algena 90 22" 6'N 5'32 '[ TsnnlyanskRes., lake 85 ' 8'OO'N ' 3' 00'[ VillaAhumada, MeXICO 76 30'3 7'N 106'30W Wyoming, state, U.S 50 43"oo'N 77'W1
Singapore, Singapore 96 l'I8'N 103°S1'E Tarneuhpas, state, Mex 76 2"O O'N 99'OOW Tsumeb. Namibia 90 19' 15'5 17"41'[ viltahermosa. MeXICO 76 17' S9'N 92'S SW
SiouxCity, JA 51 ,2 '3 0'N 96'2' W Tambov, RUSSia 84 S2"3'N " ' 26'[ Tuamotu Arch, ,slands 103 17'00 '5 " " OOW vilmus. Lithuania 84 S4"41'N 25' 16'[
SiouxFalls,SO 50 '3'33'N 96°42'W Terruahua Lagoon, bay 77 22'OO'N 97'00W Tucson, AZ 50 32'I3'N 110' S6W Vinson MaSSif, mountains 15 78'00 '5 88'OOW
Siple I, IsJand 15 74'00'5 13S' OOW Tampa, FL 51 27'S7'N 82'28W Tela. RUSSia 84 S"IS'N 37'36 '[ Virginia, state, U.s 51 38'OO'N 77'OOW
Siwah, Egypt 90 29' I l' N 25'3 1'[ Tampa Bay,bay. 55 28'OO'N 83' OOW Tulsa, OK 51 36' 09'N 96' OOW Virginia Beach, VA 51 36'S l'N 7S' S9W Xar-Xer,Mozambique 90 25' 03'5 33'l~
Skaqerrak,strait 85 S8'OO'N 9'00 '[ Tampere, Finland 84 61'29 'N 23" 7'[ Iurnbes. Peru 78 3'35 '5 8O' 26W Virgin ts., Xalapa, MeXICO 76 19' 32'N 96'54'
Skeens. rIVer 75 SS'OO'N 129' OOW Tampico.MeXICO . 76 22' 12'N 97' SI'W TunIS, TUniSia. 90 36"9'N 10' 11'[ dependency, U.S./U.K. 44 18'oo'N 6S' OOW Xl, nver 97 2" OO'N IlOW!
SkeletonCoast, region 91 22'00 '5 12' 00'[ Tana. L.,lake 91 12'OO'N 38'00 '[ Iurusre, country 90 37' OO'N 10'00' [ Viscount MelVilleSound, Xi'en, China 96 3"1 7'N l oa'~:
Skopje, FYR Maceoone 84 '2'OO'N 21'25' [ Ianqa. Tanzania . 90 5'04' 5 39'0 6'[ TUrin, Italy 84 'S ' OS'N 7" ,'[ straIt 75 7S' OO'N 108'OOW Xmqu, river 79 7'00'5 52'00
Skovorcdmo, RUSSia 96 5"02'N 123'59'[ raoqanyika, L., /ake 91 8' 00'5 30'00 '[ Turkana, L.. lake 91 4°00'N 38'00'[ V,stula, nver 85 S3'OO'N 19'00'[
Slave, rwer 75 61' OO'N 112'OOW Tangier,Morocco 90 3S',7'N S" 8W Turkey, country 96 38' OO'N 36' 00'[ Viti Levu, lsland 103 18'0 0'5 178'00 '[
Slave Coast.region 91 6' OO'N 2'00'[ Tanzania, country 90 5' 00'5 32' 00'[ Turkey, country 8' 41°OQ'N 28'00' [ Vlt6rra, BraZil 78 20'18 '5 400
19'W
Slovakia, country 84 48' OO'N 19'00'[ Iapechula. MeXICO. 76 14°S4'N 92' ISW Tcrkrneus tan, country 96 39' OO'N 55'00 '[ vttcna da Conqursta. BraZil 78 14'51 '5 ' O' SOW
Slovenia, country 84 ,7 ' OO'N 15'00'[ Iapajcs , fiver. 79 5' 00'5 S7'oo W Turksand CeicosIs" Vizcaino Desert,desert 77 27'00 'N I I"OOW YablonovyyRange,
SmallwoodRes.,lake 75 55'00' 6''OOW Taranto, Italy 84 ' O'28 N 17'15 '[ dependency, (U.K.) 44 21°44N 71"3S'W Vladivostok,RUSSIa 96 43"08'N 131' 55'[ mountains 97 S3"OO'N I1S'OO!
Smoky Hill, fiver 55 39' OO'N 99'OOW Taranto, G of, gulf 85 39' OO'N 19'00 '[ Tcrku,Finland 8' 6O'28'N 22' 16'[ volcan MiStl,peak 79 16' 00'5 72' OOW 'rakutsk. RUSSia 96 62' O"N 129·,j.:
Smolensk RUSSia 8' 32'03'[ Tarawa, Island 103 l"OO'N 173'00 '[ Tuvalu, country 102 8' 00'5 P8'OO'[ Volga, fIVer 85 S7'00 'N 35' 00'[ 'ramoussoukro.
S4c48·N
Snake. rrver 54 44coo'N 116"OO'W Tarawa (Bamkll,KlrrbatJ 102 l'I 9' N 172' 58'[ Tuvalu, Islands. 103 8'00 '5 178' 00'[ Volga Delta,delta 85 '6'OO'N '8'00'[ Cored'JvOlrc , 90 6" S'N 5'1:
SnakeRiverPlain, plain 54 '3' OO'N II S'OOW Tanja. BoliVia 78 21'33'5 64°43'W Tcxpan.MexICO 76 20' S7'N 97'26W Volga-Don Canal,canal 85 ' 8' OO'N '5'00 '[ Yangon (Rangoon),
Societyls., Islands 103 18'00'5 IS2'OOW Tenm Basm, baSin 97 'O'OO'N 83'00 '[ Tcxtepec. MexICO 76 18'06'N 96'07W Volga Upland, highlands 85 S2'OO'N '5'00'[ Myanmar 96 16"49'N 96'(1'
Socotra. Island , 97 12' 30'N 54' 00'[ Iartu. Estonia 84 S8' 22'N 26"2'[ Tuxtla Gutierrez,MeXICO 76 16" S'N 93'OSW Volgograd, RUSSia 84 48°45'N 44'30'[ Yaounde, Cameroon , 90 3'S2'N 1"31=
Sofia, Bu/garra , 84 42"43'N 23'2 0'[ Tashkent, Uzbekistan 96 41"14'N 69' 16'[ Tver', RUSSia 84 56"54'N 35'53 '[ Volgograd Res., lake 85 S2'OO'N 46'00'[ 'raqur. river , 77 28'OO'N 110'00'1
Sokoto, N!gerla , 90 13'02'N 5' 1" [ Tasmania,Island 103 ' 2' 00'5 " 7'00'[ Tyrrhenian Sea, sea 85 41"00'N 12'00 '[ Volta, L., lake 91 8'OO'N 0' 00' Yaren, Nauru 102 0' 31'5 166'5.::
Solomon Islands, country 102 7'00' 5 160'00 '[ Tasmania, state, Austl 102 ' 2' 00'5 " 7' 00'[ Volta Redonda, BraZil 78 22'285 44"04'W Yarmouth,Canada , 74 '3"8 N 66~7'
Solomon Islands. Islands 103 9'00 '5 165'00 '[ Tasman Sea, sea 103 38' 00'5 159' 00'[
Voronezh, RUSSia 84 SI'36 'N 39'2"[ 'rarostavl'. RUSSia , 84 S7'36 'N 39'5):
Solomon Sea, sea 103 8' 00'5 153'00'[ Tatnam, C , cape 75 S6'OO'N 89' OOW Vychegda, river 85 62' OO'N ' 7'00'[ Yazoo, fIver , 55 33' OO'N 90'00'1
Somalia, country , 90 , ' OO'N '5'00 '[ Taupo, L., lake. 103 39'00 '5 176' 00'[ 'rekatennburq, RUSSia , 96 S6'Sl'N 60'. ;
Somali Pen, penmsula . 91 10'00 'N ' 9'00 '[ Taxco, MeXICO 76 18'32'N 99'36W Ubangl, nver 91 4"oo'N 18'00'[ Yellowknife, Canada 74 62"29'N 1l4'm
Somerset L ts'anc . 75 7"OO' N 9S' OOW Taymyr Pen.,peninsula 97 74"OO'N 96'00'[ Uberlandla, BraZIl 78 18' 55'5 ,8' 13W YellowSea, sea , 97 3" OO'N 123'001
Songea,Tanzania , 90 10"41'5 35'39 '[ TbdlSI, Georgia 84 41"41'N 44"47'E Uceyab,fiver 79 6'00 '5 7S' OOW Yellowstone, river , 54 46"OO'N 108'lXJ"iI'
Sonora, fiver , 77 30' 00 N III ' OOW TegUCigalpa, Honduras 44 14"06'N 87' 12W Uganda, country 90 2' OO'N 31'00'[ Wabash, river 55 39' OO'N 88' OOW Yellowstone L., lake , 54 44'OO'N 110'00'
Sonora, state, Mex , 76 29'OO'N II I'OOW Tehran, Iran 96 3S"41'N 51'2 6'[ Dkhta. Russ!a 84 63'36 'N 53'5 1'[ Waco, TX 50 31'33 'N 97' 09W Vemen, country , 96 IS'oo 'N 49"00:
Sonoran Desert, desert , 54 3"OO'N II " OOW Iebvacan. MeXICO 76 18'28N 97'2'W Ukrame, country 84 '9'00'N 29'00'[ WaddIngton, Mr., peak 75 S2'OON 126' OOW 'remsey fiver , 97 67'OO'N 88''1),1':
SouthAfrica, country , 90 30'00'5 21'00 '[ Iehoantepec, G. of.gulf 77 IS'OON 9S' OOW Ulaanbaatar,Mongolia 96 47"S6'N 106'5 3'[ WakeI., dependency, U.S 102 19' OO'N 167'00'[ Yerevan, Armenia , 84 40"04'N 44'21:
SoutnAmerica, continent l' 10' 00'5 SO'OOW Iehuantepec, Isth of, Ulan-Uda, RUSSia 96 51"49'N 107'36 '[ Wake I., Island 103 19' OO'N 167'00'[ Yokohama,Japan 96 3S'27'N 139'3l'!
Southampton I, Island 75 6S' OO'N 8S' OOW Isthmus 77 17"OON 9S' OOW UI'yanovsk, RUSSia 84 54"18'N '8' 17'[ Wales, dIVISion, U,K 84 S2' OO'N S'OOW York, C" cape 103 11'00'5 142'0;1
SouthAostraba. tecpeo. Pt., cape 77 18'OO'N 104'OOW Umea, Sweden 84 63'SO'N 20' 15'[ wallachre. region, 85 'S ' OO'N 2" 00'[ Yorkton, Canada , 74 SI'1 2'N 102'2n
state, Austl 102 32'00'5 135'00' [ Teles Pues, Mer 79 10'00' 5 S6'OOW Umtata, S Afrrca 90 31'33'5 28"2'[ Wallisand Futuna, Yucatan, state, Mex , 76 21'OO'N 89'00'/
South Bend, IN 51 41°41'N 86'I SW Temuco, Ch!le 78 38'44 '5 72'36W Ungava Bay, bay 75 S9' OO'N 69'OOW dependency, Fr 102 13'00'5 176' 00W YucatanChannel, strait 77 22' OO'N 86'1:0'
SouthCarolina, state, U.S 51 3" oo'N 81' OOW Tenere, region 91 19' OO'N 12' 00'[ Ungava Pen" penmsula 75 61'OO'N 7"OOW Wallis and Futuna, ,slands 103 13'0 0'5 176'00W Yucatan Pen., peninsula . 77 20' OO'N 89'00'/
Soutn Chrna Sea, sea 97 "'OO'N 115'00'[ Tennessee, nver 55 3S' oo'N 86' OOW United ArabEmirates, WalVISBay,Namibia 90 22'57' 5 14°32'E Yukon, river 45 6S'OO'N 150'00'1
South Dakota, state, US 50 'S 'OO'N 10l'OOW Tennessee, state, US 51 36"OJ'N 87' OOW country 96 2" OO'N 53'00 '[ Warrego, fiver 103 27'00'5 " S' oo'E YukonTerr.,temtory,Can . 74 6S'OO'N 138'001
South Eastc' cape 103 44'00'5 " 7'00'[ Teplc,MeXICO 76 21'28 'N 104'S2W United Kingdom, country 84 S"OO'N 0'00 ' Warsaw, Poland 84 S2' IS'N 20'S9 E Yuma,AZ , 50 32' 44'N 11" 37
SouthernAlps, mountains 103 44"00'5 171'00'[ Tereslna,Brazil 78 5'03'5 42"47'W United States, country 44 39'OO'N 98"00'W Wasatch Range, fTlountams 54 ' 0' 00'N I II ' OOW Yumen, China , 96 39' S2'N 97'3r:
SouthernIndian L.,/ ake, 75 S7' oo'N 98'OOW Termlnos Lagoon, bay. 77 19' OO'N 92'OOW Upper Pen" peninsula 55 46°00'N 87'00W Washlflgton, DC 51 38"S4'N 77'02W
SouthGeorgia, Island 79 5" 00'5 37'OOW Tete, Mozambique 90 16' 11'5 33'35 '[ Uppsala, Sweden 84 S9'S2'N 17' 39'E Washlflgton, state,U .S , 50 ' 6"OO'N 121'OOW
South L, ls/and 103 44'00'5 171' 00'[ Texas,state, U.S. 50 3I'OO'N 99' OOW Ural, river 85 S, ' OO'N S9'OO'E Washington, Mt., peak 55 44"OO'N 71' OOW
South Korea. country 96 3S'OO'N 128' 00'[ Thabana Ntlenyana, peak 91 29' 00'5 29' 00'[ Ural Mts., mountams 85 S7'OO'N 59'00 '[ Watson Lake, Canada 74 6O'09N 128"6W
SouthOrkneyIs.,Islands 15 61'00 '5 'S'OOW Thailand, country . 96 16' OO'N 102'00'[ Uruapan, MeXICO 76 19' 2S'N 102'O'W Wau,Sudan. 90 7"42'N 28' 00'[ Zacatecas, MeXICO , 76 22"6'N 102'35
South Platte, river 5' 'O'OO'N 10" OOW Thailand, G.of, gulf 97 8' OO'N 103'00'[ Uruguay, country 78 33'00'5 SS' OOW Wawa, Canada 74 '7'S9N 84°45'W Zacatecas, state, Mex . 76 2" OO'N 103'00'1
4so49'NSouthPole,pole 15 90' 00'5 0'00 ' Thar Desert,desert 97 2S' OO'N 71'00 '[ Uruguay,fIVer 79 29' 00'5 SS' OOW WeblJubba, nver 91 S' OO'N '2' 00'[ Zagreb, Croatia , 84 15'5i:
SouthSaskatchewan, river 75 SI' OO'N II O'OOW Thelon, fiver 75 64' OO'N 10"OOW Urumql,Chma 96 43"4TN 87'37 '[ WeddellSea, sea 15 73' 00'5 'S 'OOW Zagros Mts., mountains . 97 30' OO'N 53'0:'
South Shetland Is., Islands 15 62'00 '5 60' OOW The Pas, Canada 7' S3"7'N 10l' I6W Ushuaia, Argentina 78 5, " 7'5 68' ISW Wellesley Is., ,slands 103 16'00'5 "0'00'[ Zambezl, river . 91 15"00'5 32'OC;
Spain,country 84 " 'OO'N S'OO'[ Thessalonlkl, Greece 8' , O' 39'N 22'5 7'[ Ustyurt Plat,plateau 97 ' 3' OO'N 55' 00'[ Welhngton, NewZealand 102 41"16'5 174"47'E Zambia, country · 90 15"00'5 25'0::
SpencerG, gulf 103 35'00 '5 137'00'[ Thlrnphu,Bhutan 96 27'2 7'N 89'39 '[ Usumaclnta, rIVer 77 18' OO'N 92' OOW Weser, nver, 85 S2' OO'N 11'00'[ ZanZibar, Tanzama , 90 6'10 '5 39'1r.
Split, Croatia 8' ' 3' 31 N 16' 27'[ Thohoyandou, S.Africa 90 22"57'5 30'28 '[ Utah, state, U.S 50 39"oo'N 112"OO'W West Cape Howe, cape. 103 35"00'5 118'00 '[ ZanZibar I, Island , 91 6'00'5 39'00!
Spokane, WA 50 ' 7" O'N I P ' 2SW Thompson, Canada 74 55"44'N 97"51'W Uzbekistan, country 96 42"OO'N 69'00'[ West Dvina, nver 85 S7"OO'N 25' 00'[ Zaporlzhzhla, Ukrame , 84 4r 44'N 35'15,
Sprlngbok, S Africa 90 29"0'5 17'5"[ ThunderBay, Canada 7' 48"26'N 89' I''W WesternAustraha, Zapolltlan, Pt., cape , 77 WOO'N 95'00'
Sprrngfleld,JL 51 39"8'N 89'3 9W Thurston Lis/and 15 72' 00'5 lOO'OOW state, Austl. 102 24"00'S 119' 00'[ Zaragoza, Spain , 84 41°39'N O'53~
Springfield,MO 51 37'13'N 93'I 8W TlanJln,China 96 39' 07'N 117' 10'[ WesternGhats, mountams 97 13' OO'N 75'00 '[ Zaria, Nlgena . 90 11' 06'N 7"44:
Sri Lanka, country 96 7'OO'N 81' 00'[ Tlan Shan, mountains 97 '2' oo'N 80'00'[ Western Plat., plateau 103 25' 00'5 125'00'[ Zed,Mt., peak 103 23'0 0'5 13m,
SnLanka, Island 97 7'OO'N 81' 00'[ Tibestl Mts., mountains 91 21'oo'N 19'00' [ Vaal, nver 91 25' 00'5 27'00'[ Wes!ernSahara, Zhengzhou, China . 96 34"47'N 113'40t
Snnagar,India 96 34"11'N 7"'8'[ Tibet, Plat.of, plateau. 97 3" OO'N 90' 00'[ Vaasa, Finland 84 63"06'N 21'39' [ disputedterritory,Mor. 90 2S'OO'N IS'OOW Zimbabwe, cOuntry , 90 19' 00'5 29'OOl
StanJey, FalHand Is 78 51'43'5 S7'Sl' W TiburonI., ,sland 77 29'OO'N 113'OO'W Valdal Hills, hJghlands 85 S7' OO'N 32'00' [ West Ice Shelf, Ice shelf. 15 66'0 0'5 83' 00'[ Zinder,Niger . 90 13"8'N 9'001
StanovoyRange, Tierradel Fuego, Island. 79 54'00'5 68' OOW Valdes Pen , peninsula. 79 ' 3'00 '5 64'OOW West Indies, Islands 14 19' OO'N 70'OOW Zurich, Switzerland 84 ' 7'23'N g032t
mounta,ns . 97 S6'OO'N 130'00'[ Tlgns, nver 97 37'OO'N 44'00'[ ValdiVia, Chile 78 39" 7'5 73'13 W West Palm Beach, FL 51 26"3'N 80'0 3W
StarbuckI, Island 103 6'00'5 IS6'oo W Tijuana, MeXICO 76 32'3 1'N 117'03W Val·d'Or, Ca'lada 74 '8'0 7'N 7r47'W West Siberian Plain,
Stavanger, Norway 84 S8'S7'N 5"5'[ Timan Ridge, highlands 85 66'OO'N 50' 00'[ ValenCIa. Sparn 84 39' 29'N O'21W plateau 97 61'OO'N 79'00 '[
Steep Pt., cape ' 03 26'00'5 113'00'[ Tlmlsoara, Romania 84 45°46'N 21"14'E
Stewart I,Island 103 ' 7'00'5 168'00 '[ TimminS, Canada 74 48°28'N 81' I9W
Stockholm, Sweden 8' S9'2 0'N 18'On Timor, ,sland 97 9'00 '5 125' 00'[
Strasbourg, France 8' 48' 3S'N 7" 6'[ Timor Sea, sea 97 13'00 '5 127'00'[
8' 8'Stuttgart, Germany 48"48'N 9°11'E Tirana, AJbania " ' 20'N 19" 9'[ Abbreviations . cE~.:,
Sucre, BoliVia 78 19"03'5 6S'1SW Tlsza, Mer 85 ' 6' OO'N 20' 00'[
Sudan, country 90 II'OO'N 29'00 '[ Tltlcaca, L., lake 79 16' 00'5 69"OOW Arch, Archipelago Den Denmark Gr, Greece N, Korea North Korea S. Africa SoumAfna
Sud::>ury, Canada 74 '6'29'N 81'OOW Tlzlmin, MeXICO 76 21'09'N 88'0 9W
Austl. Australia Dominican Dommican I. Island N,l. New Zealand S. Korea South Kore;
Sudd, swamp 91 9' OO'N 29'00'[ Tlaxcala, MeXICO 76 19°19'N 98' 1, W
Sudeten Mts" mountains 85 SI'OO'N 16'00 '[ Tlaxcala,state, Mex 76 19' OO'N 98"OO'W
Rep RepUbliC
Her. Herzegovina fed. dist. Federal District
Bas. & Bosnia & Is. Islands Pen. Peninsula Sp, Spar
SuezCanal,canal 91 31'OO'N 3" 00'[ Toamaslna, Madagascar 90 18' 10'5 '9'22'[ Ism, Isthmus Plat. Plateau St., St· San
Suez, G of, gulf 91 28'OO'N 34'00 '[ Tobruk, Libya 90 32'OS'N 23'5 7'[ C. Cape Fed . Federated It. Italy Pt. Point Ste., Ste- Sainte
Sukhona, rIVer 85 ' 2"00'[ Tocantlns, nver 79 10'00 '5 49"OO'W Can Canada States of States of60000
'N
L lake R. River Str. Strat
SulaweSI(Celebes), Island 97 2'00 '5 121'00 '[ Togo, country 90 9"OO'N 1"OO'E Micronesia Micronesia
Cen, Central Uecht. Liechtenstein Rep. RepubliC Terr. TerntorySumatra,,sland 97 0'00' 101'00'[ Tokelau Is" Fr, FranceAfrican African
Sunda Str, strait 97 6'00 '5 105'00'[ dependency, N.l 102 9'00 '5 172"00'W Mex. Mexico UK United Kingdom
Rep , Republic Ft. Fort Rt~~~~heSundsvall, Sweden 8' 62' 22'N 17'17'[ Tokelau Is.,Islands, 103 9'00'5 172'OO'W Mor of th:t~~~i~ U.S, Untted States
Supenor, L., lake 45 '7'OO'N 86"OO'W Tokyo, Japan 96 3S" O'N 139"5'[
MoroccoCzech Czech EY.R. Former
Res, Reservoir
Rep Republic Macedonia Mt. Mount Val. ValleySurabaya, IndoneSia 96 7'13'5 112"44'E Tolanaro, Madagascar 90 25'02 '5 '6'59 '[
Russia73'2 7'[ Oem, Re~~b~~I~f Mtn Mountain Russ.
Surgut. RUSSia 96 61"OS'N Toledo, OH 51 ' , " O'N 83'33W Democratic
For U,S. two-letter state
Surrname, country 78 4"OO'N 57"OO'W Tollara, Madagascar 90 23'2 1'5 ' 3' 39'[ Rep , of RepubliCof Macedonia Mts, Mountains Serb. & Serbia and
abb reViations, see pages
Net h, NetherlandsSusquehanna, rrver 55 " 'OO'N 76' OOW Toluca, MeXICO 76 19"lS'N 99'39W Congo the Congo G. Gulf Mont. Montenegro
52-53.](https://image.slidesharecdn.com/student-world-atlas-malestrom-161219130615/85/Student-world-atlas-114-320.jpg)