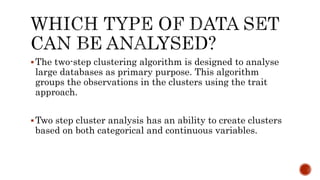
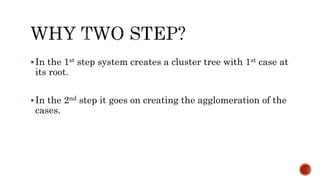
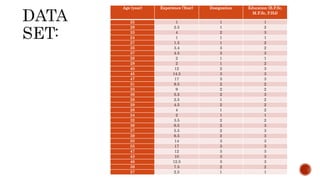
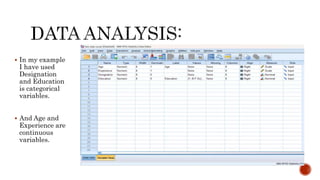
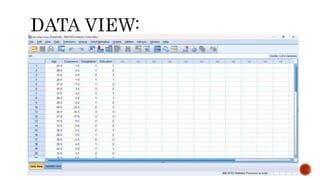
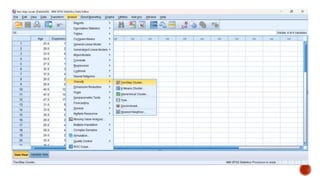
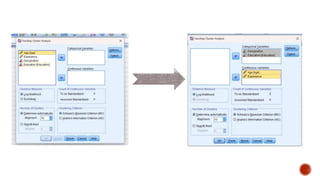
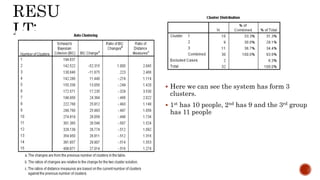
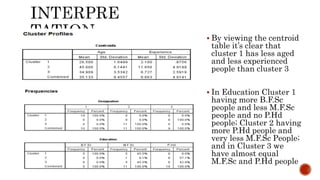
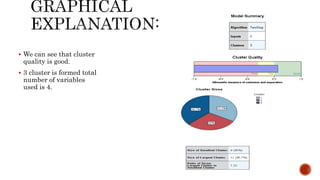
TWO STEP
CLUSTER
ANALYSIS
SUBMITTED TO:
PROF. SOMEN SAHU
DEPT. OF FES
SUBMITTED BY –
AGNIVA PRADHAN
M.F.Sc 2ND SEMESTER
DEPT. OF FNT
M/F/2021/03
The Two-Step cluster analysis is a hybrid approach which
first uses a distance measure to separate groups and then
a probabilistic approach (similar to latent class analysis)
to choose the optimal subgroup model
Two step cluster analysis uses a likelihood distance
measured which assumes that variables in a cluster model
are independent.
Handling of categorical and continuous variables. By
assuming variables to be independent, a joint
multinomial-normal distribution can be placed on
categorical and continuous variables.
Automatic selection of number of clusters. By comparing
the values of a model-choice criterion across different
clustering solutions, the procedure can automatically
determine the optimal number of clusters.
Scalability. By constructing a cluster features (CF) tree
that summarizes the records, the Two-step algorithm
allows you to analyze large data files.
Retail and consumer product companies regularly apply
clustering techniques to data that describe their
customers' buying habits, gender, age, income level, etc.
These companies tailor their marketing and product
development strategies to each consumer group to increase
sales and build brand loyalty.
The two-step clustering algorithm is designed to analyse
large databases as primary purpose. This algorithm
groups the observations in the clusters using the trait
approach.
Two step cluster analysis has an ability to create clusters
based on both categorical and continuous variables.
In the 1st step system creates a cluster tree with 1st case at
its root.
In the 2nd step it goes on creating the agglomeration of the
cases.
Age (year) Experience (Year) Designation Education (B.F.Sc,
M.F.Sc, P.Hd)
25 1 1 1
28 2.5 1 2
33 4 2 3
24 1 1 1
27 1.5 1 2
35 3.4 3 2
37 4.5 3 3
26 2 1 1
28 2 1 2
40 12 2 3
45 14.5 3 3
47 17 3 3
31 9.5 2 2
33 9 2 2
36 5.5 2 3
28 2.5 1 2
29 4.5 2 2
28 4 1 2
24 2 1 1
32 3.5 2 2
36 6.5 2 3
37 5.5 2 3
39 6.5 2 3
50 14 3 3
55 17 3 3
47 12 3 3
43 10 3 3
46 12.5 3 3
38 7.5 2 2
27 2.5 1 1
 In my example
I have used
Designation
and Education
is categorical
variables.
 And Age and
Experience are
continuous
variables.
 Here we can see the system has form 3
clusters.
 1st has 10 people, 2nd has 9 and the 3rd group
has 11 people
 By viewing the centroid
table it’s clear that
cluster 1 has less aged
and less experienced
people than cluster 3
 In Education Cluster 1
having more B.F.Sc
people and less M.F.Sc
people and no P.Hd
people; Cluster 2 having
more P.Hd people and
very less M.F.Sc People;
and in Cluster 3 we
have almost equal
M.F.Sc and P.Hd people
 So, its understandable is that 1st cluster is having less age, less designation, less
qualification people,
 If we come to the 3rd cluster they are more aged more educated and more designated
people.
 We can see that cluster
quality is good.
 3 cluster is formed total
number of variables
used is 4.
TWO STEP CLUSTER ANALYSIS.pptx

TWO STEP CLUSTER ANALYSIS.pptx

  • 1.
    TWO STEP CLUSTER ANALYSIS SUBMITTED TO: PROF.SOMEN SAHU DEPT. OF FES SUBMITTED BY – AGNIVA PRADHAN M.F.Sc 2ND SEMESTER DEPT. OF FNT M/F/2021/03
  • 2.
    The Two-Step clusteranalysis is a hybrid approach which first uses a distance measure to separate groups and then a probabilistic approach (similar to latent class analysis) to choose the optimal subgroup model Two step cluster analysis uses a likelihood distance measured which assumes that variables in a cluster model are independent.
  • 3.
    Handling of categoricaland continuous variables. By assuming variables to be independent, a joint multinomial-normal distribution can be placed on categorical and continuous variables. Automatic selection of number of clusters. By comparing the values of a model-choice criterion across different clustering solutions, the procedure can automatically determine the optimal number of clusters. Scalability. By constructing a cluster features (CF) tree that summarizes the records, the Two-step algorithm allows you to analyze large data files.
  • 4.
    Retail and consumerproduct companies regularly apply clustering techniques to data that describe their customers' buying habits, gender, age, income level, etc. These companies tailor their marketing and product development strategies to each consumer group to increase sales and build brand loyalty.
  • 5.
    The two-step clusteringalgorithm is designed to analyse large databases as primary purpose. This algorithm groups the observations in the clusters using the trait approach. Two step cluster analysis has an ability to create clusters based on both categorical and continuous variables.
  • 6.
    In the 1ststep system creates a cluster tree with 1st case at its root. In the 2nd step it goes on creating the agglomeration of the cases.
  • 7.
    Age (year) Experience(Year) Designation Education (B.F.Sc, M.F.Sc, P.Hd) 25 1 1 1 28 2.5 1 2 33 4 2 3 24 1 1 1 27 1.5 1 2 35 3.4 3 2 37 4.5 3 3 26 2 1 1 28 2 1 2 40 12 2 3 45 14.5 3 3 47 17 3 3 31 9.5 2 2 33 9 2 2 36 5.5 2 3 28 2.5 1 2 29 4.5 2 2 28 4 1 2 24 2 1 1 32 3.5 2 2 36 6.5 2 3 37 5.5 2 3 39 6.5 2 3 50 14 3 3 55 17 3 3 47 12 3 3 43 10 3 3 46 12.5 3 3 38 7.5 2 2 27 2.5 1 1
  • 8.
     In myexample I have used Designation and Education is categorical variables.  And Age and Experience are continuous variables.
  • 12.
     Here wecan see the system has form 3 clusters.  1st has 10 people, 2nd has 9 and the 3rd group has 11 people
  • 13.
     By viewingthe centroid table it’s clear that cluster 1 has less aged and less experienced people than cluster 3  In Education Cluster 1 having more B.F.Sc people and less M.F.Sc people and no P.Hd people; Cluster 2 having more P.Hd people and very less M.F.Sc People; and in Cluster 3 we have almost equal M.F.Sc and P.Hd people
  • 14.
     So, itsunderstandable is that 1st cluster is having less age, less designation, less qualification people,  If we come to the 3rd cluster they are more aged more educated and more designated people.
  • 15.
     We cansee that cluster quality is good.  3 cluster is formed total number of variables used is 4.