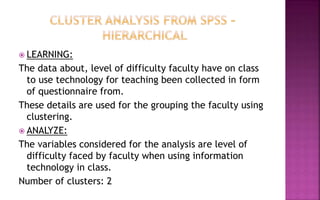
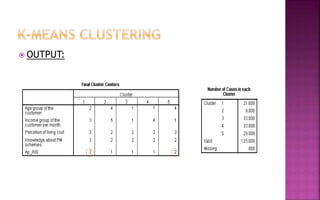
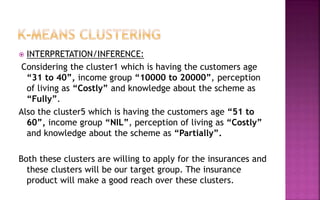
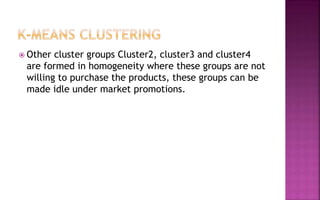
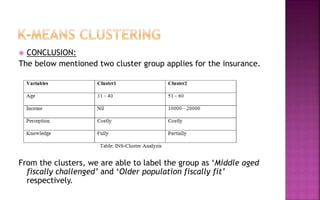
S&C: Clustering Techniques
Suryakumar T
VIT BS
 A group of customers are formed based on their
identical characteristics.
 This group is formed using the cluster analysis
technique, which is further used for the decision
making.
 Segmentation and classification is made from SPSS
17.0.
 Unsupervised techniques for clustering cases (or
variables) into small number of groups, each having
similar characteristics based on variables (or cases).
 Supervised techniques for classifying cases into a group
of defined categories of a response variable of interest
using a set of independent variables (inputs). Various
supervised classification techniques are such as
discriminate analysis, tree modeling, neural network,
etc.,
 Cluster analysis is often called the 'non-supervised
technique'.
 It is a multivariate technique used to determine group
membership for cases or variables.
 SPSS provides hierarchical cluster analysis and k-means
cluster analysis.
 Hierarchical Cluster Analysis: This is used to cluster
variables (or cases). One can analyze raw variables or
use a variety of standardization to transform the
variables.
 K-Means Cluster Analysis: This is used to cluster cases
when you have a large number of cases. The analysis
requires one to specify the number of clusters.
 Two-Step Cluster Analysis: It is more of a tool than
single analysis. It identifies the grouping by running
pre clustering first and then by hierarchical method
 LEARNING:
The data about, level of difficulty faculty have on class
to use technology for teaching been collected in form
of questionnaire from.
These details are used for the grouping the faculty using
clustering.
 ANALYZE:
The variables considered for the analysis are level of
difficulty faced by faculty when using information
technology in class.
Number of clusters: 2
 OUTPUT:
 INTERPRETATION/INFERENCE:
From the table ‘Cluster membership’, we were able to
find out that from the variable Q31-A1 till Q31-A8 falls
into one cluster (Cluster1)
And that from the variable Q31-A9 till Q31-A12 falls into
another cluster (Cluster2)
The above ‘Dendogram’ diagram provides the visual
representation of the statistics in clustering solution.
It forms the two clusters that are homogenous in their
characters.
 CONCLUSION:
Considering the cluster1 which is having the variables from
A1 – A8, whom are the faculty lists who are adaptable to
the technology.
While the other cluster groups Cluster2 (A9 – A12) are formed
in homogeneity where these groups are not willing to get
adapted to the technology, these groups find more difficult
to use technology in class.
From the clusters, we are able to label the group as ‘Stone
Age-Non Versatile’ and ‘Tech Age- Versatile’ faculty
respectively.
 LEARNING:
The banking customer’s psychographic and demographic
data was collected in form of questionnaire from.
These details are used for the profiling of the customers,
for the purchase of banking products using clustering.
 ANALYZE:
The variables considered for the analysis are Age group,
Income group, Perception of living, Knowledge about
schemes and Application of Insurance.
Number of clusters: 5
 OUTPUT:
 INTERPRETATION/INFERENCE:
Considering the cluster1 which is having the customers age
“31 to 40”, income group “10000 to 20000”, perception
of living as “Costly” and knowledge about the scheme as
“Fully”.
Also the cluster5 which is having the customers age “51 to
60”, income group “NIL”, perception of living as “Costly”
and knowledge about the scheme as “Partially”.
Both these clusters are willing to apply for the insurances and
these clusters will be our target group. The insurance
product will make a good reach over these clusters.
 Other cluster groups Cluster2, cluster3 and cluster4
are formed in homogeneity where these groups are not
willing to purchase the products, these groups can be
made idle under market promotions.
 CONCLUSION:
The below mentioned two cluster group applies for the insurance.
From the clusters, we are able to label the group as ‘Middle aged
fiscally challenged’ and ‘Older population fiscally fit’
respectively.
Marketing analytics - clustering Types

Marketing analytics - clustering Types

  • 1.
  • 2.
     A groupof customers are formed based on their identical characteristics.  This group is formed using the cluster analysis technique, which is further used for the decision making.  Segmentation and classification is made from SPSS 17.0.
  • 3.
     Unsupervised techniquesfor clustering cases (or variables) into small number of groups, each having similar characteristics based on variables (or cases).  Supervised techniques for classifying cases into a group of defined categories of a response variable of interest using a set of independent variables (inputs). Various supervised classification techniques are such as discriminate analysis, tree modeling, neural network, etc.,
  • 4.
     Cluster analysisis often called the 'non-supervised technique'.  It is a multivariate technique used to determine group membership for cases or variables.  SPSS provides hierarchical cluster analysis and k-means cluster analysis.
  • 5.
     Hierarchical ClusterAnalysis: This is used to cluster variables (or cases). One can analyze raw variables or use a variety of standardization to transform the variables.  K-Means Cluster Analysis: This is used to cluster cases when you have a large number of cases. The analysis requires one to specify the number of clusters.  Two-Step Cluster Analysis: It is more of a tool than single analysis. It identifies the grouping by running pre clustering first and then by hierarchical method
  • 7.
     LEARNING: The dataabout, level of difficulty faculty have on class to use technology for teaching been collected in form of questionnaire from. These details are used for the grouping the faculty using clustering.  ANALYZE: The variables considered for the analysis are level of difficulty faced by faculty when using information technology in class. Number of clusters: 2
  • 8.
  • 10.
     INTERPRETATION/INFERENCE: From thetable ‘Cluster membership’, we were able to find out that from the variable Q31-A1 till Q31-A8 falls into one cluster (Cluster1) And that from the variable Q31-A9 till Q31-A12 falls into another cluster (Cluster2) The above ‘Dendogram’ diagram provides the visual representation of the statistics in clustering solution. It forms the two clusters that are homogenous in their characters.
  • 11.
     CONCLUSION: Considering thecluster1 which is having the variables from A1 – A8, whom are the faculty lists who are adaptable to the technology. While the other cluster groups Cluster2 (A9 – A12) are formed in homogeneity where these groups are not willing to get adapted to the technology, these groups find more difficult to use technology in class. From the clusters, we are able to label the group as ‘Stone Age-Non Versatile’ and ‘Tech Age- Versatile’ faculty respectively.
  • 13.
     LEARNING: The bankingcustomer’s psychographic and demographic data was collected in form of questionnaire from. These details are used for the profiling of the customers, for the purchase of banking products using clustering.  ANALYZE: The variables considered for the analysis are Age group, Income group, Perception of living, Knowledge about schemes and Application of Insurance. Number of clusters: 5
  • 14.
  • 15.
     INTERPRETATION/INFERENCE: Considering thecluster1 which is having the customers age “31 to 40”, income group “10000 to 20000”, perception of living as “Costly” and knowledge about the scheme as “Fully”. Also the cluster5 which is having the customers age “51 to 60”, income group “NIL”, perception of living as “Costly” and knowledge about the scheme as “Partially”. Both these clusters are willing to apply for the insurances and these clusters will be our target group. The insurance product will make a good reach over these clusters.
  • 16.
     Other clustergroups Cluster2, cluster3 and cluster4 are formed in homogeneity where these groups are not willing to purchase the products, these groups can be made idle under market promotions.
  • 17.
     CONCLUSION: The belowmentioned two cluster group applies for the insurance. From the clusters, we are able to label the group as ‘Middle aged fiscally challenged’ and ‘Older population fiscally fit’ respectively.