The document discusses cluster analysis, an unsupervised machine learning technique that groups observations into clusters such that observations within each cluster are similar to each other and dissimilar to observations in other clusters. It describes two main approaches to cluster analysis - hierarchical clustering and k-means clustering. Hierarchical clustering groups observations together successively into tree-structured clusters while k-means clustering partitions observations into k mutually exclusive clusters where each observation belongs to the cluster with the nearest mean. The document provides examples of each approach applied to consumer data to group consumers based on income and education characteristics.
This document discusses hierarchical clustering, an unsupervised machine learning technique that produces nested clusters organized as a hierarchical tree. There are two main types of hierarchical clustering: agglomerative, which starts with each point as an individual cluster and merges them; and divisive, which starts with everything in one cluster and splits them. Different linkage methods like single, complete, average, and Ward's linkage define how the distance between clusters is calculated during the merging or splitting process. Hierarchical clustering has strengths like not requiring pre-specifying the number of clusters but has weaknesses like high computational complexity of O(n3) time for most algorithms.
SPSS Step-by-Step Tutorial and Statistical Guides by StatsworkStats Statswork
This document provides an overview of cluster analysis techniques used in marketing research. It defines cluster analysis as classifying cases into homogeneous groups based on a set of variables. Cluster analysis can be used for market segmentation, understanding buyer behaviors, and identifying new product opportunities in marketing research. The document outlines the steps to conduct cluster analysis, including selecting a distance measure and clustering algorithm, determining the number of clusters, and validating the analysis. It provides examples of hierarchical and non-hierarchical clustering methods like k-means and discusses choosing between these approaches. SPSS is used to demonstrate a cluster analysis example analyzing supermarket customer data.
tIt appears that you've provided a set of instructions or input format for a machine learning task, particularly clustering using K-Means. Let's break down what each component means:
(number of clusters):
This is a placeholder for an actual numerical value that represents the desired number of clusters into which you want to divide your training data. In K-Means clustering, you need to specify in advance how many clusters (K) you want the algorithm to find in your data.
Training set:
The "training set" is your dataset, which contains the data points that you want to cluster. Each data point represents an observation or sample in your dataset.
(drop convention):
It's not clear from this input what "(drop convention)" refers to. It could be related to a specific data preprocessing or handling instruction, but without additional context or information, it's challenging to provide a precise explanation for this part.
In summary, you are expected to provide the number of clusters (K) that you want to discover in your training data, and the training data itself contains the observations or samples that will be used for clustering. The "(drop convention)" part may require further clarification or context to provide a meaningful explanation.Clustering is a fundamental concept in the field of machine learning and data analysis that involves grouping similar data points together based on certain criteria or patterns. It is a technique used to discover inherent structures, relationships, or similarities within a dataset when there are no predefined labels or categories. Clustering is widely employed in various domains, including marketing, biology, image analysis, recommendation systems, and more. In this comprehensive explanation of clustering, we will explore its principles, methods, applications, and key considerations.
Table of Contents
Introduction to Clustering
Key Concepts and Terminology
Types of Clustering
3.1. Partitioning Clustering
3.2. Hierarchical Clustering
3.3. Density-Based Clustering
3.4. Model-Based Clustering
Distance Metrics and Similarity Measures
Common Clustering Algorithms
5.1. K-Means Clustering
5.2. Hierarchical Agglomerative Clustering
5.3. DBSCAN (Density-Based Spatial Clustering of Applications with Noise)
5.4. Gaussian Mixture Models (GMM)
Evaluation of Clusters
Applications of Clustering
7.1. Customer Segmentation
7.2. Image Segmentation
7.3. Anomaly Detection
7.4. Document Clustering
7.5. Recommender Systems
7.6. Genomic Clustering
Challenges and Considerations
8.1. Determining the Number of Clusters (K)
8.2. Handling High-Dimensional Data
8.3. Initial Centroid Selection
8.4. Scaling and Normalization
8.5. Interpretation of Results
Best Practices in Clustering
Future Trends and Advances
Conclusion
1. Introduction to Clustering
Clustering, in the context of data analysis and machine learning, refers to the process of grouping a set of data points into subsets,
This document provides an overview of cluster analysis techniques. It defines cluster analysis as classifying cases into homogeneous groups based on a set of variables. The document then discusses how cluster analysis can be used in marketing research for market segmentation, understanding consumer behaviors, and identifying new product opportunities. It outlines the typical steps to conduct a cluster analysis, including selecting a distance measure and clustering algorithm, determining the number of clusters, and validating the analysis. Specific clustering methods like hierarchical, k-means, and deciding the number of clusters using the elbow rule are explained. The document concludes with an example of conducting a cluster analysis in SPSS.
The document discusses cluster analysis, an unsupervised machine learning technique used to group similar cases together. It describes how cluster analysis is used in marketing research for market segmentation, understanding customer behaviors, and identifying new product opportunities. The key steps in cluster analysis involve selecting a distance measure, clustering algorithm, determining the optimal number of clusters, and validating the results.
Get involved with the steps of Kmeans and Hierarchical clustering and also understand how scaling affects the clustering with Agglomerative and Divise modes.
Do let me know if anything is required. Ping me at google #bobrupakroy
Clustering is the process for dividing/separating the population or data points into several groups & each group has similar data points. Clustering is an unsupervised approach.
Data mining and machine learning techniques like classification and clustering are increasingly being used to extract useful information from large datasets. Data mining helps provide better customer service and aids scientists in hypothesis formation by analyzing patterns in data from various sources like business transactions, sensor networks, and scientific experiments. Classification algorithms such as decision trees can be applied to datasets containing attributes for individuals and a target variable to predict, like credit worthiness, to build a predictive model. Clustering algorithms like K-means group unlabeled data into clusters without a predefined target variable to discover hidden patterns in the data.
This document provides an overview of unsupervised machine learning and k-means clustering. It begins with an introduction to clustering and then discusses key aspects of k-means clustering such as how it works, choosing the optimal number of clusters, and issues with random initialization. It also covers hierarchical clustering methods including agglomerative and divisive approaches. Overall, the document serves as a tutorial on unsupervised learning techniques for grouping unlabeled data.
This document discusses machine learning algorithms like k-means clustering and principal component analysis (PCA) and applies them to a wine dataset. It provides an overview of k-means clustering, describing how it works by iteratively assigning data points to centroids and updating the centroids. The document then demonstrates k-means clustering on the wine dataset in q/kdb+ to partition the data into three clusters. It also uses PCA to reduce the dimensionality of the wine data and visualize the clusters.
Mean shift clustering finds clusters by locating peaks in the probability density function of the data. It iteratively moves data points to the mean of nearby points until convergence. Hierarchical clustering builds clusters gradually by either merging or splitting clusters at each step. There are two types: divisive which splits clusters, and agglomerative which merges clusters. Agglomerative clustering starts with each point as a cluster and iteratively merges the closest pair of clusters until all are merged based on a chosen linkage method like complete or average linkage. The choice of distance metric and linkage method impacts the resulting clusters.
Clustering is an unsupervised learning technique used to group unlabeled data points into clusters based on similarity. It is widely used in data mining applications. The k-means algorithm is one of the simplest clustering algorithms that partitions data into k predefined clusters, where each data point belongs to the cluster with the nearest mean. It works by assigning data points to their closest cluster centroid and recalculating the centroids until clusters stabilize. The k-medoids algorithm is similar but uses actual data points as centroids instead of means, making it more robust to outliers.
This document discusses different types of clustering methods used to group unlabeled data points. It describes hierarchical clustering, which builds clusters recursively by merging the two closest clusters. Hierarchical clustering results can be shown in a dendrogram that depicts the merge distances. The document also lists applications of clustering such as pattern recognition, market research, and bioinformatics.
The document provides a summary of various machine learning algorithms and their key features:
- K-nearest neighbors is interpretable, handles small data well but not noise, with no automatic feature learning. Prediction and training are fast.
- Linear regression is interpretable, handles small data and irrelevant features well, with fast prediction and training but requires feature scaling.
- Decision trees are somewhat interpretable with average accuracy, handling small data and irrelevant features depending on algorithm. Prediction and training speed varies by algorithm.
- Random forests have less interpretability than decision trees but higher accuracy, handling small data and noise better depending on settings. Prediction and training speed varies.
- Neural networks generally have the lowest interpretability but can automatically
This document contains legal notices and disclaimers for an Intel presentation. It states that the presentation is for informational purposes only and that Intel makes no warranties. It also notes that performance depends on system configuration and that sample source code is released under an Intel license agreement. Finally, it provides basic copyright information.
This document discusses unsupervised machine learning techniques for clustering unlabeled data. It covers k-means clustering, which partitions data into k groups based on minimizing distance between points and cluster centroids. It also discusses agglomerative hierarchical clustering, which successively merges clusters based on their distance. As an example, it shows hierarchical clustering of texture images from five classes to group similar textures.
The KMeans Clustering algorithm is a process by which objects are classified into number of groups so that they are as much dissimilar as possible from one group to another, and as much similar as possible within each group. This algorithm is very useful in identifying patterns within groups and understanding the common characteristics to support decisions regarding pricing, product features, risk within certain groups, etc.
The method of identifying similar groups of data in a data set is called clustering. Entities in each group are comparatively more similar to entities of that group than those of the other groups.
Fuzzy c means clustering protocol for wireless sensor networksmourya chandra
This document discusses clustering techniques for wireless sensor networks. It describes hierarchical routing protocols that involve clustering sensor nodes into cluster heads and non-cluster heads. It then explains fuzzy c-means clustering, which allows data points to belong to multiple clusters to different degrees, unlike hard clustering methods. Finally, it proposes using fuzzy c-means clustering as an energy-efficient routing protocol for wireless sensor networks due to its ability to handle uncertain or incomplete data.
The document discusses hierarchical clustering methods. It explains that hierarchical clustering builds nested clusters by merging or splitting them based on their distance. Agglomerative hierarchical clustering (AGNES) iteratively merges the closest clusters, while divisive hierarchical clustering (DIANA) iteratively splits clusters. Dendograms are used to visualize how clusters are merged or split at different levels of the hierarchy. The document also discusses different methods for calculating the distance between clusters, such as single, complete, and average linkage.
This document discusses decision trees and entropy. It begins by providing examples of binary and numeric decision trees used for classification. It then describes characteristics of decision trees such as nodes, edges, and paths. Decision trees are used for classification by organizing attributes, values, and outcomes. The document explains how to build decision trees using a top-down approach and discusses splitting nodes based on attribute type. It introduces the concept of entropy from information theory and how it can measure the uncertainty in data for classification. Entropy is the minimum number of questions needed to identify an unknown value.
Hierarchical clustering builds clusters hierarchically, by either merging or splitting clusters at each step. Agglomerative hierarchical clustering starts with each point as a separate cluster and successively merges the closest clusters based on a defined proximity measure between clusters. This results in a dendrogram showing the nested clustering structure. The basic algorithm computes a proximity matrix, then repeatedly merges the closest pair of clusters and updates the matrix until all points are in one cluster.
Leadership Ambassador club Adventist modulekakomaeric00
Aims to equip people who aspire to become leaders with good qualities,and with Christian values and morals as per Biblical teachings.The you who aspire to be leaders should first read and understand what the ambassador module for leadership says about leadership and marry that to what the bible says.Christians sh
Job Finding Apps Everything You Need to Know in 2024SnapJob
SnapJob is revolutionizing the way people connect with work opportunities and find talented professionals for their projects. Find your dream job with ease using the best job finding apps. Discover top-rated apps that connect you with employers, provide personalized job recommendations, and streamline the application process. Explore features, ratings, and reviews to find the app that suits your needs and helps you land your next opportunity.
Resumes, Cover Letters, and Applying OnlineBruce Bennett
This webinar showcases resume styles and the elements that go into building your resume. Every job application requires unique skills, and this session will show you how to improve your resume to match the jobs to which you are applying. Additionally, we will discuss cover letters and learn about ideas to include. Every job application requires unique skills so learn ways to give you the best chance of success when applying for a new position. Learn how to take advantage of all the features when uploading a job application to a company’s applicant tracking system.
A Guide to a Winning Interview June 2024Bruce Bennett
This webinar is an in-depth review of the interview process. Preparation is a key element to acing an interview. Learn the best approaches from the initial phone screen to the face-to-face meeting with the hiring manager. You will hear great answers to several standard questions, including the dreaded “Tell Me About Yourself”.
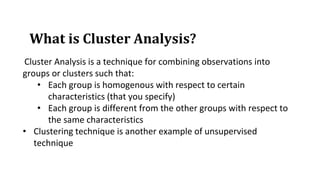
1. What is Cluster Analysis?
Cluster Analysis is a technique for combining observations into
groups or clusters such that:
• Each group is homogenous with respect to certain
characteristics (that you specify)
• Each group is different from the other groups with respect to
the same characteristics
• Clustering technique is another example of unsupervised
technique
2. Cluster Analysis
In general, it is hard to observe response(Y) variable.
Applications:
Segmentation - Group of similar customers
Finance - Clustering of individual stocks
Location Analysis-Deciding the location of warehouses
4. Example: Beer Data
Suppose I am interested in what influences a consumer’s choice behavior
when she is shopping for beer.
How important she considers each of these qualities when deciding whether
or not to buy the six pack:
low COST of the six pack,
high SIZE of the bottle (volume),
high percentage of ALCOHOL in the beer, the REPUTATION of the brand,
the COLOR of the beer,
nice AROMA of the beer,
and good TASTE of the beer.
Can I find similar group of people based on their answers? If I can, how can I use this
information?
We can use classification technique (discriminant analysis) in order to validate clusters
8. Hierarchical vs. Non-Hierarchical Clustering
• Hierarchical clustering does not require a priori knowledge
of the number of clusters
-Agglomerativehierarchical clustering is one of the most
popular hierarchical clustering method.
• Number of clusters are known.
• -K-means is one of the most popular non-hierarchical
clustering method.
18. Hierarchical Clustering
Say, we group 0 and 1 together and leave the others as is
How do we compute the distance between a group that
has two (or more) members and the others?
20. Hierarchical Clustering
Single Linkage Clustering criterion based on the shortest distance
Complete Linkage: Clustering criterion based on the longest distance
21. Hierarchical Clustering (Contd.)
Average Linkage: Clustering criterion based on the average distance
Ward's Method: Based on the loss of information resulting from grouping of the
objects into clusters (minimize within cluster variation)
22. Hierarchical Clustering (Contd.)
Centroid Method
Based on the distance between the group centroids (the point whose coordinates are
the means of all the observations in the cluster)
23. Example 3: Data
Consumer Income ($ 1000s) Education (years)
1 5 5
2 6 6
3 15 14
4 16 15
5 25 19
6 30 20
25. Similarity Measures
Why are consumers 1 and 2 similar?
Distance(1,2) = (5-6)2 + (5-6)2
More generally, if there are p variables:
Distance(i,j) = (xik - xjk)2
35. Single Linkage
First Cluster is formed in the same fashion
Distance between Cluster 1 comprising of customers 1 and 2 and customer 3 is the minimum
of Distance(1,3) = 181 and Distance(2,3) = 145
37. Complete Linkage
Distance between Cluster 1 comprising of customers 1 and 2 and customer 3 is the
maximum of Distance(1,3) = 181 and Distance(2,3) = 145
39. Average Linkage
Distance between Cluster 1 comprising of customers 1 and 2 and customer 3 is the average
of Distance(1,3) = 181 and Distance(2,3) = 145
41. Ward’s Method
Does not compute distance between clusters
Forms clusters by maximizing within-cluster homogeneity or minimizing error sum of
squares (ESS)
ESS for cluster with two observations (say, C1 and C2) = (5-5.5)2 + (6-5.5)2 + (5-5.5)2 + (6-5.5)2
45. K-means Algorithm
• Determines the best value for K center points or centroids
• Assigns each data point to its closest k-center.
• Compute centroid points based on clusters
• Assigns each data point to new cluster centroids.
• Repeat this process until cluster centroids does not change
or stopping criteria is met.
52. K-Means: iteration logic
Relocate centroids to
minimize point distances
Calculate distances
to all points
Reassign nearest
points
52
53. K-Means: StepN
After a while the shifting of centroids will stop. Now we assume
we found the true location of centroid, and finished clustering
N it erat ions lat er
53
54.
55. Weaknesses of K-means
• The algorithm is only applicable if the mean is
defined.
– For categorical data, k-mode - the centroid is
represented by most frequent values.
• The user needs to specify k.
• The algorithm is sensitive to outliers
– Outliers are data points that are very far away
from other data points.
– Outliers could be errors in the data recording or
some special data points with very different values.
57. Sensitivity to initial seeds
Random selection of seeds (centroids)
Iteration 1 Iteration 2
Random selection of seeds (centroids)
Iteration 1 Iteration 2
58. Dealing with outliers and initial seeds
• For outliers, remove some data points that are much further
away from the centroids than other data points
– To be safe, we may want to monitor these possible outliers over a few
iterations and then decide to remove them.
• If random initialization points is used for the initial
seeds, run the algorithm multiple times and
keeps the seed that minimizes your clustering
error metric.
• Alternatively, carefully choose initial seeds such
that the distance among them are maximum
59. Special data structures
• The k-means algorithm is not suitable for discovering
clusters that are not hyper-ellipsoids (or hyper-spheres).
60. K-means Summary
• Despite weaknesses, k-means is still the most
popular algorithm due to its simplicity and
efficiency
• No clear evidence that any other clustering
algorithm performs better in general
• Comparing different clustering algorithms is a
difficult task. No one knows the correct
clusters!
61. Example 3 Again: Data
Consumer Income ($ 1000s) Education (years)
1 5 5
2 6 6
3 15 14
4 16 15
5 25 19
6 30 20