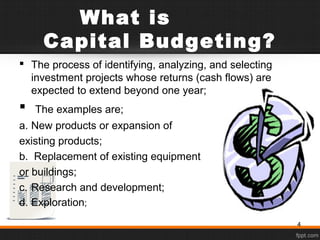
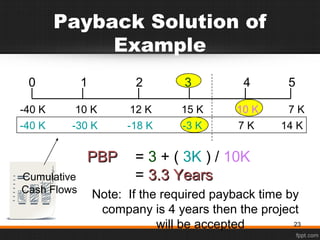
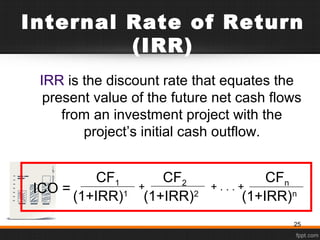
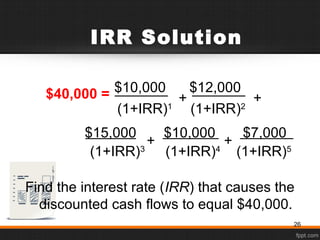
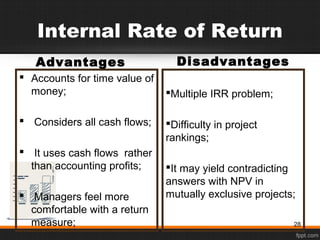
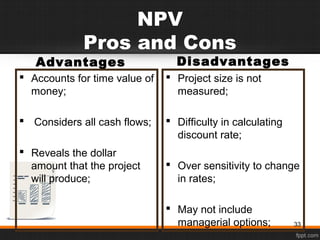
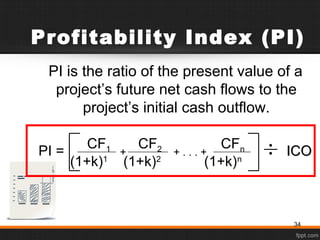
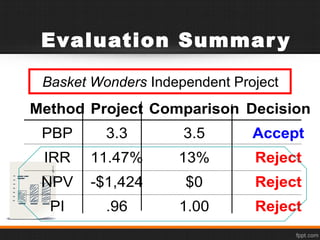
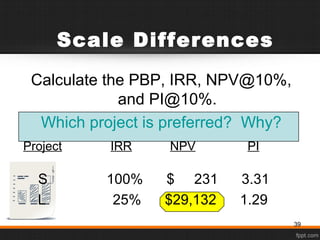
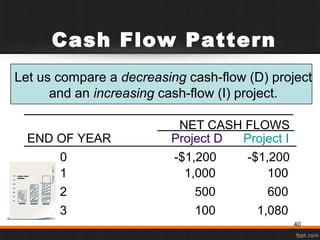
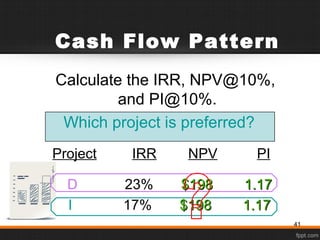
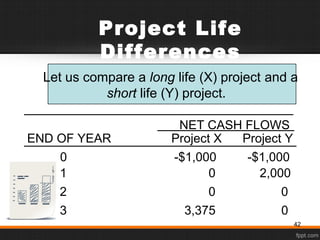
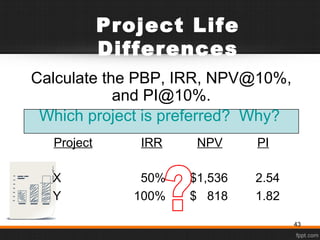
This document discusses various capital budgeting techniques used to evaluate investment projects. It defines capital budgeting as the process of identifying, analyzing and selecting long-term investment projects. The key techniques covered are payback period, internal rate of return (IRR), net present value (NPV) and profitability index (PI). For an example project with $10,000-$15,000 cash flows over 5 years and $40,000 initial cost, the document calculates the metrics and determines that the project should be rejected based on IRR, NPV and PI, though accepted by payback period. It also discusses how the techniques can provide contradictory results for mutually exclusive projects.


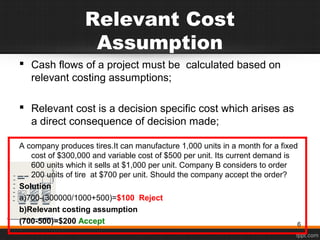

![IRR Acceptance
Criterion
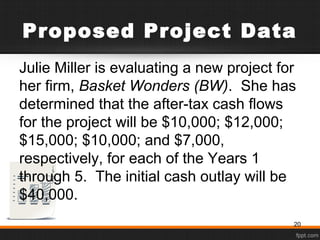
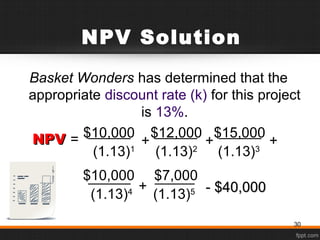
The management of Basket Wonders
has determined that the hurdle rate
is 13% for projects of this type.
Should the project be accepted?
No! The firm will receive 11.57% for
each dollar invested in this project at a
cost of 13%. [ IRR < Hurdle Rate ]
27](https://image.slidesharecdn.com/chapter8-160510103816/85/Chapter-8-Capital-Budgeting-Techniques-27-320.jpg)
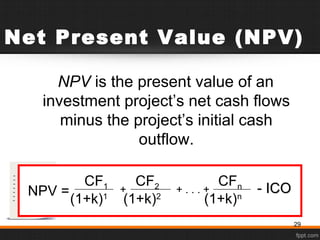
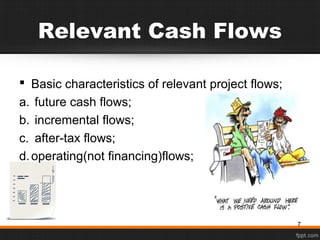
![NPV Acceptance
Criterion
The management of Basket Wonders has
determined that the required rate is 13%
for projects of this type.
Should this project be accepted?
No! The NPV is negative. This means
that the project is reducing shareholder
wealth. [RejectReject as NPVNPV < 00 ]
32](https://image.slidesharecdn.com/chapter8-160510103816/85/Chapter-8-Capital-Budgeting-Techniques-32-320.jpg)
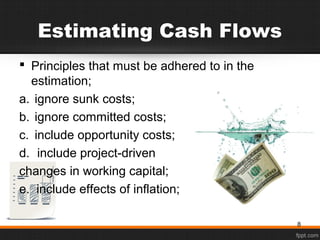
![PI Acceptance
Criterion
PIPI = $38,572 / $40,000
= .9643 (Method #1, 13-34)
Should this project be accepted?
No! The PIPI is less than 1.00. This
means that the project is not profitable.
[RejectReject as PIPI < 1.001.00 ]
35](https://image.slidesharecdn.com/chapter8-160510103816/85/Chapter-8-Capital-Budgeting-Techniques-35-320.jpg)


![Chapter4_Introduction to capital_budgeting[1].pptx](https://cdn.slidesharecdn.com/ss_thumbnails/ch4capitalbudgeting1-250903053140-311b3770-thumbnail.jpg?width=640&height=640&fit=bounds)


