2-2
After studying Chapter4,
you should be able to:
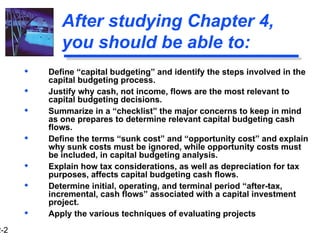
Define “capital budgeting” and identify the steps involved in the
capital budgeting process.
Justify why cash, not income, flows are the most relevant to
capital budgeting decisions.
Summarize in a “checklist” the major concerns to keep in mind
as one prepares to determine relevant capital budgeting cash
flows.
Define the terms “sunk cost” and “opportunity cost” and explain
why sunk costs must be ignored, while opportunity costs must
be included, in capital budgeting analysis.
Explain how tax considerations, as well as depreciation for tax
purposes, affects capital budgeting cash flows.
Determine initial, operating, and terminal period “after-tax,
incremental, cash flows” associated with a capital investment
project.
Apply the various techniques of evaluating projects
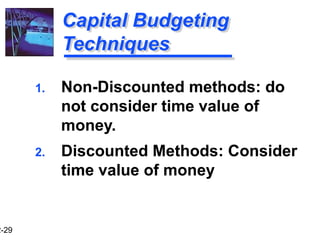
3.
2-3
What is
Capital Budgeting?
Theprocess of identifying,
analyzing, and selecting
investment projects whose
returns (cash flows) are
expected to extend beyond
one year.
4.
2-4
The Capital BudgetingProcess
Generate investment proposals
consistent with the firm’s strategic
objectives.
Estimate after-tax incremental cash
flows for the investment projects.
Estimate the cost of capital relevant for
the project
Evaluate project incremental cash flows.
5.
2-5
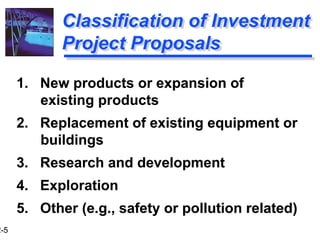
Classification of Investment
ProjectProposals
1. New products or expansion of
existing products
2. Replacement of existing equipment or
buildings
3. Research and development
4. Exploration
5. Other (e.g., safety or pollution related)
2-7
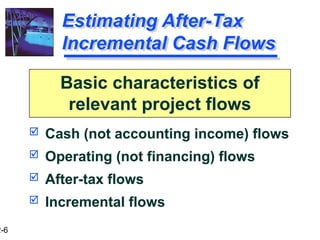
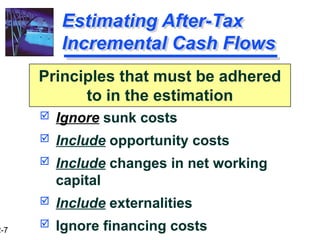
Estimating After-Tax
Incremental CashFlows
Ignore sunk costs
Include opportunity costs
Include changes in net working
capital
Include externalities
Ignore financing costs
Principles that must be adhered
to in the estimation
8.
2-8
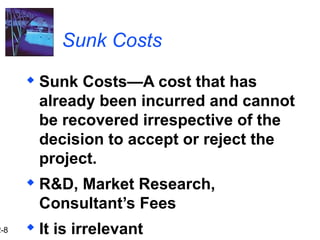
Sunk Costs
SunkCosts—A cost that has
already been incurred and cannot
be recovered irrespective of the
decision to accept or reject the
project.
R&D, Market Research,
Consultant’s Fees
It is irrelevant
9.
2-9
Opportunity Costs
OpportunityCosts--The cash flow foregone by
using your resources in a particular way.
Resources have multiple uses
You can use them in one way to the exclusion
of other uses and this gives rise to opportunity
costs
By using your own building for your business,
you forego the rent that you could have earned
by renting it to some one else.
It is relevant to decision making.
10.
2-10
Project Externalities
ProjectExternalities--the effect of a
new project (positive or negative) on
an existing project or division of a
firm.
For instance, introduction of a new
model of a car on other existing
models produced by the same firm.
Positive externality is revenue of the
project and negative externality is
cost
11.
2-11
Net Working Capital
Change in Net Working Capital--Net
working capital is defined as current
assets minus current liabilities.
Investment in working capital is a
cash outflow during the year in
which investment takes place
Any investment in working capital is
a cash inflow during the last year of
the project and must be treated
accordingly
12.
2-12
Financing costs
Financingcosts are considered in
the discounting rate (the cost of
capital).
They are not considered in
determining the cash flows of the
project. Otherwise it would be
double counting.
13.
2-13
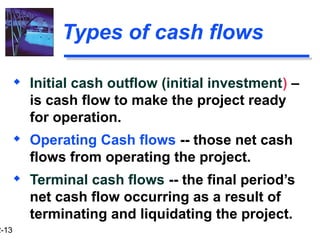
Types of cashflows
Initial cash outflow (initial investment) –
is cash flow to make the project ready
for operation.
Operating Cash flows -- those net cash
flows from operating the project.
Terminal cash flows -- the final period’s
net cash flow occurring as a result of
terminating and liquidating the project.
14.
2-14
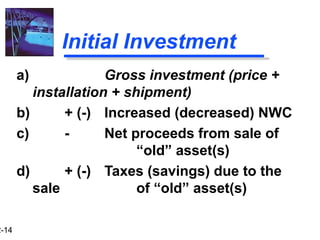
Initial Investment
a) Grossinvestment (price +
installation + shipment)
b) + (-) Increased (decreased) NWC
c) - Net proceeds from sale of
“old” asset(s)
d) + (-) Taxes (savings) due to the
sale of “old” asset(s)
15.
2-15
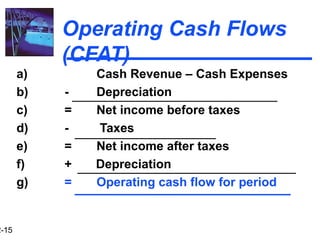
Operating Cash Flows
(CFAT)
a)Cash Revenue – Cash Expenses
b) - Depreciation
c) = Net income before taxes
d) - Taxes
e) = Net income after taxes
f) + Depreciation
g) = Operating cash flow for period
16.
2-16
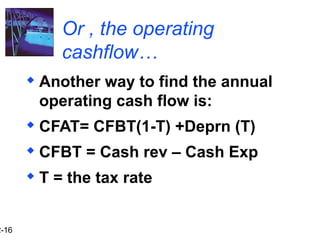
Or , theoperating
cashflow…
Another way to find the annual
operating cash flow is:
CFAT= CFBT(1-T) +Deprn (T)
CFBT = Cash rev – Cash Exp
T = the tax rate
17.
2-17
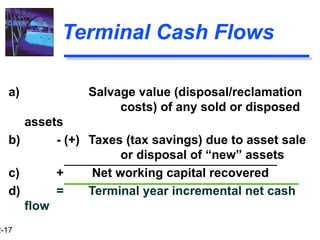
Terminal Cash Flows
a)Salvage value (disposal/reclamation
costs) of any sold or disposed
assets
b) - (+) Taxes (tax savings) due to asset sale
or disposal of “new” assets
c) + Net working capital recovered
d) = Terminal year incremental net cash
flow
18.
2-18
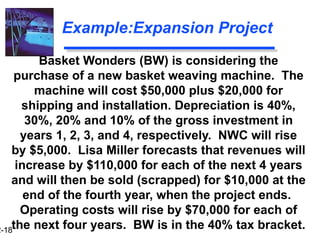
Example:Expansion Project
Basket Wonders(BW) is considering the
purchase of a new basket weaving machine. The
machine will cost $50,000 plus $20,000 for
shipping and installation. Depreciation is 40%,
30%, 20% and 10% of the gross investment in
years 1, 2, 3, and 4, respectively. NWC will rise
by $5,000. Lisa Miller forecasts that revenues will
increase by $110,000 for each of the next 4 years
and will then be sold (scrapped) for $10,000 at the
end of the fourth year, when the project ends.
Operating costs will rise by $70,000 for each of
the next four years. BW is in the 40% tax bracket.
19.
2-19
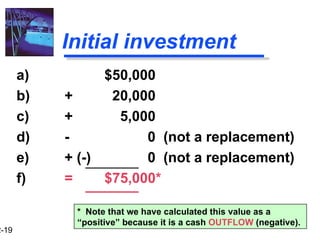
Initial investment
a) $50,000
b)+ 20,000
c) + 5,000
d) - 0 (not a replacement)
e) + (-) 0 (not a replacement)
f) = $75,000*
* Note that we have calculated this value as a
“positive” because it is a cash OUTFLOW (negative).
20.
2-20
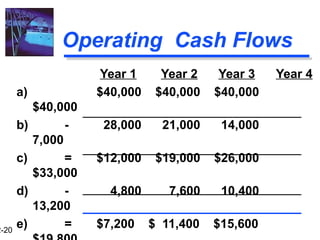
Operating Cash Flows
Year1 Year 2 Year 3 Year 4
a) $40,000 $40,000 $40,000
$40,000
b) - 28,000 21,000 14,000
7,000
c) = $12,000 $19,000 $26,000
$33,000
d) - 4,800 7,600 10,400
13,200
e) = $7,200 $ 11,400 $15,600
21.
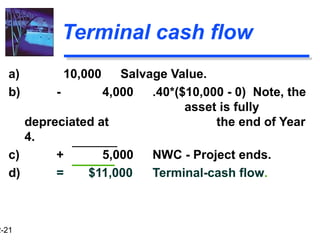
2-21
Terminal cash flow
a)10,000 Salvage Value.
b) - 4,000 .40*($10,000 - 0) Note, the
asset is fully
depreciated at the end of Year
4.
c) + 5,000 NWC - Project ends.
d) = $11,000 Terminal-cash flow.
22.
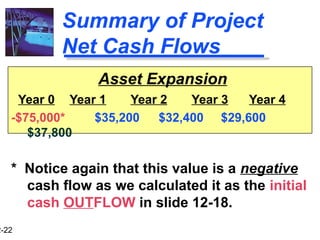
2-22
Summary of Project
NetCash Flows
Asset Expansion
Year 0 Year 1 Year 2 Year 3 Year 4
-$75,000* $35,200 $32,400 $29,600
$37,800
* Notice again that this value is a negative
cash flow as we calculated it as the initial
cash OUTFLOW in slide 12-18.
23.
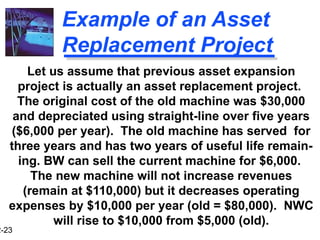
2-23
Example of anAsset
Replacement Project
Let us assume that previous asset expansion
project is actually an asset replacement project.
The original cost of the old machine was $30,000
and depreciated using straight-line over five years
($6,000 per year). The old machine has served for
three years and has two years of useful life remain-
ing. BW can sell the current machine for $6,000.
The new machine will not increase revenues
(remain at $110,000) but it decreases operating
expenses by $10,000 per year (old = $80,000). NWC
will rise to $10,000 from $5,000 (old).
24.
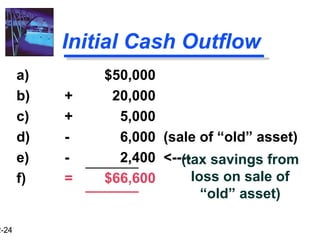
2-24
Initial Cash Outflow
a)$50,000
b) + 20,000
c) + 5,000
d) - 6,000 (sale of “old” asset)
e) - 2,400 <----
f) = $66,600
(tax savings from
loss on sale of
“old” asset)
25.
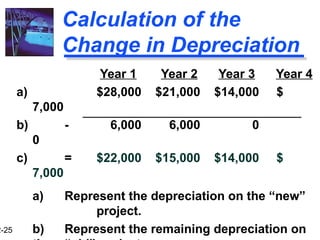
2-25
Calculation of the
Changein Depreciation
Year 1 Year 2 Year 3 Year 4
a) $28,000 $21,000 $14,000 $
7,000
b) - 6,000 6,000 0
0
c) = $22,000 $15,000 $14,000 $
7,000
a) Represent the depreciation on the “new”
project.
b) Represent the remaining depreciation on
26.
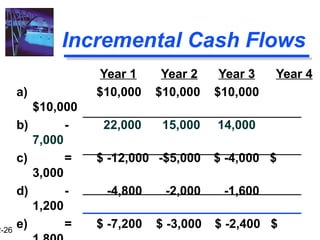
2-26
Incremental Cash Flows
Year1 Year 2 Year 3 Year 4
a) $10,000 $10,000 $10,000
$10,000
b) - 22,000 15,000 14,000
7,000
c) = $ -12,000 -$5,000 $ -4,000 $
3,000
d) - -4,800 -2,000 -1,600
1,200
e) = $ -7,200 $ -3,000 $ -2,400 $
27.
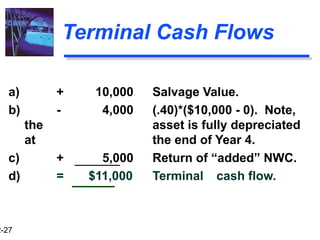
2-27
Terminal Cash Flows
a)+ 10,000 Salvage Value.
b) - 4,000 (.40)*($10,000 - 0). Note,
the asset is fully depreciated
at the end of Year 4.
c) + 5,000 Return of “added” NWC.
d) = $11,000 Terminal cash flow.
28.
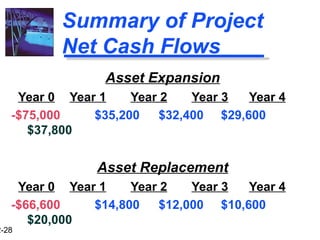
2-28
Summary of Project
NetCash Flows
Asset Expansion
Year 0 Year 1 Year 2 Year 3 Year 4
-$75,000 $35,200 $32,400 $29,600
$37,800
Asset Replacement
Year 0 Year 1 Year 2 Year 3 Year 4
-$66,600 $14,800 $12,000 $10,600
$20,000
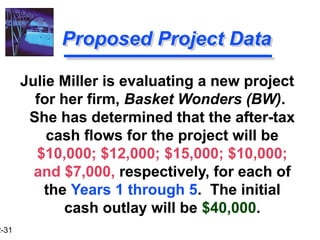
2-31
Proposed Project Data
JulieMiller is evaluating a new project
for her firm, Basket Wonders (BW).
She has determined that the after-tax
cash flows for the project will be
$10,000; $12,000; $15,000; $10,000;
and $7,000, respectively, for each of
the Years 1 through 5. The initial
cash outlay will be $40,000.
32.
2-32
Independent Project
Independent-- A project whose
acceptance (or rejection) does not
prevent the acceptance of other
projects under consideration.
For this project, assume that it is
independent of any other potential
projects that Basket Wonders may
undertake.
33.
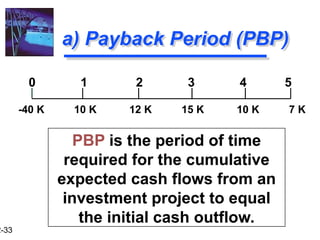
2-33
a) Payback Period(PBP)
PBP is the period of time
required for the cumulative
expected cash flows from an
investment project to equal
the initial cash outflow.
0 1 2 3 4 5
-40 K 10 K 12 K 15 K 10 K 7 K
34.
2-34
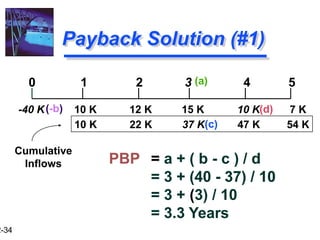
(c)
10 K 22K 37 K 47 K 54 K
Payback Solution (#1)
PBP = a + ( b - c ) / d
= 3 + (40 - 37) / 10
= 3 + (3) / 10
= 3.3 Years
0 1 2 3 4 5
-40 K 10 K 12 K 15 K 10 K 7 K
Cumulative
Inflows
(a)
(-b) (d)
35.
2-35
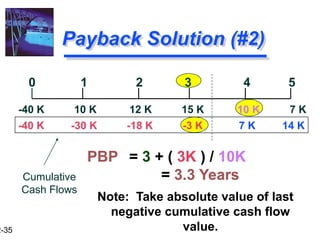
Payback Solution (#2)
PBP= 3 + ( 3K ) / 10K
= 3.3 Years
Note: Take absolute value of last
negative cumulative cash flow
value.
Cumulative
Cash Flows
-40 K 10 K 12 K 15 K 10 K 7 K
0 1 2 3 4 5
-40 K -30 K -18 K -3 K 7 K 14 K
36.
2-36
PBP Acceptance Criterion
Yes!The firm will receive back the
initial cash outlay in less than 3.5
years. [3.3 Years < 3.5 Year Max.]
The management of Basket Wonders
has set a maximum PBP of 3.5
years for projects of this type.
Should this project be accepted?
37.
2-37
PBP Strengths
and Weaknesses
Strengths:
Easy to use and
understand
Can be used as a
measure of
liquidity & risk
Weaknesses:
Does not account
for TVM
Does not consider
cash flows
beyond the PBP
Cutoff period is
38.
2-38
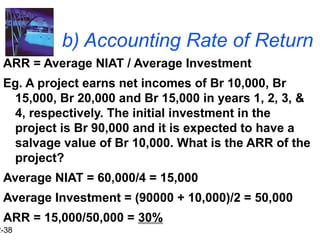
b) Accounting Rateof Return
ARR = Average NIAT / Average Investment
Eg. A project earns net incomes of Br 10,000, Br
15,000, Br 20,000 and Br 15,000 in years 1, 2, 3, &
4, respectively. The initial investment in the
project is Br 90,000 and it is expected to have a
salvage value of Br 10,000. What is the ARR of the
project?
Average NIAT = 60,000/4 = 15,000
Average Investment = (90000 + 10,000)/2 = 50,000
ARR = 15,000/50,000 = 30%
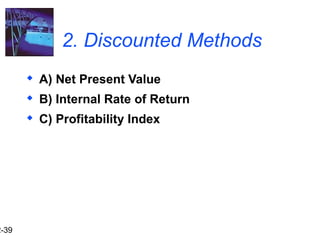
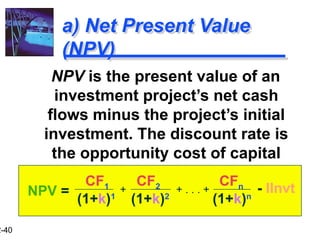
2-40
a) Net PresentValue
(NPV)
NPV is the present value of an
investment project’s net cash
flows minus the project’s initial
investment. The discount rate is
the opportunity cost of capital
CF1 CF2 CFn
(1+k)1
(1+k)2
(1+k)n
+ . . . +
+ - IInvt
NPV =
41.
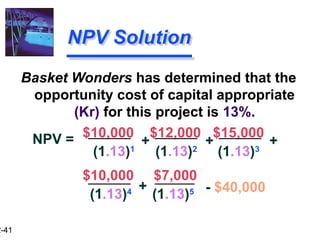
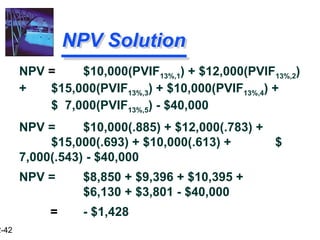
2-41
Basket Wonders hasdetermined that the
opportunity cost of capital appropriate
(Kr) for this project is 13%.
$10,000 $7,000
NPV Solution
$10,000 $12,000 $15,000
(1.13)1
(1.13)2
(1.13)3
+ +
+ - $40,000
(1.13)4
(1.13)5
NPV = +
2-43
NPV Acceptance Criterion
No!The NPV is negative. This means
that the project is reducing shareholder
wealth. [Reject as NPV < 0 ]
The management of Basket Wonders
has determined that the required
rate is 13% for projects of this type.
Should this project be accepted?
44.
2-44
NPV Strengths
and Weaknesses
Strengths:
Cash flows
assumed to be
reinvested at
the hurdle rate.
Accounts for TVM.
Considers all
cash flows.
Weaknesses:
May not include
managerial
options
embedded in the
project.
45.
2-45
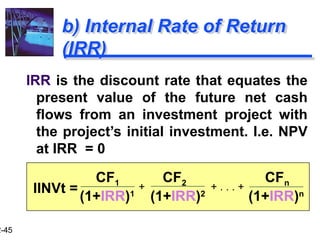
b) Internal Rateof Return
(IRR)
IRR is the discount rate that equates the
present value of the future net cash
flows from an investment project with
the project’s initial investment. I.e. NPV
at IRR = 0
CF1 CF2 CFn
(1+IRR)1
(1+IRR)2
(1+IRR)n
+ . . . +
+
IINVt =
46.
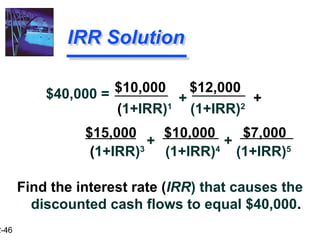
2-46
$15,000 $10,000 $7,000
IRRSolution
$10,000 $12,000
(1+IRR)1
(1+IRR)2
Find the interest rate (IRR) that causes the
discounted cash flows to equal $40,000.
+ +
+
+
$40,000 =
(1+IRR)3
(1+IRR)4
(1+IRR)5
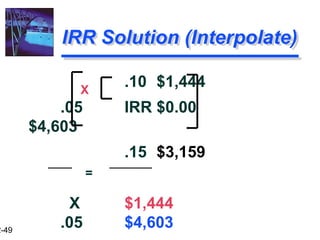
2-49
.10 $1,444
.05 IRR$0.00
$4,603
.15 $3,159
X $1,444
.05 $4,603
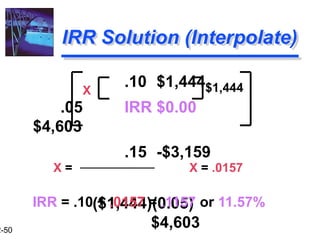
IRR Solution (Interpolate)
X
=
50.
2-50
.10 $1,444
.05 IRR$0.00
$4,603
.15 -$3,159
($1,444)(0.05)
$4,603
IRR Solution (Interpolate)
$1,444
X
X = X = .0157
IRR = .10 + .0157 = .1157 or 11.57%
51.
2-51
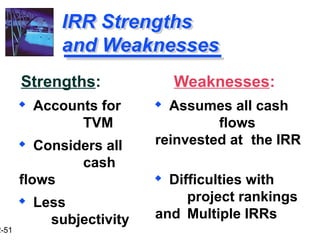
IRR Strengths
and Weaknesses
Strengths:
Accounts for
TVM
Considers all
cash
flows
Less
subjectivity
Weaknesses:
Assumes all cash
flows
reinvested at the IRR
Difficulties with
project rankings
and Multiple IRRs
52.
2-52
Profitability Index (PI)
PIis the ratio of the present value of
a project’s future net cash flows to
the project’s initial investment.
CF1 CF2 CFn
(1+k)1
(1+k)2
(1+k)n
+ . . . +
+ IInVT
PI =
PI = 1 + [ NPV / IINVT ]
<< OR >>
Method #2:
Method #1:
53.
2-53
PI Strengths
and Weaknesses
Strengths:
Same as NPV
Allows
comparison of
different scale
projects
Weaknesses:
Same as NPV
Provides only
relative
profitability
Potential Ranking
Problems
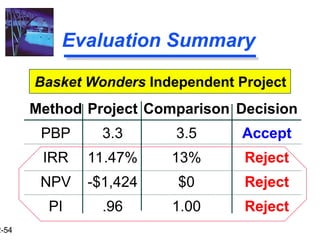
2-55
Project Relationships
Mutually Exclusive-- A project whose
acceptance precludes the acceptance
of one or more alternative projects.
Independent -- A project whose acceptance
(or rejection) does not prevent the
acceptance of other projects under
consideration.
56.
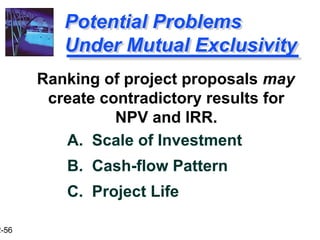
2-56
Potential Problems
Under MutualExclusivity
A. Scale of Investment
B. Cash-flow Pattern
C. Project Life
Ranking of project proposals may
create contradictory results for
NPV and IRR.
57.
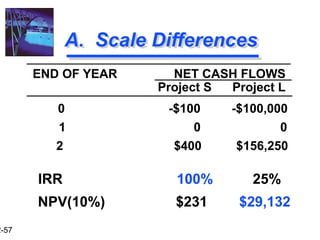
2-57
A. Scale Differences
NETCASH FLOWS
Project S Project L
END OF YEAR
0 -$100 -$100,000
1 0 0
2 $400 $156,250
IRR 100% 25%
NPV(10%) $231 $29,132
58.
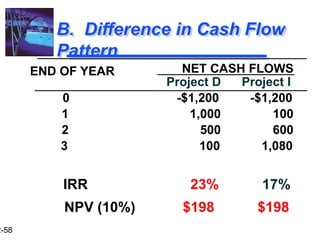
2-58
B. Difference inCash Flow
Pattern
NET CASH FLOWS
Project D Project I
END OF YEAR
0 -$1,200 -$1,200
1 1,000 100
2 500 600
3 100 1,080
IRR 23% 17%
NPV (10%) $198 $198
59.
2-59
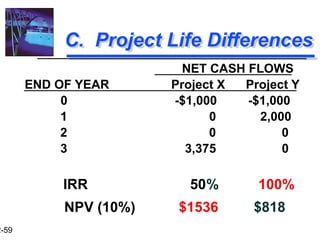
C. Project LifeDifferences
NET CASH FLOWS
Project X Project Y
END OF YEAR
0 -$1,000 -$1,000
1 0 2,000
2 0 0
3 3,375 0
IRR 50% 100%
NPV (10%) $1536 $818
60.
2-60
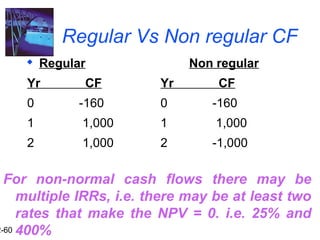
Regular Vs Nonregular CF
Regular
Yr CF
0 -160
1 1,000
2 1,000
Non regular
Yr CF
0 -160
1 1,000
2 -1,000
For non-normal cash flows there may be
multiple IRRs, i.e. there may be at least two
rates that make the NPV = 0. i.e. 25% and
400%
61.
2-61
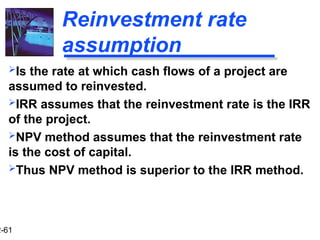
Reinvestment rate
assumption
Is therate at which cash flows of a project are
assumed to reinvested.
IRR assumes that the reinvestment rate is the IRR
of the project.
NPV method assumes that the reinvestment rate
is the cost of capital.
Thus NPV method is superior to the IRR method.
62.
2-62
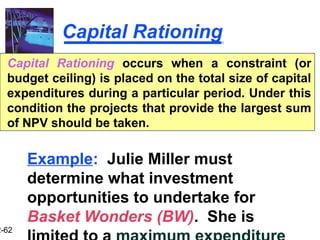
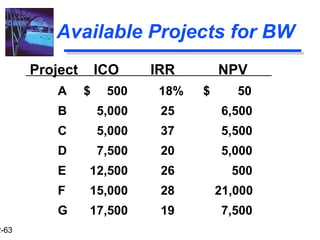
Capital Rationing
Capital Rationingoccurs when a constraint (or
budget ceiling) is placed on the total size of capital
expenditures during a particular period. Under this
condition the projects that provide the largest sum
of NPV should be taken.
Example: Julie Miller must
determine what investment
opportunities to undertake for
Basket Wonders (BW). She is
63.
2-63
Available Projects forBW
Project ICO IRR NPV
A $ 500 18% $ 50
B 5,000 25 6,500
C 5,000 37 5,500
D 7,500 20 5,000
E 12,500 26 500
F 15,000 28 21,000
G 17,500 19 7,500


![2-36
PBP Acceptance Criterion
Yes! The firm will receive back the
initial cash outlay in less than 3.5
years. [3.3 Years < 3.5 Year Max.]
The management of Basket Wonders
has set a maximum PBP of 3.5
years for projects of this type.
Should this project be accepted?](https://image.slidesharecdn.com/ch4capitalbudgeting1-250903053140-311b3770/85/Chapter4_Introduction-to-capital_budgeting-1-pptx-36-320.jpg)

![2-43
NPV Acceptance Criterion
No! The NPV is negative. This means
that the project is reducing shareholder
wealth. [Reject as NPV < 0 ]
The management of Basket Wonders
has determined that the required
rate is 13% for projects of this type.
Should this project be accepted?](https://image.slidesharecdn.com/ch4capitalbudgeting1-250903053140-311b3770/85/Chapter4_Introduction-to-capital_budgeting-1-pptx-43-320.jpg)


![2-52
Profitability Index (PI)
PI is the ratio of the present value of
a project’s future net cash flows to
the project’s initial investment.
CF1 CF2 CFn
(1+k)1
(1+k)2
(1+k)n
+ . . . +
+ IInVT
PI =
PI = 1 + [ NPV / IINVT ]
<< OR >>
Method #2:
Method #1:](https://image.slidesharecdn.com/ch4capitalbudgeting1-250903053140-311b3770/85/Chapter4_Introduction-to-capital_budgeting-1-pptx-52-320.jpg)