Downloaded 151 times
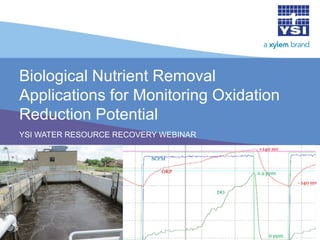
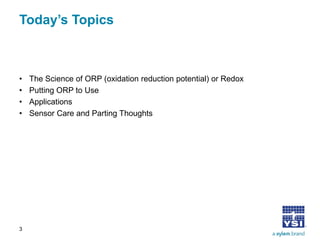

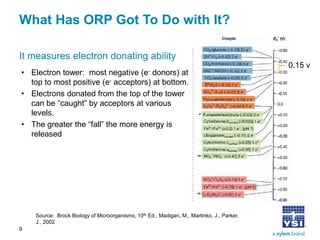
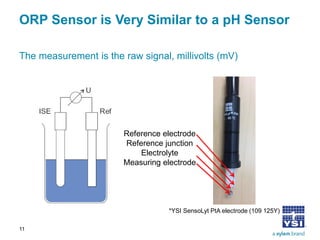

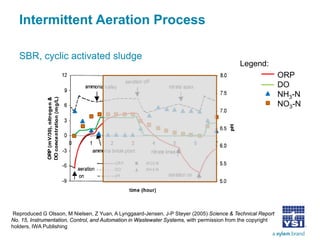

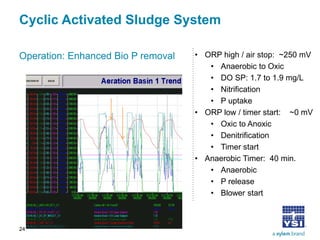
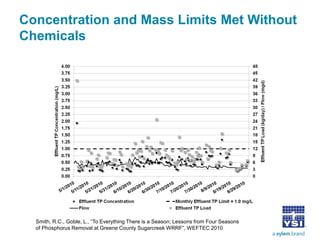


The document discusses the application of oxidation reduction potential (ORP) in biological nutrient removal processes, emphasizing its role in assessing the electron donating ability of bacteria during wastewater treatment. It covers topics such as the science behind ORP, its monitoring methods, and practical applications within different aeration processes to optimize nutrient removal. Additionally, it addresses sensor care, calibration, and the importance of ORP measurements in evaluating the efficiency of wastewater treatment systems.