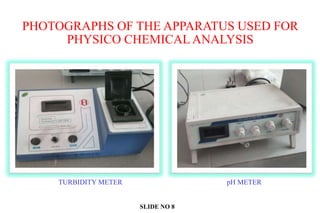
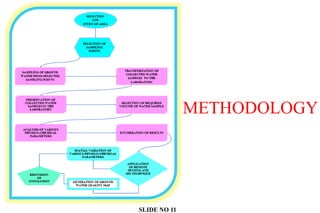
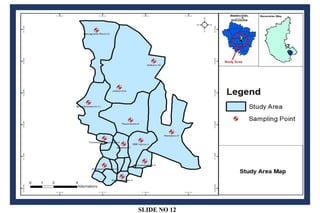
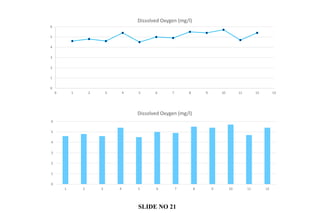
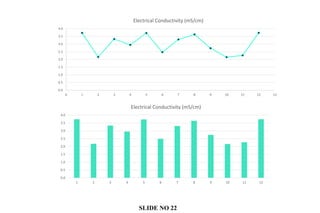
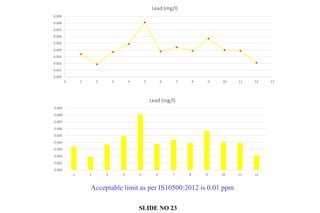
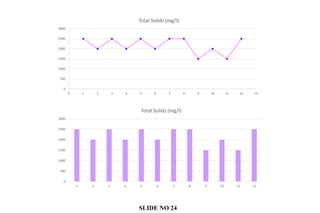
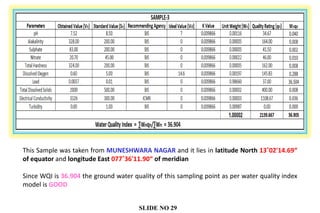
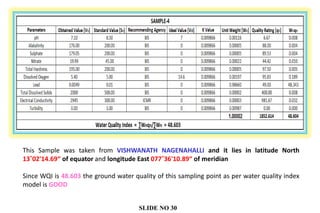
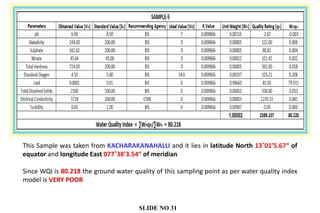
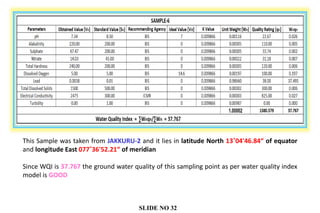
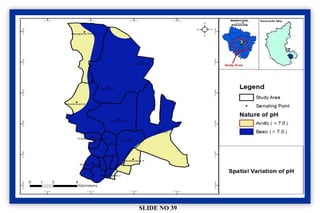
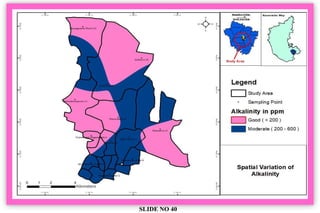
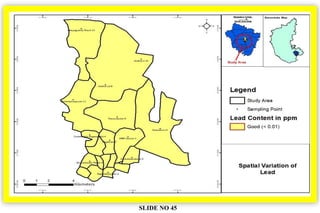
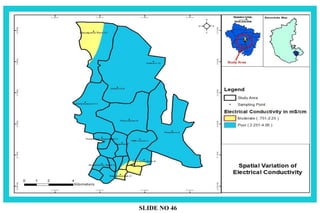
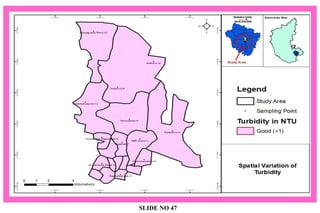
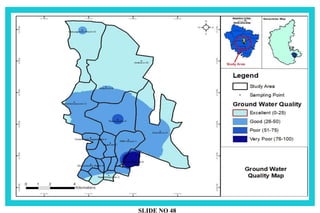
HKBK COLLEGE OF ENGINEERING
“PHYSICO-CHEMICALANALYSIS OF GROUND WATER QUALITY OF
AND APPLICATION OF GIS AND REMOTE SENSING TECHNIQUE”
SLIDE NO 1
CONTENTS
 INTRODUCTION
 LITERATURE REVIEW
 OBJECTIVES OF THE PROPOSED WORK
 SCOPE OF THE PROPOSED WORK
 PHYSICO CHEMICAL PARAMETERS
 PHOTOGRAPHS OF THE APPARATUS USED FOR PHYSICO
CHEMICALANALYSIS
 METHODOLOGY OF THE PROPOSED WORK
 STUDY AREA MAP
 GPS DEVICE
 REMOTE SENSING DATA
 RESULTS AND DISCUSSION
 SPATIAL VARIATION OF PHYSICOCHEMICAL PARAMETERS
 GROUND WATER QUALITY MAP
 CONCLUSIONS
 REFERENCES
SLIDE NO 2
INTRODUCTION
Physico-Chemical Analysis: It basically refers to the analysis
of physical and chemical parameters of water
IMPORTANCE:
 It enables us to determine the extent to which water is
potable for drinking
 It is helpful in determining whether the groundwater is
contaminated with sewage or not
SLIDE NO 3
 Recently, G. Sheeba, Anjaneyulu Jalagam and Padma
Venkatasubramanian (November 2017) conducted the study
on various parameters of ground water in peri urban
Bengaluru. They found that the ground water was poor in
quality with refence to its chemical and various other
parameters
 Therefore, it may be possible that the residents of Bangalore
Urban may be utilizing ground water which is unhygienic.
Thus, this is one of our motive to carry out this project.
LITERATURE REVIEW
SLIDE NO 4
OBJECTIVES OF THE PROPOSED WORK
 To analyze the ground water quality of bangalore urban area
by determining various physico-chemical parameters
 To learn and apply the technique of GIS AND REMOTE
SENSING for groundwater quality assessment
 To assess the suitability of groundwater for drinking
purposes
 To generate the spatial variation maps of various physico-
chemical parameters by using ArcGIS
 Finally, to generate ground water quality map with the help
of the software ArcGIS 10.5 by using WQI
SLIDE NO 5
SCOPE OF THE PROPOSED WORK
 The physico-chemical analysis of ground water quality helps
us to determine whether the ground water is contaminated
with impurities such as sewage or not.
 This analysis helps us to determine whether the polluted
water has been infiltrated into the groundwater.
 This analysis also helps us to determine the extent to which
groundwater is safe for drinking, bathing, washing utensils,
etc.
 This enables us to determine the suitability of groundwater
for drinking purpose which is vital aspect of this project.
SLIDE NO 6
 Turbidity
 pH
 Alkalinity
 Electrical conductivity
 Total solids
 Total Dissolved Solids
 Dissolved Oxygen
 Lead content
 Sulphate
 Nitrate
 Total Hardness
 Suspended Solids
PHYSICO CHEMICAL PARAMETERS
SLIDE NO 7
PHOTOGRAPHS OF THE APPARATUS USED FOR
PHYSICO CHEMICAL ANALYSIS
TURBIDITY METER pH METER
SLIDE NO 8
PHOTOGRAPHS OF THE APPARATUS USED FOR
PHYSICO CHEMICAL ANALYSIS
BUNSEN BURNER ALONG
WITH
EVAPORATING DISH
MAGNETIC STIRRER
SLIDE NO 9
PHOTOGRAPHS OF THE APPARATUS USED FOR
PHYSICO CHEMICAL ANALYSIS
SPECTROPHOTOMETER DIGITAL CONDUCTIVITY METER
SLIDE NO 10
METHODOLOGY
SLIDE NO 11
SLIDE NO 12
GPS DEVICE
 Remote Sensing data (GPS Data) was
collected with the help of the instrument as
shown
 GPS data of all the Selected Sampling
points was collected in terms of latitude
north of equator and longitude east of
meridian
SLIDE NO 13
REMOTE SENSING DATA
SLIDE NO 14
RESULTS
SAMPLES
1
2
3
4
5
6
7
8
9
10
11
12
SLIDE NO 15
Lead (mg/l) Total Solids (mg/l) Electrical Conductivity (mS/cm) Turbidity in NTU Total Dissolved Solids (mg/l) GROUND_WQI
0.0034 2500 3.726 0.00 2500 33.842
0.0019 2000 2.164 0.00 1500 19.075
0.0037 2500 3.326 0.00 2000 36.904
0.0049 2000 2.945 0.00 2000 48.603
0.0081 2500 3.718 0.00 2500 80.218
0.0038 2000 2.475 0.00 1500 37.767
0.0044 2500 3.297 0.00 2000 43.688
0.0039 2500 3.627 0.00 2500 38.833
0.0057 1500 2.731 0.00 1500 56.529
0.0040 2000 2.147 0.00 1500 39.680
0.0039 1500 2.265 0.00 1500 38.712
0.0021 2500 3.729 0.00 2500 20.972
Ph with pH meter Alkalinity (mg/l) Sulphate as SO4 (mg/l) Nitrate as NO3 (mg/l) Total hardness as CaCo3 (mg/l)
7.25 84.00 75.41 20.25 348.00
8.08 272.00 45.89 2.83 268.00
7.52 328.00 83.00 20.70 324.00
7.10 176.00 179.05 19.99 195.00
6.96 244.00 161.62 45.64 724.00
7.34 220.00 67.47 14.03 240.00
7.06 320.00 68.06 16.33 528.00
8.20 190.00 71.14 8.74 656.00
7.68 184.00 109.44 6.31 260.00
6.85 128.00 24.30 17.40 172.00
6.66 186.00 115.61 32.04 182.00
6.92 96.00 35.21 21.59 272.00
SAMPLES
1
2
3
4
5
6
7
8
9
10
11
12
0
1
2
3
4
5
6
7
8
9
1 2 3 4 5 6 7 8 9 10 11 12
pH
Ph with pH meter pH with pH paper
0
1
2
3
4
5
6
7
8
9
0 1 2 3 4 5 6 7 8 9 10 11 12 13
Ph with pH meter
0
1
2
3
4
5
6
7
8
9
0 1 2 3 4 5 6 7 8 9 10 11 12 13
pH with pH paper
Acceptable limit as per IS10500:2012 is 6.5-8.5
SLIDE NO 16
Acceptable limit as per IS10500:2012 is 200 ppm Permissible limit as per IS10500:2012 is 600 ppm
0
50
100
150
200
250
300
350
1 2 3 4 5 6 7 8 9 10 11 12
Alkalinity (mg/l)
0
50
100
150
200
250
300
350
0 1 2 3 4 5 6 7 8 9 10 11 12 13
Alkalinity (mg/l)
SLIDE NO 17
0
20
40
60
80
100
120
140
160
180
200
1 2 3 4 5 6 7 8 9 10 11 12
SULPHATE as SO4 (mg/l)
0
20
40
60
80
100
120
140
160
180
200
0 1 2 3 4 5 6 7 8 9 10 11 12 13
Sulphate as SO4 (mg/l)
Acceptable limit as per IS10500:2012 is 200 ppm Permissible limit as per IS10500:2012 is 400 ppm
SLIDE NO 18
0
5
10
15
20
25
30
35
40
45
50
1 2 3 4 5 6 7 8 9 10 11 12
Nitrate as NO3 (mg/l)
Acceptable limit as per IS10500:2012 is 45 ppm
0
5
10
15
20
25
30
35
40
45
50
0 1 2 3 4 5 6 7 8 9 10 11 12 13
Nitrate as NO3 (mg/l)
SLIDE NO 19
0
100
200
300
400
500
600
700
800
1 2 3 4 5 6 7 8 9 10 11 12
Total hardness as CaCo3 (mg/l)
0
100
200
300
400
500
600
700
800
0 1 2 3 4 5 6 7 8 9 10 11 12 13
Total hardness as CaCo3 (mg/l)
Acceptable limit as per IS10500:2012 is 200 ppm Permissible limit as per IS10500:2012 is 600 ppm
SLIDE NO 20
0
1
2
3
4
5
6
1 2 3 4 5 6 7 8 9 10 11 12
Dissolved Oxygen (mg/l)
0
1
2
3
4
5
6
0 1 2 3 4 5 6 7 8 9 10 11 12 13
Dissolved Oxygen (mg/l)
SLIDE NO 21
0.0
0.5
1.0
1.5
2.0
2.5
3.0
3.5
4.0
1 2 3 4 5 6 7 8 9 10 11 12
Electrical Conductivity (mS/cm)
0.0
0.5
1.0
1.5
2.0
2.5
3.0
3.5
4.0
0 1 2 3 4 5 6 7 8 9 10 11 12 13
Electrical Conductivity (mS/cm)
SLIDE NO 22
Acceptable limit as per IS10500:2012 is 0.01 ppm
0.000
0.001
0.002
0.003
0.004
0.005
0.006
0.007
0.008
0.009
1 2 3 4 5 6 7 8 9 10 11 12
Lead (mg/l)
0.000
0.001
0.002
0.003
0.004
0.005
0.006
0.007
0.008
0.009
0 1 2 3 4 5 6 7 8 9 10 11 12 13
Lead (mg/l)
SLIDE NO 23
0
500
1000
1500
2000
2500
3000
1 2 3 4 5 6 7 8 9 10 11 12
Total Solids (mg/l)
0
500
1000
1500
2000
2500
3000
0 1 2 3 4 5 6 7 8 9 10 11 12 13
Total Solids (mg/l)
SLIDE NO 24
0
500
1000
1500
2000
2500
3000
1 2 3 4 5 6 7 8 9 10 11 12 13
Total Dissolved Solids (mg/l)
0
500
1000
1500
2000
2500
3000
0 1 2 3 4 5 6 7 8 9 10 11 12 13
Total Dissolved Solids (mg/l)
Acceptable limit as per IS10500:2012 is 500 ppm Permissible limit as per IS10500:2012 is 2000 ppm
SLIDE NO 25
Ground Water Quality
depends on Water Quality
Index (WQI)
0
10
20
30
40
50
60
70
80
90
0 1 2 3 4 5 6 7 8 9 10 11 12 13
Water Quality Index (WQI)
0
10
20
30
40
50
60
70
80
90
1 2 3 4 5 6 7 8 9 10 11 12
Water Quality Index (WQI)
SLIDE NO 26
This Sample was taken from HBR LAYOUT and it lies in latitude North 13˚02'7.64“ of equator
and longitude East 077˚37'51.66“ of meridian
Since WQI is 33.842 the ground water quality of this sampling point as per water quality index
model is GOOD
SLIDE NO 27
This Sample was taken from SAGAYAPURAM and it lies in latitude North 13˚00'19.82“ of
equator and longitude East 077˚36'59.26“ of meridian
Since WQI is 19.075 the ground water quality of this sampling point as per water quality index
model is EXCELLENT
SLIDE NO 28
This Sample was taken from MUNESHWARA NAGAR and it lies in latitude North 13˚02'14.69“
of equator and longitude East 077˚36'11.90“ of meridian
Since WQI is 36.904 the ground water quality of this sampling point as per water quality index
model is GOOD
SLIDE NO 29
This Sample was taken from VISHWANATH NAGENAHALLI and it lies in latitude North
13˚02'14.69“ of equator and longitude East 077˚36'10.89“ of meridian
Since WQI is 48.603 the ground water quality of this sampling point as per water quality index
model is GOOD
SLIDE NO 30
This Sample was taken from KACHARAKANAHALLI and it lies in latitude North 13˚01'5.67“ of
equator and longitude East 077˚38'3.54“ of meridian
Since WQI is 80.218 the ground water quality of this sampling point as per water quality index
model is VERY POOR
SLIDE NO 31
This Sample was taken from JAKKURU-2 and it lies in latitude North 13˚04'46.84“ of equator
and longitude East 077˚36'52.21“ of meridian
Since WQI is 37.767 the ground water quality of this sampling point as per water quality index
model is GOOD
SLIDE NO 32
This Sample was taken from NAGAWARA and it lies in latitude North 13˚01'58.56“ of equator
and longitude East 077˚37'4.30“ of meridian
Since WQI is 43.688 the ground water quality of this sampling point as per water quality index
model is GOOD
SLIDE NO 33
This Sample was taken from HORAMAVU and it lies in latitude North 13˚02'33.47“ of equator
and longitude East 077˚39'18.26“ of meridian
Since WQI is 38.833 the ground water quality of this sampling point as per water quality index
model is GOOD
SLIDE NO 34
This Sample was taken from THANISANDRA and it lies in latitude North 13˚03'8.91“ of equator
and longitude East 077˚37'24.30“ of meridian
Since WQI is 56.529 the ground water quality of this sampling point as per water quality index
model is POOR
SLIDE NO 35
This Sample was taken from KEMPEGOWDA WARD and it lies in latitude North 13˚07'37.95“
of equator and longitude East 077˚35'49.60“ of meridian
Since WQI is 39.680 the ground water quality of this sampling point as per water quality index
model is GOOD
SLIDE NO 36
This Sample was taken from BYATARAYANAPURA and it lies in latitude North 13˚04'1.35“ of
equator and longitude East 077˚35'27.83“ of meridian
Since WQI is 38.712 the ground water quality of this sampling point as per water quality index
model is GOOD
SLIDE NO 37
This Sample was taken from JAKKURU and it lies in latitude North 13˚06’05” of equator and
longitude East 077˚38'28" of meridian
Since WQI is 20.972 the ground water quality of this sampling point as per water quality index
model is EXCELLENT
SLIDE NO 38
SLIDE NO 39
SLIDE NO 40
SLIDE NO 41
SLIDE NO 42
SLIDE NO 43
SLIDE NO 44
SLIDE NO 45
SLIDE NO 46
SLIDE NO 47
SLIDE NO 48
CONCLUSION
SLIDE NO 49
REFERENCES
 Environmental Protection Administration, R.O.C., Taiwan. Environmental Water Quality
Information.
 This analysis helps us to determine whether the water is suitable for irrigation purposes
 K. L. Prakash and R. K. Somashekar. Groundwater quality - Assessment on Anekal Taluk,
Bangalore Urban district, India. Journal of Environmental Biology October 2006, 27(4) 633-637
(2006).
 T., Subramani, S. Krishnan, and P.K., Kumaresan. Study of Groundwater Quality with GIS
Application for Coonoor Taluk in Nilgiri District. International Journal of Modern Engineering
Research. 2012. 2 (3) 586-592.
 Amanial Haile Reda. Physico-Chemical Analysis of Drinking Water Quality of Arbaminch
Town. Journal of Environmental & Analytical Toxicology
SLIDE NO 50
SLIDE NO 51

Physico chemical analysis and gis slideshare

  • 1.
    HKBK COLLEGE OFENGINEERING “PHYSICO-CHEMICALANALYSIS OF GROUND WATER QUALITY OF AND APPLICATION OF GIS AND REMOTE SENSING TECHNIQUE” SLIDE NO 1
  • 2.
    CONTENTS  INTRODUCTION  LITERATUREREVIEW  OBJECTIVES OF THE PROPOSED WORK  SCOPE OF THE PROPOSED WORK  PHYSICO CHEMICAL PARAMETERS  PHOTOGRAPHS OF THE APPARATUS USED FOR PHYSICO CHEMICALANALYSIS  METHODOLOGY OF THE PROPOSED WORK  STUDY AREA MAP  GPS DEVICE  REMOTE SENSING DATA  RESULTS AND DISCUSSION  SPATIAL VARIATION OF PHYSICOCHEMICAL PARAMETERS  GROUND WATER QUALITY MAP  CONCLUSIONS  REFERENCES SLIDE NO 2
  • 3.
    INTRODUCTION Physico-Chemical Analysis: Itbasically refers to the analysis of physical and chemical parameters of water IMPORTANCE:  It enables us to determine the extent to which water is potable for drinking  It is helpful in determining whether the groundwater is contaminated with sewage or not SLIDE NO 3
  • 4.
     Recently, G.Sheeba, Anjaneyulu Jalagam and Padma Venkatasubramanian (November 2017) conducted the study on various parameters of ground water in peri urban Bengaluru. They found that the ground water was poor in quality with refence to its chemical and various other parameters  Therefore, it may be possible that the residents of Bangalore Urban may be utilizing ground water which is unhygienic. Thus, this is one of our motive to carry out this project. LITERATURE REVIEW SLIDE NO 4
  • 5.
    OBJECTIVES OF THEPROPOSED WORK  To analyze the ground water quality of bangalore urban area by determining various physico-chemical parameters  To learn and apply the technique of GIS AND REMOTE SENSING for groundwater quality assessment  To assess the suitability of groundwater for drinking purposes  To generate the spatial variation maps of various physico- chemical parameters by using ArcGIS  Finally, to generate ground water quality map with the help of the software ArcGIS 10.5 by using WQI SLIDE NO 5
  • 6.
    SCOPE OF THEPROPOSED WORK  The physico-chemical analysis of ground water quality helps us to determine whether the ground water is contaminated with impurities such as sewage or not.  This analysis helps us to determine whether the polluted water has been infiltrated into the groundwater.  This analysis also helps us to determine the extent to which groundwater is safe for drinking, bathing, washing utensils, etc.  This enables us to determine the suitability of groundwater for drinking purpose which is vital aspect of this project. SLIDE NO 6
  • 7.
     Turbidity  pH Alkalinity  Electrical conductivity  Total solids  Total Dissolved Solids  Dissolved Oxygen  Lead content  Sulphate  Nitrate  Total Hardness  Suspended Solids PHYSICO CHEMICAL PARAMETERS SLIDE NO 7
  • 8.
    PHOTOGRAPHS OF THEAPPARATUS USED FOR PHYSICO CHEMICAL ANALYSIS TURBIDITY METER pH METER SLIDE NO 8
  • 9.
    PHOTOGRAPHS OF THEAPPARATUS USED FOR PHYSICO CHEMICAL ANALYSIS BUNSEN BURNER ALONG WITH EVAPORATING DISH MAGNETIC STIRRER SLIDE NO 9
  • 10.
    PHOTOGRAPHS OF THEAPPARATUS USED FOR PHYSICO CHEMICAL ANALYSIS SPECTROPHOTOMETER DIGITAL CONDUCTIVITY METER SLIDE NO 10
  • 11.
  • 12.
  • 13.
    GPS DEVICE  RemoteSensing data (GPS Data) was collected with the help of the instrument as shown  GPS data of all the Selected Sampling points was collected in terms of latitude north of equator and longitude east of meridian SLIDE NO 13
  • 14.
  • 15.
    RESULTS SAMPLES 1 2 3 4 5 6 7 8 9 10 11 12 SLIDE NO 15 Lead(mg/l) Total Solids (mg/l) Electrical Conductivity (mS/cm) Turbidity in NTU Total Dissolved Solids (mg/l) GROUND_WQI 0.0034 2500 3.726 0.00 2500 33.842 0.0019 2000 2.164 0.00 1500 19.075 0.0037 2500 3.326 0.00 2000 36.904 0.0049 2000 2.945 0.00 2000 48.603 0.0081 2500 3.718 0.00 2500 80.218 0.0038 2000 2.475 0.00 1500 37.767 0.0044 2500 3.297 0.00 2000 43.688 0.0039 2500 3.627 0.00 2500 38.833 0.0057 1500 2.731 0.00 1500 56.529 0.0040 2000 2.147 0.00 1500 39.680 0.0039 1500 2.265 0.00 1500 38.712 0.0021 2500 3.729 0.00 2500 20.972 Ph with pH meter Alkalinity (mg/l) Sulphate as SO4 (mg/l) Nitrate as NO3 (mg/l) Total hardness as CaCo3 (mg/l) 7.25 84.00 75.41 20.25 348.00 8.08 272.00 45.89 2.83 268.00 7.52 328.00 83.00 20.70 324.00 7.10 176.00 179.05 19.99 195.00 6.96 244.00 161.62 45.64 724.00 7.34 220.00 67.47 14.03 240.00 7.06 320.00 68.06 16.33 528.00 8.20 190.00 71.14 8.74 656.00 7.68 184.00 109.44 6.31 260.00 6.85 128.00 24.30 17.40 172.00 6.66 186.00 115.61 32.04 182.00 6.92 96.00 35.21 21.59 272.00 SAMPLES 1 2 3 4 5 6 7 8 9 10 11 12
  • 16.
    0 1 2 3 4 5 6 7 8 9 1 2 34 5 6 7 8 9 10 11 12 pH Ph with pH meter pH with pH paper 0 1 2 3 4 5 6 7 8 9 0 1 2 3 4 5 6 7 8 9 10 11 12 13 Ph with pH meter 0 1 2 3 4 5 6 7 8 9 0 1 2 3 4 5 6 7 8 9 10 11 12 13 pH with pH paper Acceptable limit as per IS10500:2012 is 6.5-8.5 SLIDE NO 16
  • 17.
    Acceptable limit asper IS10500:2012 is 200 ppm Permissible limit as per IS10500:2012 is 600 ppm 0 50 100 150 200 250 300 350 1 2 3 4 5 6 7 8 9 10 11 12 Alkalinity (mg/l) 0 50 100 150 200 250 300 350 0 1 2 3 4 5 6 7 8 9 10 11 12 13 Alkalinity (mg/l) SLIDE NO 17
  • 18.
    0 20 40 60 80 100 120 140 160 180 200 1 2 34 5 6 7 8 9 10 11 12 SULPHATE as SO4 (mg/l) 0 20 40 60 80 100 120 140 160 180 200 0 1 2 3 4 5 6 7 8 9 10 11 12 13 Sulphate as SO4 (mg/l) Acceptable limit as per IS10500:2012 is 200 ppm Permissible limit as per IS10500:2012 is 400 ppm SLIDE NO 18
  • 19.
    0 5 10 15 20 25 30 35 40 45 50 1 2 34 5 6 7 8 9 10 11 12 Nitrate as NO3 (mg/l) Acceptable limit as per IS10500:2012 is 45 ppm 0 5 10 15 20 25 30 35 40 45 50 0 1 2 3 4 5 6 7 8 9 10 11 12 13 Nitrate as NO3 (mg/l) SLIDE NO 19
  • 20.
    0 100 200 300 400 500 600 700 800 1 2 34 5 6 7 8 9 10 11 12 Total hardness as CaCo3 (mg/l) 0 100 200 300 400 500 600 700 800 0 1 2 3 4 5 6 7 8 9 10 11 12 13 Total hardness as CaCo3 (mg/l) Acceptable limit as per IS10500:2012 is 200 ppm Permissible limit as per IS10500:2012 is 600 ppm SLIDE NO 20
  • 21.
    0 1 2 3 4 5 6 1 2 34 5 6 7 8 9 10 11 12 Dissolved Oxygen (mg/l) 0 1 2 3 4 5 6 0 1 2 3 4 5 6 7 8 9 10 11 12 13 Dissolved Oxygen (mg/l) SLIDE NO 21
  • 22.
    0.0 0.5 1.0 1.5 2.0 2.5 3.0 3.5 4.0 1 2 34 5 6 7 8 9 10 11 12 Electrical Conductivity (mS/cm) 0.0 0.5 1.0 1.5 2.0 2.5 3.0 3.5 4.0 0 1 2 3 4 5 6 7 8 9 10 11 12 13 Electrical Conductivity (mS/cm) SLIDE NO 22
  • 23.
    Acceptable limit asper IS10500:2012 is 0.01 ppm 0.000 0.001 0.002 0.003 0.004 0.005 0.006 0.007 0.008 0.009 1 2 3 4 5 6 7 8 9 10 11 12 Lead (mg/l) 0.000 0.001 0.002 0.003 0.004 0.005 0.006 0.007 0.008 0.009 0 1 2 3 4 5 6 7 8 9 10 11 12 13 Lead (mg/l) SLIDE NO 23
  • 24.
    0 500 1000 1500 2000 2500 3000 1 2 34 5 6 7 8 9 10 11 12 Total Solids (mg/l) 0 500 1000 1500 2000 2500 3000 0 1 2 3 4 5 6 7 8 9 10 11 12 13 Total Solids (mg/l) SLIDE NO 24
  • 25.
    0 500 1000 1500 2000 2500 3000 1 2 34 5 6 7 8 9 10 11 12 13 Total Dissolved Solids (mg/l) 0 500 1000 1500 2000 2500 3000 0 1 2 3 4 5 6 7 8 9 10 11 12 13 Total Dissolved Solids (mg/l) Acceptable limit as per IS10500:2012 is 500 ppm Permissible limit as per IS10500:2012 is 2000 ppm SLIDE NO 25
  • 26.
    Ground Water Quality dependson Water Quality Index (WQI) 0 10 20 30 40 50 60 70 80 90 0 1 2 3 4 5 6 7 8 9 10 11 12 13 Water Quality Index (WQI) 0 10 20 30 40 50 60 70 80 90 1 2 3 4 5 6 7 8 9 10 11 12 Water Quality Index (WQI) SLIDE NO 26
  • 27.
    This Sample wastaken from HBR LAYOUT and it lies in latitude North 13˚02'7.64“ of equator and longitude East 077˚37'51.66“ of meridian Since WQI is 33.842 the ground water quality of this sampling point as per water quality index model is GOOD SLIDE NO 27
  • 28.
    This Sample wastaken from SAGAYAPURAM and it lies in latitude North 13˚00'19.82“ of equator and longitude East 077˚36'59.26“ of meridian Since WQI is 19.075 the ground water quality of this sampling point as per water quality index model is EXCELLENT SLIDE NO 28
  • 29.
    This Sample wastaken from MUNESHWARA NAGAR and it lies in latitude North 13˚02'14.69“ of equator and longitude East 077˚36'11.90“ of meridian Since WQI is 36.904 the ground water quality of this sampling point as per water quality index model is GOOD SLIDE NO 29
  • 30.
    This Sample wastaken from VISHWANATH NAGENAHALLI and it lies in latitude North 13˚02'14.69“ of equator and longitude East 077˚36'10.89“ of meridian Since WQI is 48.603 the ground water quality of this sampling point as per water quality index model is GOOD SLIDE NO 30
  • 31.
    This Sample wastaken from KACHARAKANAHALLI and it lies in latitude North 13˚01'5.67“ of equator and longitude East 077˚38'3.54“ of meridian Since WQI is 80.218 the ground water quality of this sampling point as per water quality index model is VERY POOR SLIDE NO 31
  • 32.
    This Sample wastaken from JAKKURU-2 and it lies in latitude North 13˚04'46.84“ of equator and longitude East 077˚36'52.21“ of meridian Since WQI is 37.767 the ground water quality of this sampling point as per water quality index model is GOOD SLIDE NO 32
  • 33.
    This Sample wastaken from NAGAWARA and it lies in latitude North 13˚01'58.56“ of equator and longitude East 077˚37'4.30“ of meridian Since WQI is 43.688 the ground water quality of this sampling point as per water quality index model is GOOD SLIDE NO 33
  • 34.
    This Sample wastaken from HORAMAVU and it lies in latitude North 13˚02'33.47“ of equator and longitude East 077˚39'18.26“ of meridian Since WQI is 38.833 the ground water quality of this sampling point as per water quality index model is GOOD SLIDE NO 34
  • 35.
    This Sample wastaken from THANISANDRA and it lies in latitude North 13˚03'8.91“ of equator and longitude East 077˚37'24.30“ of meridian Since WQI is 56.529 the ground water quality of this sampling point as per water quality index model is POOR SLIDE NO 35
  • 36.
    This Sample wastaken from KEMPEGOWDA WARD and it lies in latitude North 13˚07'37.95“ of equator and longitude East 077˚35'49.60“ of meridian Since WQI is 39.680 the ground water quality of this sampling point as per water quality index model is GOOD SLIDE NO 36
  • 37.
    This Sample wastaken from BYATARAYANAPURA and it lies in latitude North 13˚04'1.35“ of equator and longitude East 077˚35'27.83“ of meridian Since WQI is 38.712 the ground water quality of this sampling point as per water quality index model is GOOD SLIDE NO 37
  • 38.
    This Sample wastaken from JAKKURU and it lies in latitude North 13˚06’05” of equator and longitude East 077˚38'28" of meridian Since WQI is 20.972 the ground water quality of this sampling point as per water quality index model is EXCELLENT SLIDE NO 38
  • 39.
  • 40.
  • 41.
  • 42.
  • 43.
  • 44.
  • 45.
  • 46.
  • 47.
  • 48.
  • 49.
  • 50.
    REFERENCES  Environmental ProtectionAdministration, R.O.C., Taiwan. Environmental Water Quality Information.  This analysis helps us to determine whether the water is suitable for irrigation purposes  K. L. Prakash and R. K. Somashekar. Groundwater quality - Assessment on Anekal Taluk, Bangalore Urban district, India. Journal of Environmental Biology October 2006, 27(4) 633-637 (2006).  T., Subramani, S. Krishnan, and P.K., Kumaresan. Study of Groundwater Quality with GIS Application for Coonoor Taluk in Nilgiri District. International Journal of Modern Engineering Research. 2012. 2 (3) 586-592.  Amanial Haile Reda. Physico-Chemical Analysis of Drinking Water Quality of Arbaminch Town. Journal of Environmental & Analytical Toxicology SLIDE NO 50
  • 51.