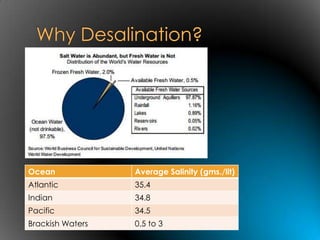
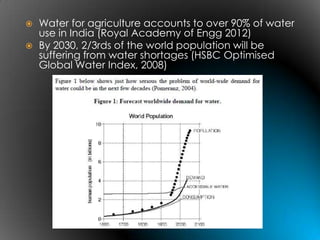
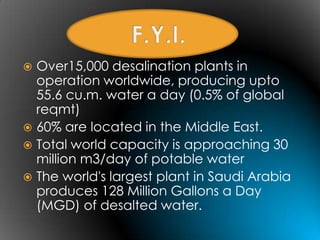
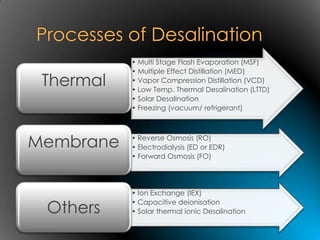
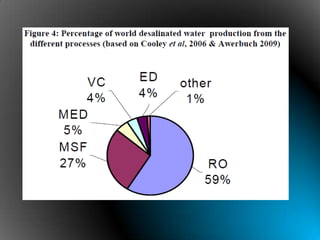
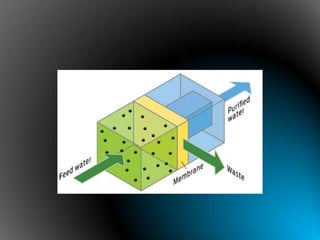


Removing dissolved minerals from seawater through desalination could help address freshwater shortages but faces challenges. Over 15,000 desalination plants operate worldwide using methods like reverse osmosis or thermal distillation. However, desalination is energy intensive and produces toxic brine waste. New technologies aim to reduce energy usage and better handle brine, but challenges around cost and environmental impact remain.


