Downloaded 74 times

![Introduction
The skills deficit in quantitative methods in UK
social science is well documented and the focus
of substantial investment from agencies
including the ESRC, the British Academy, HEFCE,
HEFCW, the Scottish Funding Council, the
Nuffield Foundation and the Higher Education
Academy. The International Benchmarking
Review of UK Human Geography (2013) states
that “in many sub-disciplines it [human
geography] is world leading, setting the
intellectual agenda...” but identifies a “relative
weakness in quantitative methods and GIS” due
to “the relative neglect of quantitative methods
in undergraduate and postgraduate training...”
Appreciation of quantitative methods does not
begin and end with universities, however.
Schools provide a student’s first exposure;
career opportunities provide an incentive to
practise numeracy and develop analytical data-
handling skills. In a joined-up world there would
be clear trajectories from the geography taught
at schools, through the more specialised
teaching of universities, to the needs and
requirements of employers and the transferable
skills they seek.
It is tempting to think that such links have been
broken, pointing to the apparent marginalisation
of quantitative methods from human geography
as evidence. But should common wisdom about
the poor state of quantitative methods teaching
be believed? Are we really nurturing a generation
of students that is sceptical about, hostile to, or
simply afraid of using numerical approaches in
geographical enquiry? If so, what can be done to
turn the tide?
To answer these questions we undertook
surveys of school teachers, university students,
university instructors and heads of teaching
within UK geography departments to gain a
better understanding of the current state of play:
about what it is being taught in schools and
universities, attitudes towards it, and about what
might be done to help support quantitative
teaching and learning; all backed-up by a
systematic review of university courses and
resources. Peer networking events were held at
the Royal Geographical Society (with IBG)’s
annual conference, and with the Higher
Education Academy to look at maths and stats
skills in the transition from schools to university.
Our findings do not discount what some regard
as the diminished importance given to
quantitative methods (in human geography
especially) nor the frustration and sometimes
lack of support given to those who teach them.
Yet, we find no evidence that quantitative
methods have been abandoned: the typical
student in geography will still encounter them in
their course and training. It may well be that
what is taught is insufficiently demanding
(mathematically) to meet more advanced
research needs and to compete with the levels
of quantitative methods training found in some
other countries. It may also be somewhat
backward-looking, firmly embedded in the
paradigm of small-sample, frequentist statistical
methods that are not necessarily appropriate to
effective analysis, visualization and handling of
so-called ‘big data‘ where the idea of random
sampling is spurious and traditional notions of
statistical significance have little meaning.
Nevertheless, we believe that pessimistic
readings of the current situation do not tell the
whole story. Rather, we find reason to believe
that geography is in a position of relative
strength with the opportunity to build on
existing good practice and to strengthen the
quantitative methods training it provides to
pupils and students.
We recommend that the Benchmark Statement
for the discipline be updated to reflect this, and
that ways be found to work with schools, data
agencies and examination authorities to embed
interaction with data within the GCSE and A-level
curricula in more imaginative ways - using
creative media such as Hans Rosling’s
GapMinder tools, or open data sites such as The
Guardian Data Store. Forming a community of
practitioners that bridges between schools,
universities and employers, and which offers
peer support and training, will be to the long
term benefit of the discipline. The British
Academy has begun scoping work for a graduate
level qualification in quantitative methods,
acting as a ‘kite mark’ for study in the social
sciences. We watch this development with
interest.
To be clear: we are not arguing for the
dominance of quantitative methods at the
expense of qualitative or any other approaches.
Our discipline has been, and should remain, a
broad church that gains from a diverse body of
members. Nevertheless, the current climate is
one in which concerns have been raised (and
demonstrated) about the under-capacity in
quantitative methods within UK social science.
Geography retains capacity. Now is the time to
build on it.
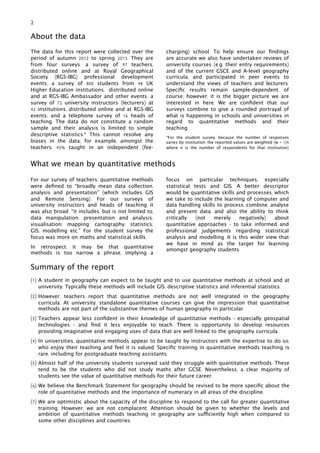
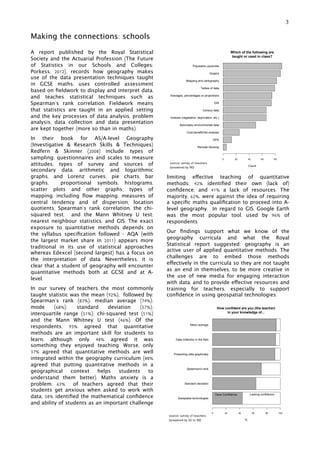
Of 580 geography students in year 2 or above
46% disagreed
that their geography course had too much
focus on maths and statistics.
Only 17% agreed
1](https://image.slidesharecdn.com/report-130906041556-/85/Quantitative-Methods-in-Geography-Making-the-Connections-between-Schools-Universities-and-Employers-2-320.jpg)
![Making the connections: employers
A 2011 report by the Advisory Committee on
Mathematics Education (Mathematical Needs:
Mathematics in the workplace and in Higher
Education) comments on interviews undertaken
in universities and across sectors of
employment. It states, “we need more young
people to know more mathematics and to be
confident in using it” (p.1) Two reasons are
given.
First, “the quantitative demands of almost all
university courses are increasing” - it cites
history as a discipline that now recognises the
value of statistics.
Second, “in the workforce there is a steady shift
away from manual and low-skill jobs towards
those requiring higher levels of management
expertise and problem-solving skills, many of
which are mathematical in nature.”
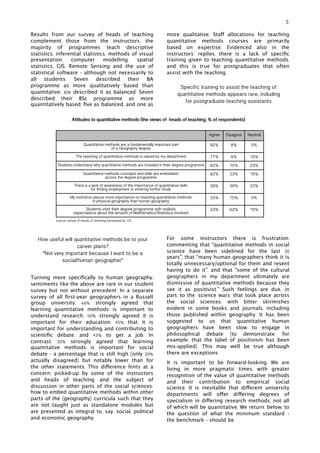
Although we would argue that there are good,
intellectual reasons for learning quantitative
methods to enable geographical learning and
enquiry, the added advantage that these
methods also offer a transferable skill that is
important in the workplace is undeniable.
For this report we did not survey employers
about the value they place on quantitative
methods (we did not wish to duplicate existing
research, see: http://www.rgs.org/OurWork/Study
+Geography/Careers/Employability.htm). Instead, we
worked with representatives of the
environmental, insurance, financial, local
government, humanitarian and other sectors to
produce a series of short videos and
accompanying case studies showing how and
why they use quantitative methods in their work.
We hope these will be useful to students - in
schools and universities - who are considering
the merits of learning quantitative methods with
geography.
They are available to view and to download at
the website www.quantile.info (under Case
Studies)
Making the connections: the benchmark statement
Here we provide a brief overview of the
benchmark statements for Geography and other
selected disciplines, noting where they reference
quantitative methods. Recommendations are
made for the next benchmark statement. A draft
version of those recommendations was prepared
by the authors; feedback was then solicited
from peers before a further consultation took
place inviting comments from subscribers to the
RGS-IBG Quantitative Methods and GIScience
Research Groups mailing lists. The final
recommendations as they appear below reflect
the body of opinion from those research
communities.
Current benchmark statements
The specific reference to quantitative methods is
in Section 3.12:
3.12 [A]ll geographers should be conversant with
a substantial range of analytical and
observational strategies, including most or all of
the following: social survey and interviewing
methods; geographical field research; laboratory-
based analysis (both scientific and
computational); quantitative analysis; qualitative
analysis; and modelling strategies. Students
should also be familiar with the developing
technology associated with these strategies,
such as computer packages for statistical and
qualitative analysis, specialist computing and
remote sensing.
The equivalent reference in Earth Sciences,
Environmental Sciences and Environmental
Studies (2007) is similar although adding more
specific consideration of sampling:
3.10 The graduate key skills that should be
developed in ES3 degree programmes are:
appreciating issues of sample selection,
accuracy, precision and uncertainty during
6
We have produced a series of videos and
case studies showing how quantitative
methods are used in the workplace.
They are available at
www.quantile.info](https://image.slidesharecdn.com/report-130906041556-/85/Quantitative-Methods-in-Geography-Making-the-Connections-between-Schools-Universities-and-Employers-7-320.jpg)

The document discusses the skills deficit in quantitative methods within UK social science, particularly human geography, highlighting the disconnect between school teaching and university requirements. Surveys reveal that while students still engage with quantitative methods, many struggle with them, especially those who have not pursued maths beyond GCSE, and teachers report low confidence in teaching these skills. Recommendations include updating benchmark statements for geography to emphasize the importance of quantitative methods and fostering collaboration between schools, universities, and employers to enhance students' quantitative training and confidence.